Financial Decision Making: Ocado Group Analysis and Strategies
VerifiedAdded on 2021/05/27
|19
|3534
|89
Report
AI Summary
This report provides a comprehensive financial analysis of Ocado Group, examining its performance over a five-year period. It delves into various financial and non-financial ratios, including profitability, liquidity, efficiency, and key performance indicators (KPIs). The analysis includes detailed tables and figures illustrating these ratios and trends. Furthermore, the report assesses the company's corporate governance compliance and its impact on brand reputation. It concludes with recommendations for medium-term financial strategies, aiming to position Ocado Group for potential inclusion in the FTSE 100. The report covers an overview of the company, financial ratio analysis (profitability, liquidity, efficiency), key performance indicators, non-financial ratios, share price analysis, and overall comments. The report also analyzes the product waste ratio, active customer base, solution partnerships, CFC efficiency and share price analysis of Ocado Group.
THE UNIVERSITY OF NORTHAMPTON
Faculty of Business and Law
2017/2018
MODULE NAME: Financial Decision Making
Module Code Level Credit Value Module Leader
FINM036 7 20 Ewan Tracey
Faculty of Business and Law
2017/2018
MODULE NAME: Financial Decision Making
Module Code Level Credit Value Module Leader
FINM036 7 20 Ewan Tracey
Paraphrase This Document
Need a fresh take? Get an instant paraphrase of this document with our AI Paraphraser
TABLE OF CONTENTS
Section A....................................................................................................................................3
Overview of company............................................................................................................3
Financial ratios of Ocado Group............................................................................................3
Profitability and investment ratios of Ocado Group..........................................................3
Liquidity ratios of Ocado Group........................................................................................4
Efficiency ratios of Ocado Group......................................................................................5
Key performance indicators of Ocado Group....................................................................7
Non-financial ratios of Ocado Group.....................................................................................8
Product waste ratio.............................................................................................................9
Active customer base.........................................................................................................9
Solution partnership signed..............................................................................................10
CFC efficiency.................................................................................................................10
Share price analysis of Ocado Group...................................................................................11
Overall comment..................................................................................................................11
Section B..................................................................................................................................12
Evaluation of Company’s corporate governance compliance and its impact on the brand
and reputation.......................................................................................................................12
Medium-term financial strategies for Ocado Group............................................................12
References................................................................................................................................14
LIST OF TABLES
Table 1: Statement showing profitability ratios of Ocado Group..............................................5
Table 2: Statement showing liquidity ratios of Ocado Group....................................................6
Table 3: Statement showing efficiency ratios of Ocado Group.................................................7
⊘ This is a preview!⊘
Do you want full access?
Subscribe today to unlock all pages.
Trusted by 1+ million students worldwide
LIST OF FIGURES
Figure 1: Profitability ratios of Ocado Group............................................................................6
Figure 2: Liquidity ratios of Ocado Group................................................................................7
Figure 3: Efficiency ratios of Ocado Group...............................................................................8
Figure 4: Key performance indicators of Ocado Group...........................................................10
Figure 5: Non-financial ratios of Ocado Group.......................................................................11
Figure 6: Product waste ratio...................................................................................................11
Figure 7: Active customer base ratio.......................................................................................12
Figure 8: Solution partnership signed......................................................................................12
Figure 9: CFC efficiency ratio.................................................................................................13
Figure 10: Share price analysis of Ocado Group.....................................................................14
Paraphrase This Document
Need a fresh take? Get an instant paraphrase of this document with our AI Paraphraser
INTRODUCTION
The Present study is based on the evaluation of financial performance and corporate
governance compliance of Ocado Company by considering data of previous five financial
years. First part of the study will include financial and non-financial ratios by considering
factors such as profitability, liquidity, share prices and key performance indicators. Further,
second part of the study assess effective of corporate governance of company and
recommendations for medium-term financial strategies for Ocado Group so they can be get
listed in FTSE 100.
SECTION A
Overview of company
Ocado Company was founded in 2000 in the UK, and the headquarter of the company is
based in Hatfield, the United Kingdom. It is recognized as the world’s largest online grocery
seller which deals with the range of products including a pet shop, Sizzle, a kitchen, dining
store and beauty store. Due to the diversified product line, it is able to attract a large number
of customers, as their current customer’s base is approximately 5, 80,000. It can be stated that
Ocado deals with own brand groceries viaWaitrose supermarket. The mission of the company
is to provide customers with the best shopping experience in varied terms, i.e., best price,
quality and service terms, which is helpful in a developing strong business base (Ocado,
2014). Along with its store operations, it sells through Ocado.com hypermarket in the main
three specialities destination sites. In the recent last year, the company has earned £1,463.8
million revenues with the net income of approx £1.0 million. This organisation is listed under
London Stock Exchange.
Financial ratios of Ocado Group
Profitability and investment ratios of Ocado Group
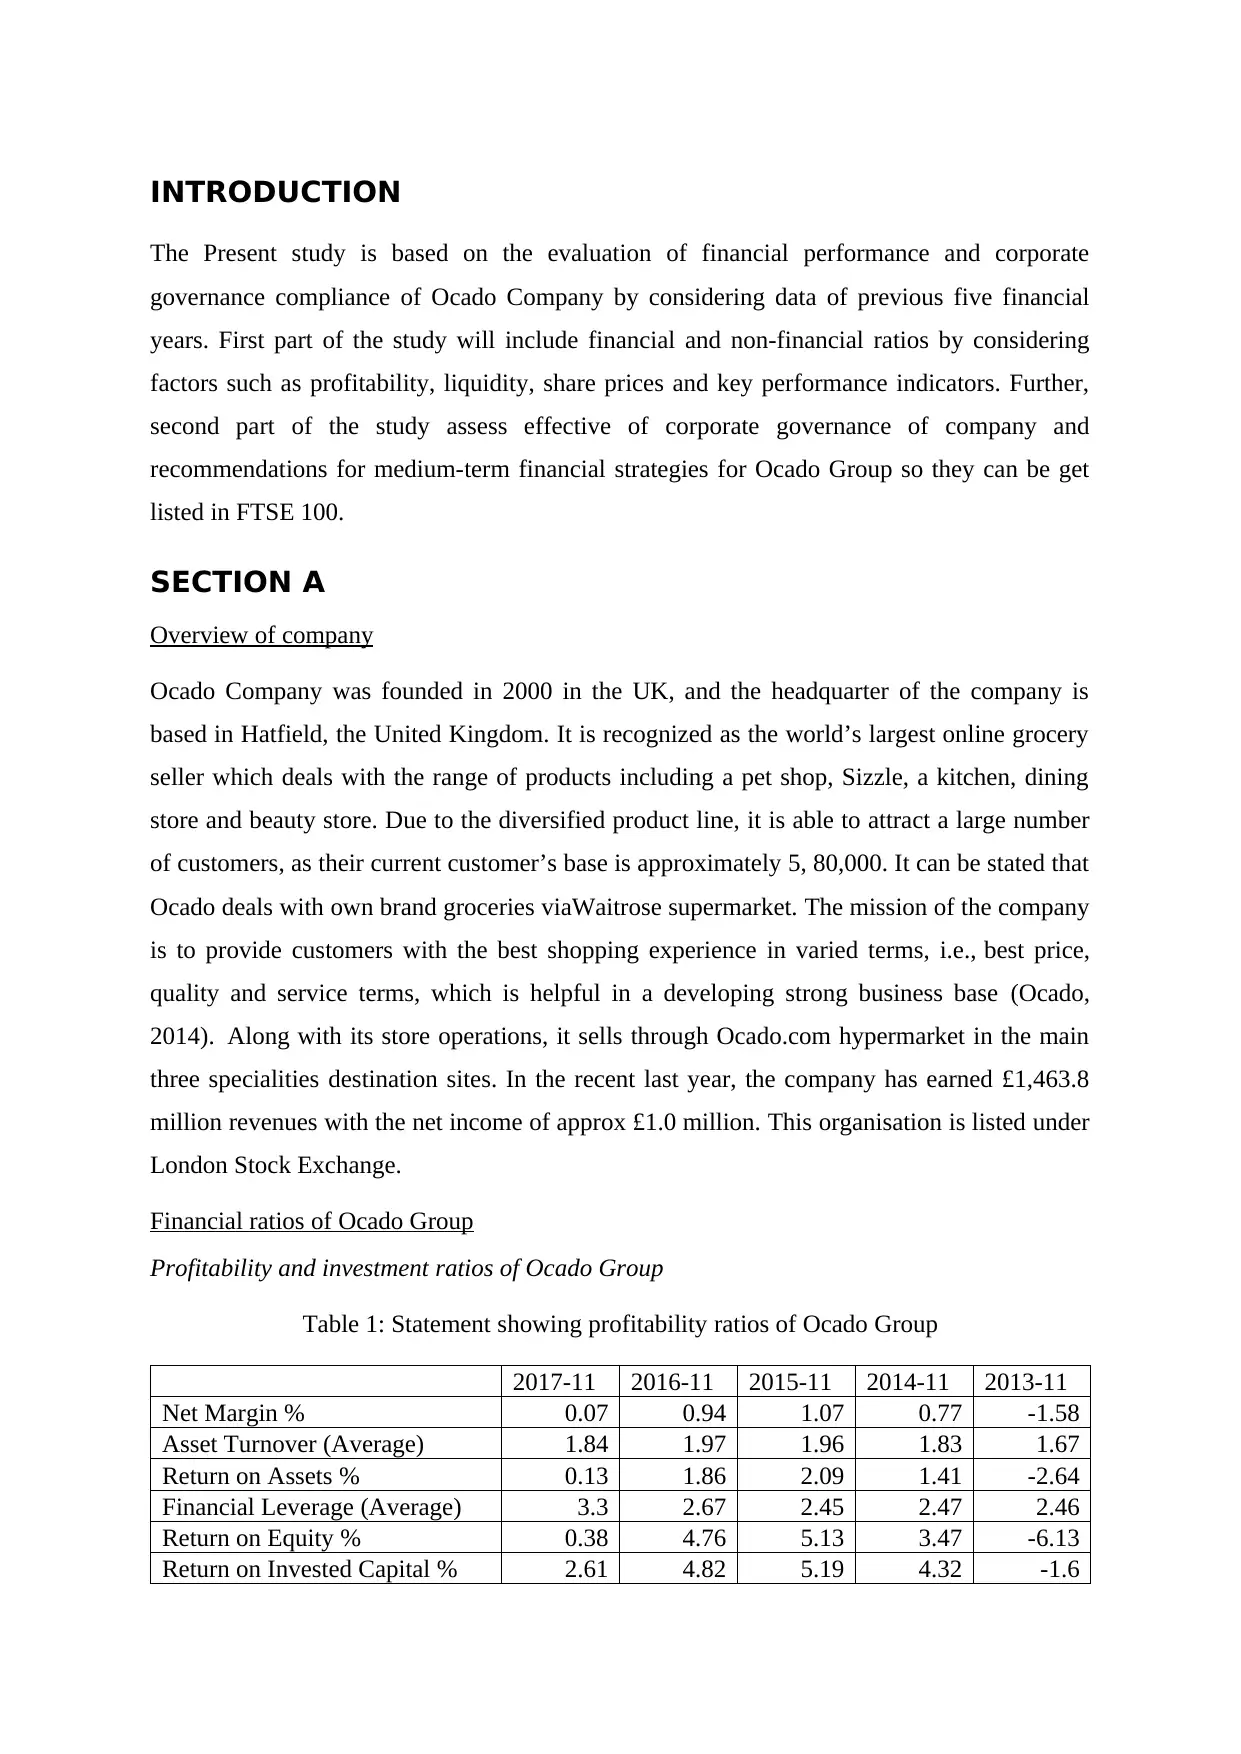
Table 1: Statement showing profitability ratios of Ocado Group
2017-11 2016-11 2015-11 2014-11 2013-11
Net Margin % 0.07 0.94 1.07 0.77 -1.58
Asset Turnover (Average) 1.84 1.97 1.96 1.83 1.67
Return on Assets % 0.13 1.86 2.09 1.41 -2.64
Financial Leverage (Average) 3.3 2.67 2.45 2.47 2.46
Return on Equity % 0.38 4.76 5.13 3.47 -6.13
Return on Invested Capital % 2.61 4.82 5.19 4.32 -1.6
The Present study is based on the evaluation of financial performance and corporate
governance compliance of Ocado Company by considering data of previous five financial
years. First part of the study will include financial and non-financial ratios by considering
factors such as profitability, liquidity, share prices and key performance indicators. Further,
second part of the study assess effective of corporate governance of company and
recommendations for medium-term financial strategies for Ocado Group so they can be get
listed in FTSE 100.
SECTION A
Overview of company
Ocado Company was founded in 2000 in the UK, and the headquarter of the company is
based in Hatfield, the United Kingdom. It is recognized as the world’s largest online grocery
seller which deals with the range of products including a pet shop, Sizzle, a kitchen, dining
store and beauty store. Due to the diversified product line, it is able to attract a large number
of customers, as their current customer’s base is approximately 5, 80,000. It can be stated that
Ocado deals with own brand groceries viaWaitrose supermarket. The mission of the company
is to provide customers with the best shopping experience in varied terms, i.e., best price,
quality and service terms, which is helpful in a developing strong business base (Ocado,
2014). Along with its store operations, it sells through Ocado.com hypermarket in the main
three specialities destination sites. In the recent last year, the company has earned £1,463.8
million revenues with the net income of approx £1.0 million. This organisation is listed under
London Stock Exchange.
Financial ratios of Ocado Group
Profitability and investment ratios of Ocado Group
Table 1: Statement showing profitability ratios of Ocado Group
2017-11 2016-11 2015-11 2014-11 2013-11
Net Margin % 0.07 0.94 1.07 0.77 -1.58
Asset Turnover (Average) 1.84 1.97 1.96 1.83 1.67
Return on Assets % 0.13 1.86 2.09 1.41 -2.64
Financial Leverage (Average) 3.3 2.67 2.45 2.47 2.46
Return on Equity % 0.38 4.76 5.13 3.47 -6.13
Return on Invested Capital % 2.61 4.82 5.19 4.32 -1.6
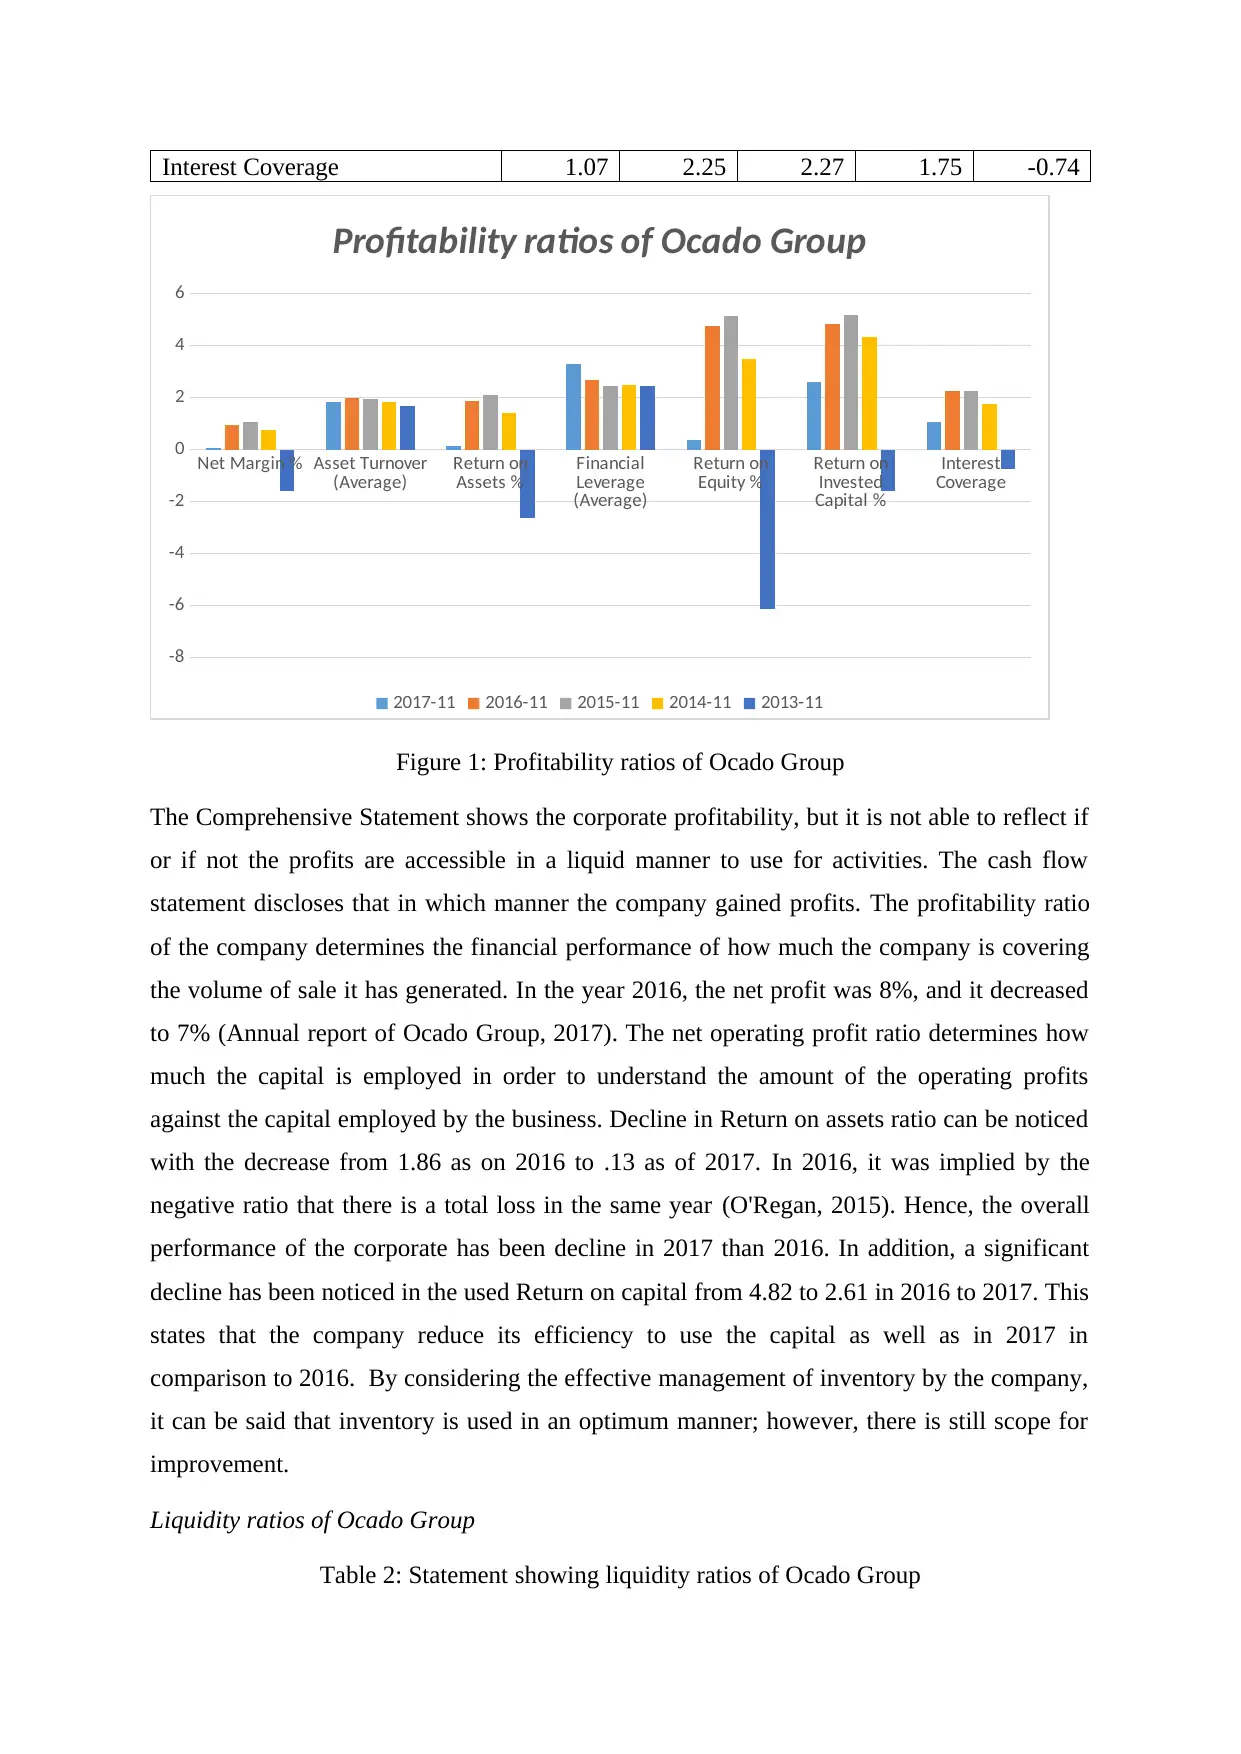
Interest Coverage 1.07 2.25 2.27 1.75 -0.74
Net Margin % Asset Turnover
(Average) Return on
Assets % Financial
Leverage
(Average)
Return on
Equity % Return on
Invested
Capital %
Interest
Coverage
-8
-6
-4
-2
0
2
4
6
Profitability ratios of Ocado Group
2017-11 2016-11 2015-11 2014-11 2013-11
Figure 1: Profitability ratios of Ocado Group
The Comprehensive Statement shows the corporate profitability, but it is not able to reflect if
or if not the profits are accessible in a liquid manner to use for activities. The cash flow
statement discloses that in which manner the company gained profits. The profitability ratio
of the company determines the financial performance of how much the company is covering
the volume of sale it has generated. In the year 2016, the net profit was 8%, and it decreased
to 7% (Annual report of Ocado Group, 2017). The net operating profit ratio determines how
much the capital is employed in order to understand the amount of the operating profits
against the capital employed by the business. Decline in Return on assets ratio can be noticed
with the decrease from 1.86 as on 2016 to .13 as of 2017. In 2016, it was implied by the
negative ratio that there is a total loss in the same year (O'Regan, 2015). Hence, the overall
performance of the corporate has been decline in 2017 than 2016. In addition, a significant
decline has been noticed in the used Return on capital from 4.82 to 2.61 in 2016 to 2017. This
states that the company reduce its efficiency to use the capital as well as in 2017 in
comparison to 2016. By considering the effective management of inventory by the company,
it can be said that inventory is used in an optimum manner; however, there is still scope for
improvement.
Liquidity ratios of Ocado Group
Table 2: Statement showing liquidity ratios of Ocado Group
⊘ This is a preview!⊘
Do you want full access?
Subscribe today to unlock all pages.
Trusted by 1+ million students worldwide
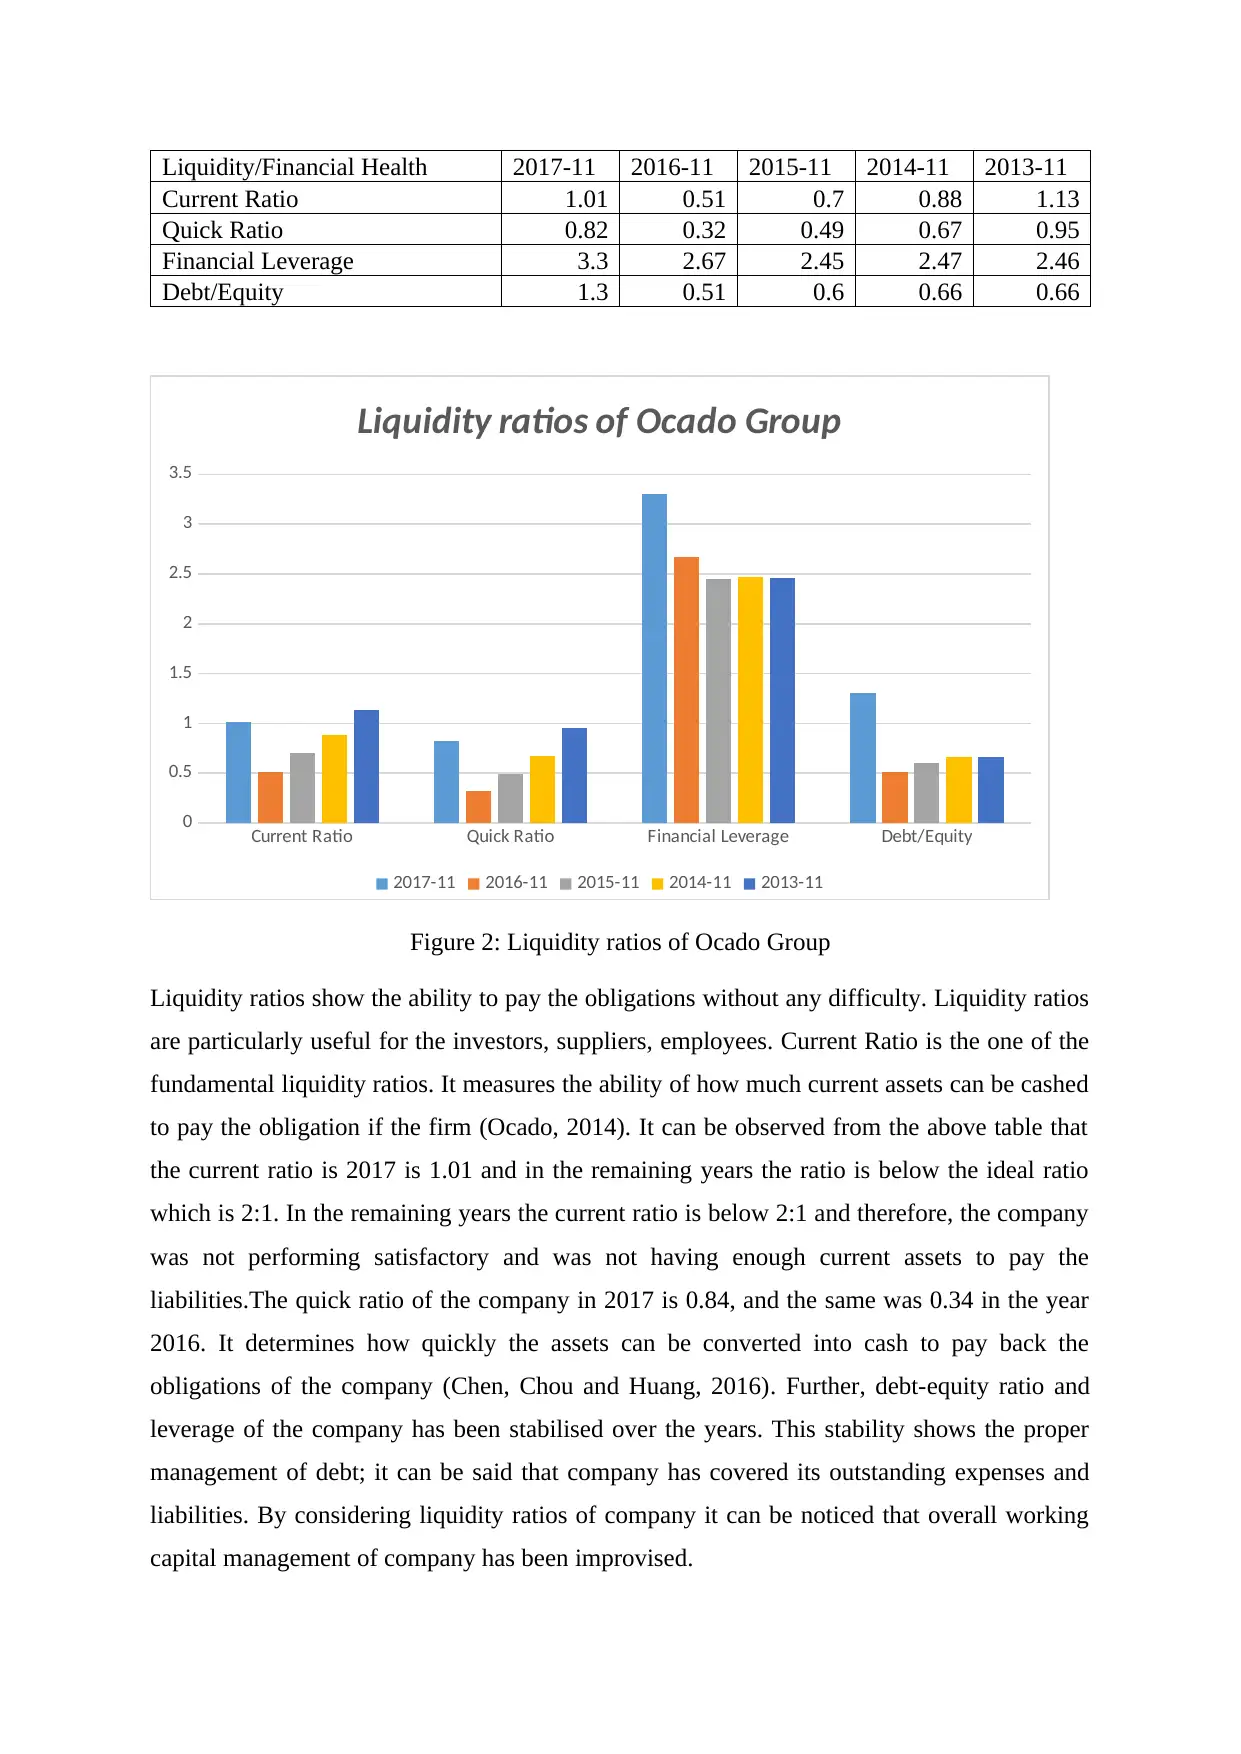
Liquidity/Financial Health 2017-11 2016-11 2015-11 2014-11 2013-11
Current Ratio 1.01 0.51 0.7 0.88 1.13
Quick Ratio 0.82 0.32 0.49 0.67 0.95
Financial Leverage 3.3 2.67 2.45 2.47 2.46
Debt/Equity 1.3 0.51 0.6 0.66 0.66
Current Ratio Quick Ratio Financial Leverage Debt/Equity
0
0.5
1
1.5
2
2.5
3
3.5
Liquidity ratios of Ocado Group
2017-11 2016-11 2015-11 2014-11 2013-11
Figure 2: Liquidity ratios of Ocado Group
Liquidity ratios show the ability to pay the obligations without any difficulty. Liquidity ratios
are particularly useful for the investors, suppliers, employees. Current Ratio is the one of the
fundamental liquidity ratios. It measures the ability of how much current assets can be cashed
to pay the obligation if the firm (Ocado, 2014). It can be observed from the above table that
the current ratio is 2017 is 1.01 and in the remaining years the ratio is below the ideal ratio
which is 2:1. In the remaining years the current ratio is below 2:1 and therefore, the company
was not performing satisfactory and was not having enough current assets to pay the
liabilities.The quick ratio of the company in 2017 is 0.84, and the same was 0.34 in the year
2016. It determines how quickly the assets can be converted into cash to pay back the
obligations of the company (Chen, Chou and Huang, 2016). Further, debt-equity ratio and
leverage of the company has been stabilised over the years. This stability shows the proper
management of debt; it can be said that company has covered its outstanding expenses and
liabilities. By considering liquidity ratios of company it can be noticed that overall working
capital management of company has been improvised.
Paraphrase This Document
Need a fresh take? Get an instant paraphrase of this document with our AI Paraphraser
Efficiency ratios of Ocado Group
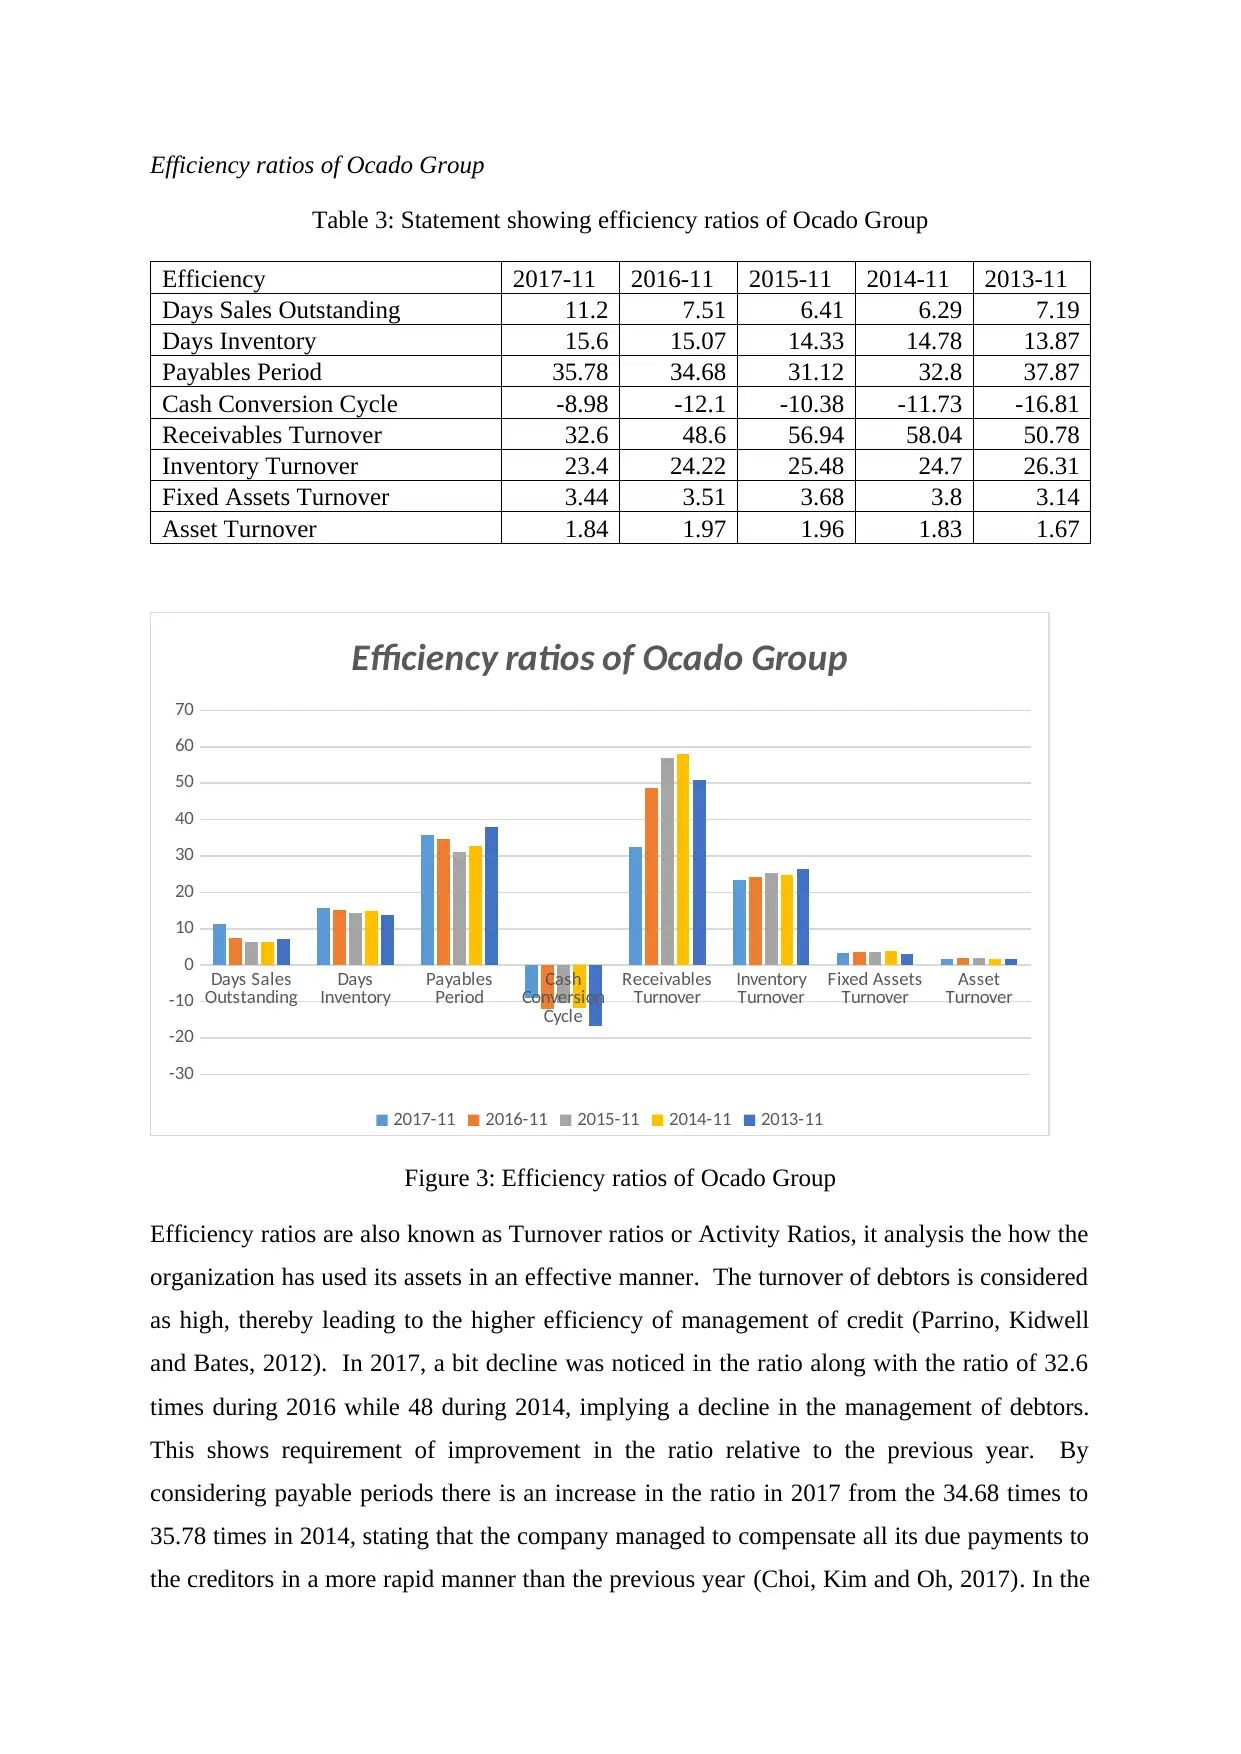
Table 3: Statement showing efficiency ratios of Ocado Group
Efficiency 2017-11 2016-11 2015-11 2014-11 2013-11
Days Sales Outstanding 11.2 7.51 6.41 6.29 7.19
Days Inventory 15.6 15.07 14.33 14.78 13.87
Payables Period 35.78 34.68 31.12 32.8 37.87
Cash Conversion Cycle -8.98 -12.1 -10.38 -11.73 -16.81
Receivables Turnover 32.6 48.6 56.94 58.04 50.78
Inventory Turnover 23.4 24.22 25.48 24.7 26.31
Fixed Assets Turnover 3.44 3.51 3.68 3.8 3.14
Asset Turnover 1.84 1.97 1.96 1.83 1.67
Days Sales
Outstanding Days
Inventory Payables
Period Cash
Conversion
Cycle
Receivables
Turnover Inventory
Turnover Fixed Assets
Turnover Asset
Turnover
-30
-20
-10
0
10
20
30
40
50
60
70
Efficiency ratios of Ocado Group
2017-11 2016-11 2015-11 2014-11 2013-11
Figure 3: Efficiency ratios of Ocado Group
Efficiency ratios are also known as Turnover ratios or Activity Ratios, it analysis the how the
organization has used its assets in an effective manner. The turnover of debtors is considered
as high, thereby leading to the higher efficiency of management of credit (Parrino, Kidwell
and Bates, 2012). In 2017, a bit decline was noticed in the ratio along with the ratio of 32.6
times during 2016 while 48 during 2014, implying a decline in the management of debtors.
This shows requirement of improvement in the ratio relative to the previous year. By
considering payable periods there is an increase in the ratio in 2017 from the 34.68 times to
35.78 times in 2014, stating that the company managed to compensate all its due payments to
the creditors in a more rapid manner than the previous year (Choi, Kim and Oh, 2017). In the
inventory ratio, there is a minor decline than the previous year but on an overall basis this
ratio has been stabilised. This aspect also implying good management of inventory by the
company.
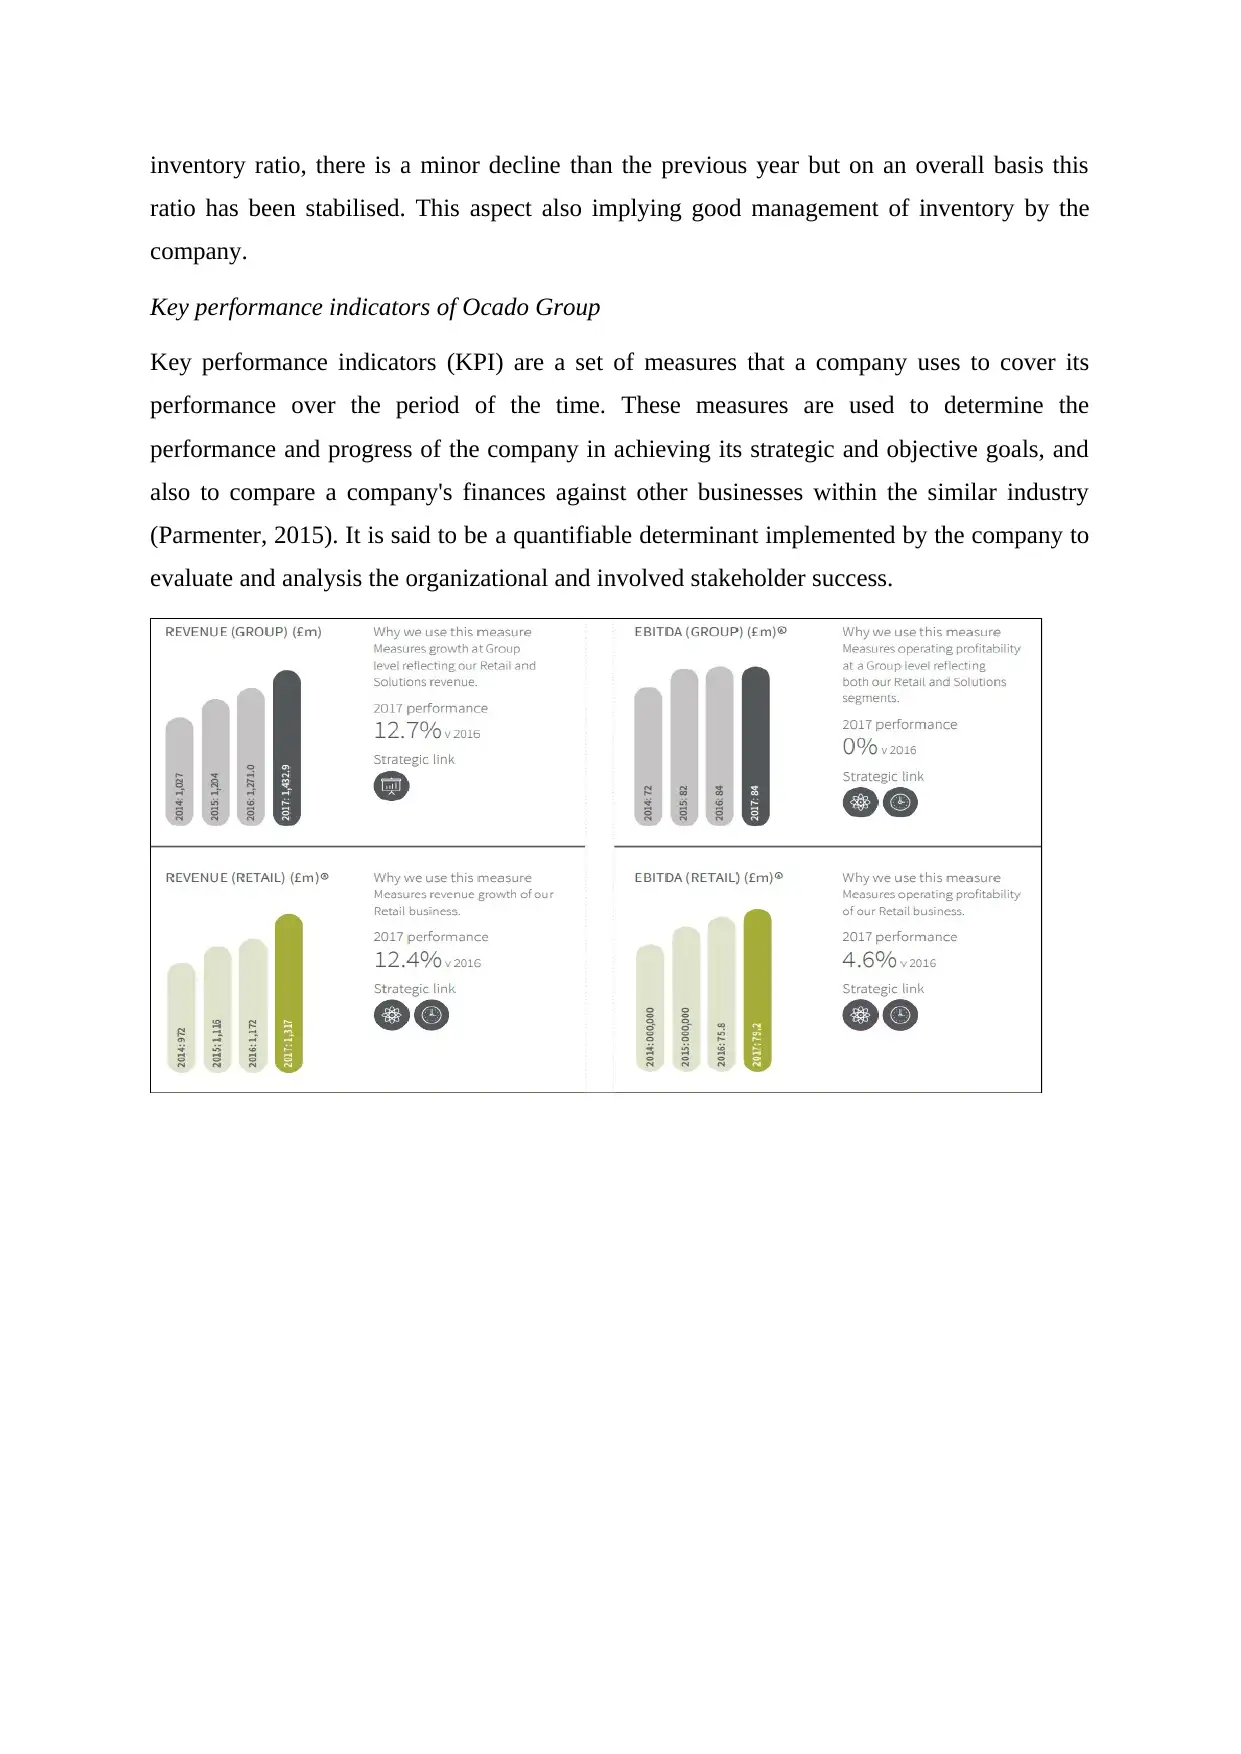
Key performance indicators of Ocado Group
Key performance indicators (KPI) are a set of measures that a company uses to cover its
performance over the period of the time. These measures are used to determine the
performance and progress of the company in achieving its strategic and objective goals, and
also to compare a company's finances against other businesses within the similar industry
(Parmenter, 2015). It is said to be a quantifiable determinant implemented by the company to
evaluate and analysis the organizational and involved stakeholder success.
ratio has been stabilised. This aspect also implying good management of inventory by the
company.
Key performance indicators of Ocado Group
Key performance indicators (KPI) are a set of measures that a company uses to cover its
performance over the period of the time. These measures are used to determine the
performance and progress of the company in achieving its strategic and objective goals, and
also to compare a company's finances against other businesses within the similar industry
(Parmenter, 2015). It is said to be a quantifiable determinant implemented by the company to
evaluate and analysis the organizational and involved stakeholder success.
⊘ This is a preview!⊘
Do you want full access?
Subscribe today to unlock all pages.
Trusted by 1+ million students worldwide
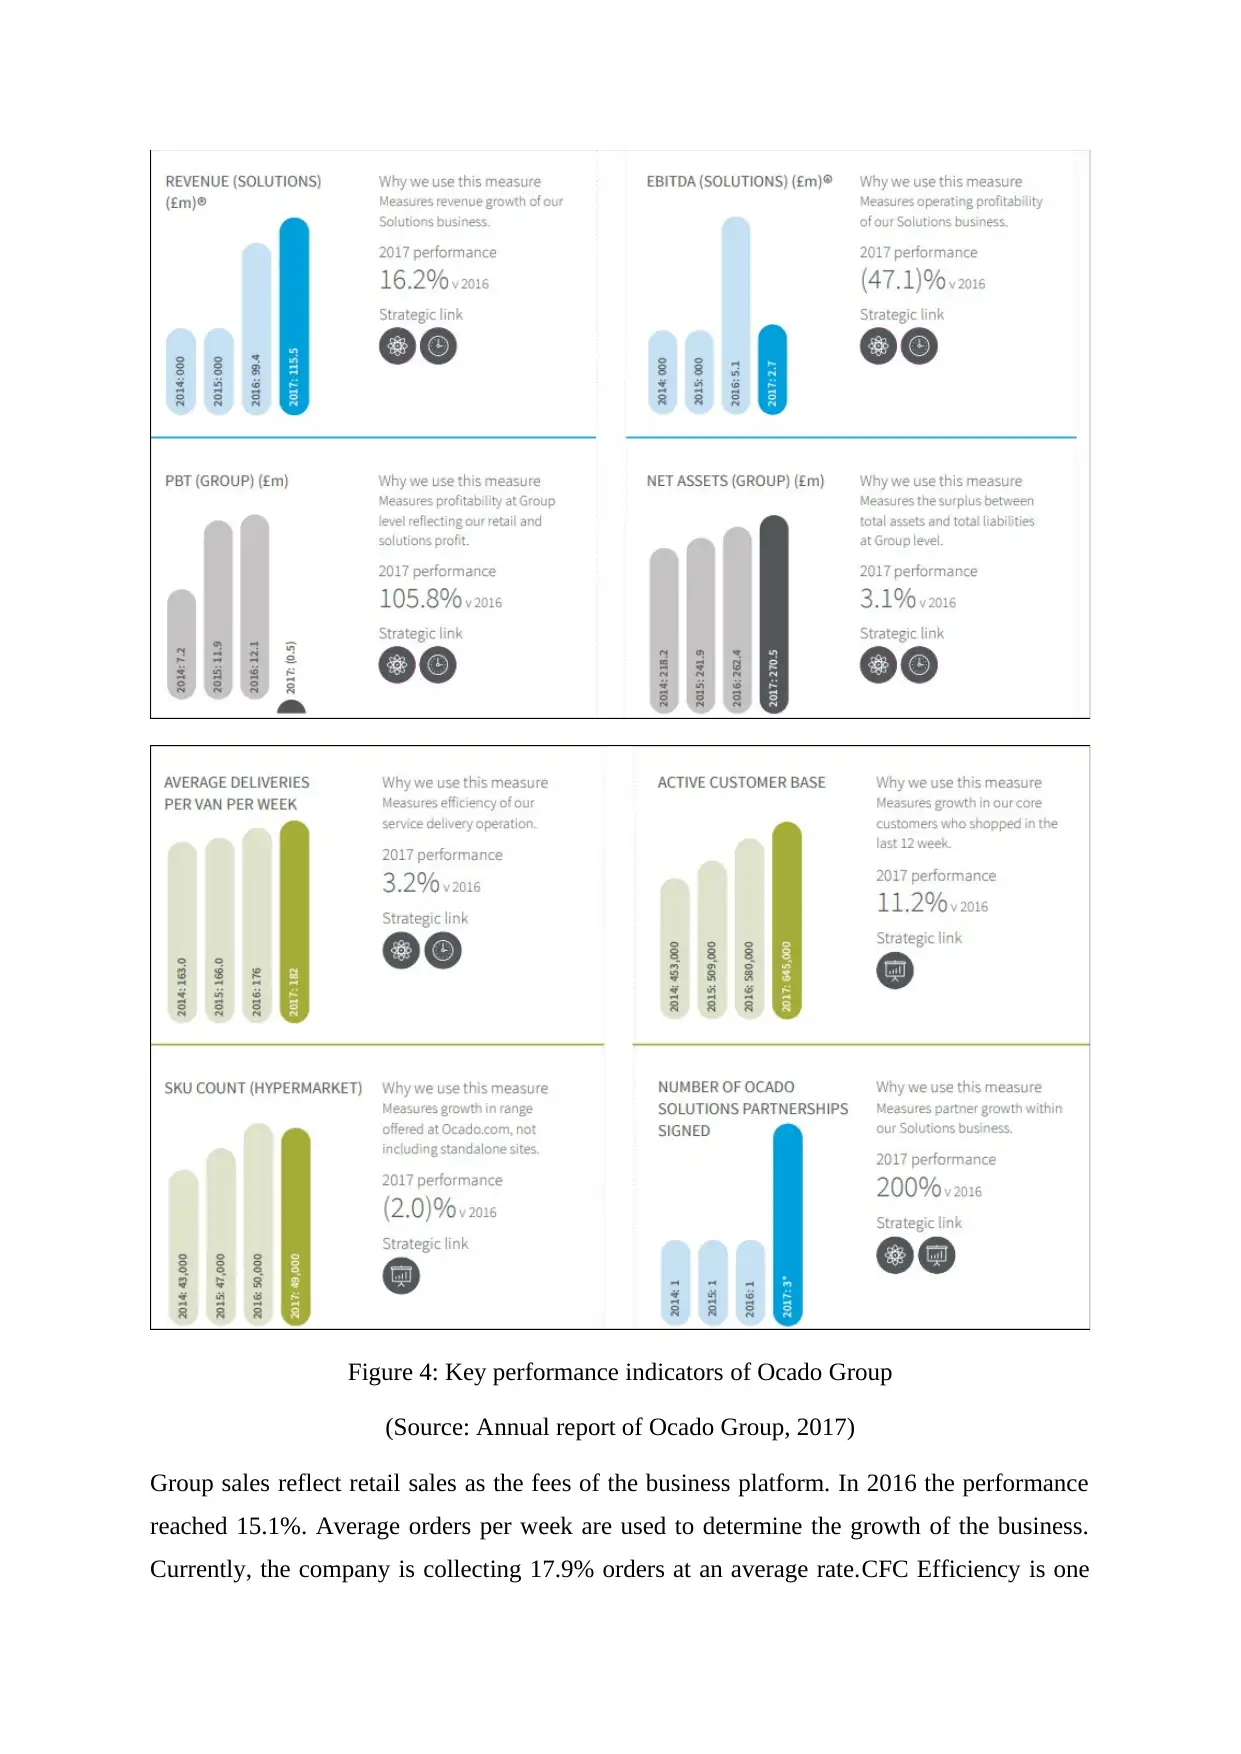
Figure 4: Key performance indicators of Ocado Group
(Source: Annual report of Ocado Group, 2017)
Group sales reflect retail sales as the fees of the business platform. In 2016 the performance
reached 15.1%. Average orders per week are used to determine the growth of the business.
Currently, the company is collecting 17.9% orders at an average rate.CFC Efficiency is one
Paraphrase This Document
Need a fresh take? Get an instant paraphrase of this document with our AI Paraphraser
of the measures the operational efficiency of the management.EBITDA of 2016 of the Ocado
Group is 4.2% in the year 2017 and has robustly increased from the previous year which was
3.3%.Active customer base also measures the growth of the core customers who shopped in
the last 12 week (Zwetsloot, 2014). And the percent of the accuracy the company measures is
also one of the important content. On overall basis, KPI of the company has been improvised.
Non-financial ratios of Ocado Group
Non-financial ratios are those ratios which are not expressed in terms of the dollar. Non-
financial ratios of Ocado Group are enumerated as below:
Figure 5: Non-financial ratios of Ocado Group
(Source: Annual report of Ocado Group, 2017)
Product waste ratio
To consider environment sustainability company has stabilised their overall wastage
percentage.
Figure 6: Product waste ratio
(Source: Annual report of Ocado Group, 2017)
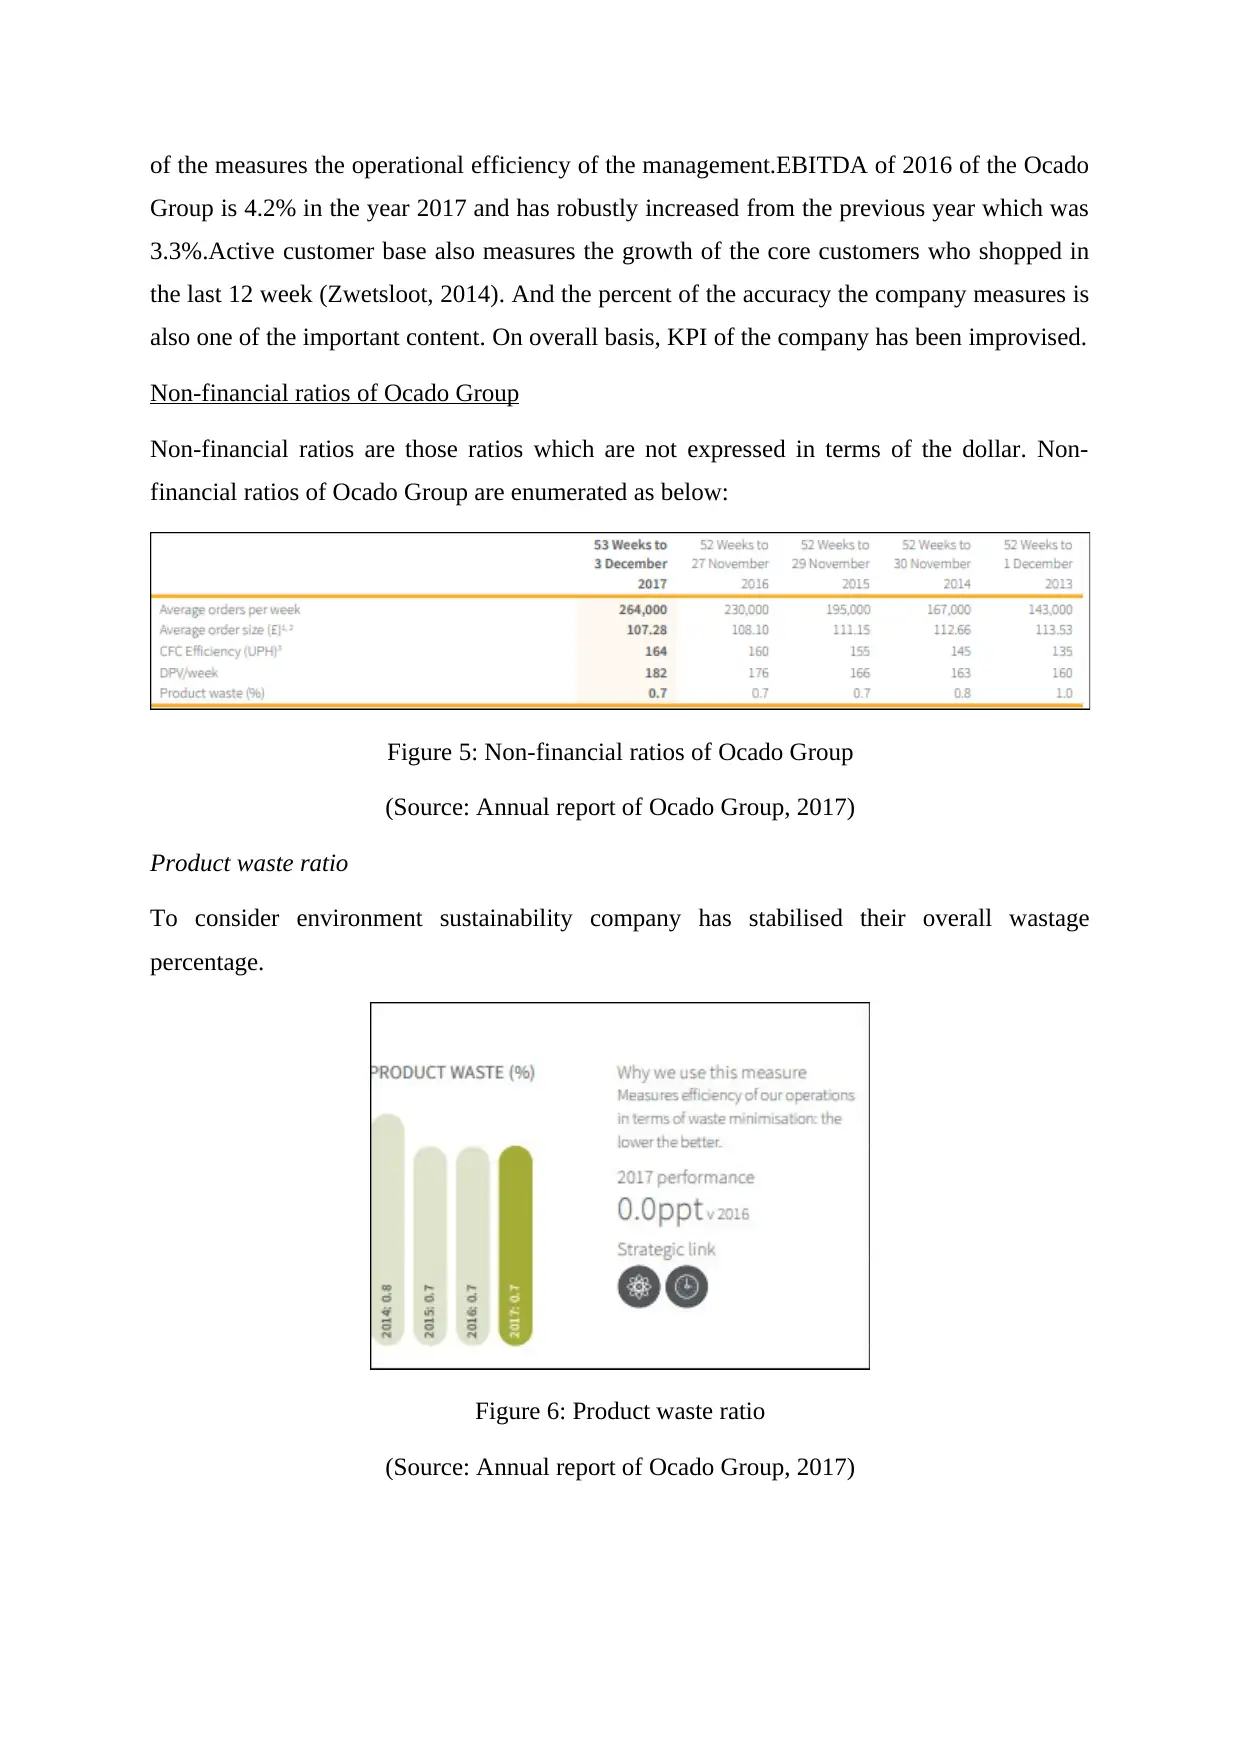
Active customer base
In present year, company had noticed robust growth in their active customer base as it
continued to inflate by 11.2% and 14.3% respectively. This is also supported by highest
number of orders delivered in a week which over and above 296,000 in the concerned period.
Figure 7: Active customer base ratio
(Source: Annual report of Ocado Group, 2017)
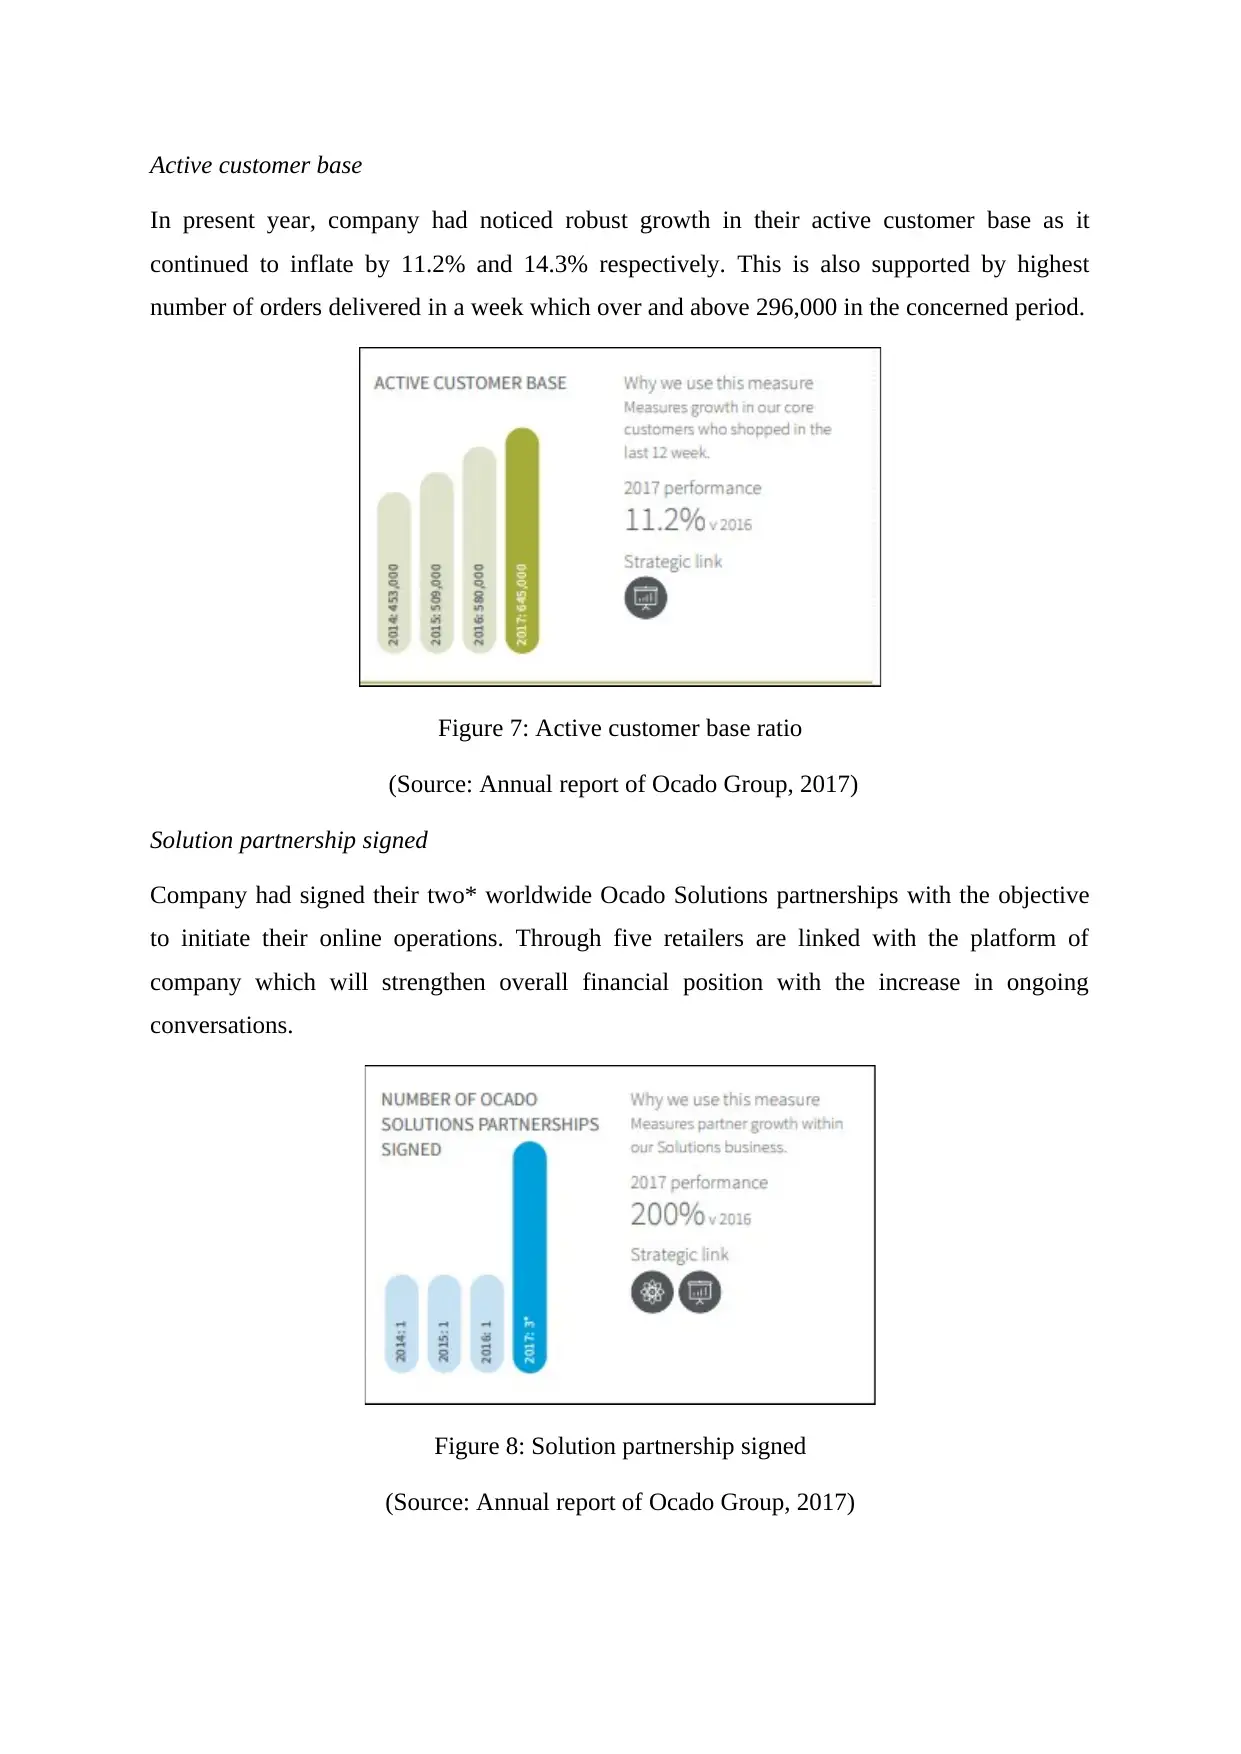
Solution partnership signed
Company had signed their two* worldwide Ocado Solutions partnerships with the objective
to initiate their online operations. Through five retailers are linked with the platform of
company which will strengthen overall financial position with the increase in ongoing
conversations.
Figure 8: Solution partnership signed
(Source: Annual report of Ocado Group, 2017)
In present year, company had noticed robust growth in their active customer base as it
continued to inflate by 11.2% and 14.3% respectively. This is also supported by highest
number of orders delivered in a week which over and above 296,000 in the concerned period.
Figure 7: Active customer base ratio
(Source: Annual report of Ocado Group, 2017)
Solution partnership signed
Company had signed their two* worldwide Ocado Solutions partnerships with the objective
to initiate their online operations. Through five retailers are linked with the platform of
company which will strengthen overall financial position with the increase in ongoing
conversations.
Figure 8: Solution partnership signed
(Source: Annual report of Ocado Group, 2017)
⊘ This is a preview!⊘
Do you want full access?
Subscribe today to unlock all pages.
Trusted by 1+ million students worldwide
1 out of 19
Related Documents


Your All-in-One AI-Powered Toolkit for Academic Success.
+13062052269
info@desklib.com
Available 24*7 on WhatsApp / Email
![[object Object]](/_next/static/media/star-bottom.7253800d.svg)
Unlock your academic potential
Copyright © 2020–2026 A2Z Services. All Rights Reserved. Developed and managed by ZUCOL.