Determination of Consolidation Properties: Oedometer Test Analysis

Verified

Added on  2022/09/15

|7
|894
|38
Practical Assignment
AI Summary
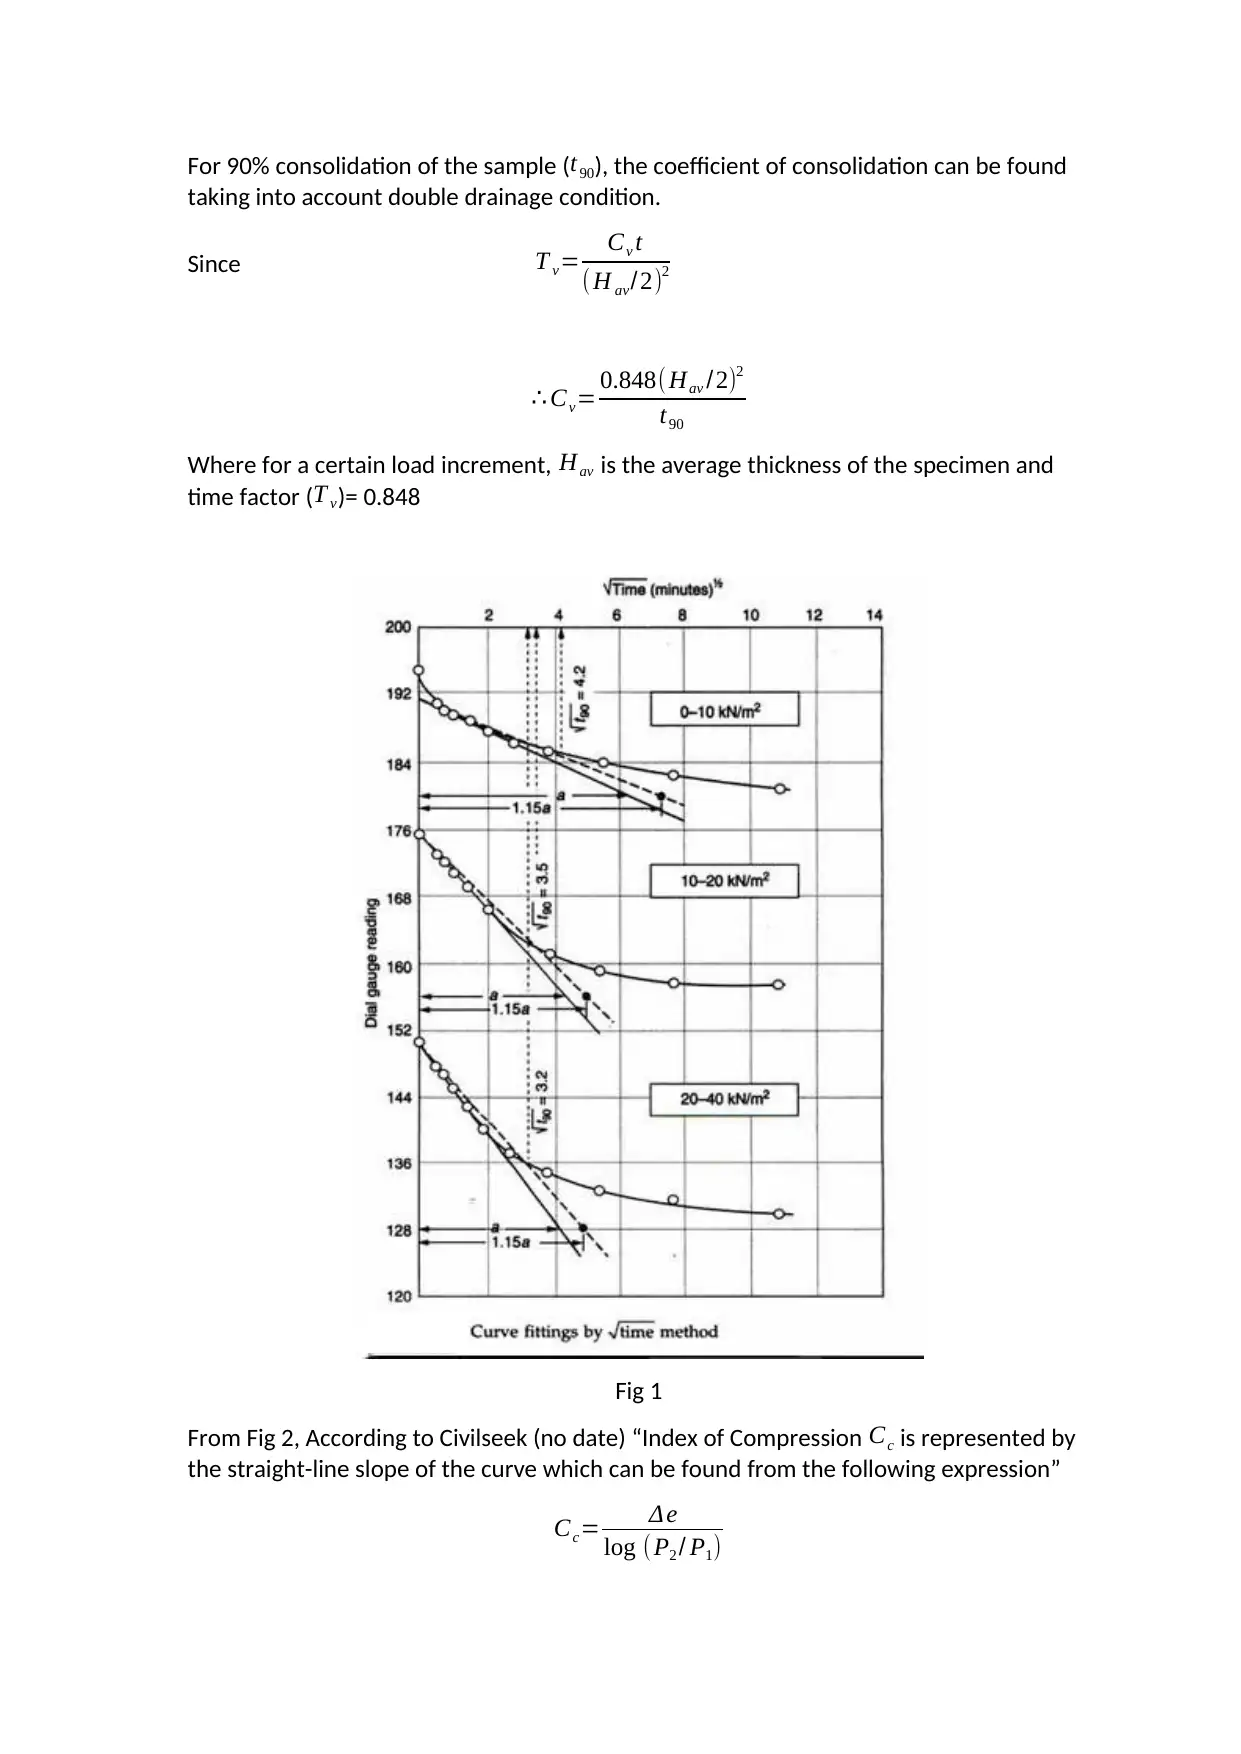
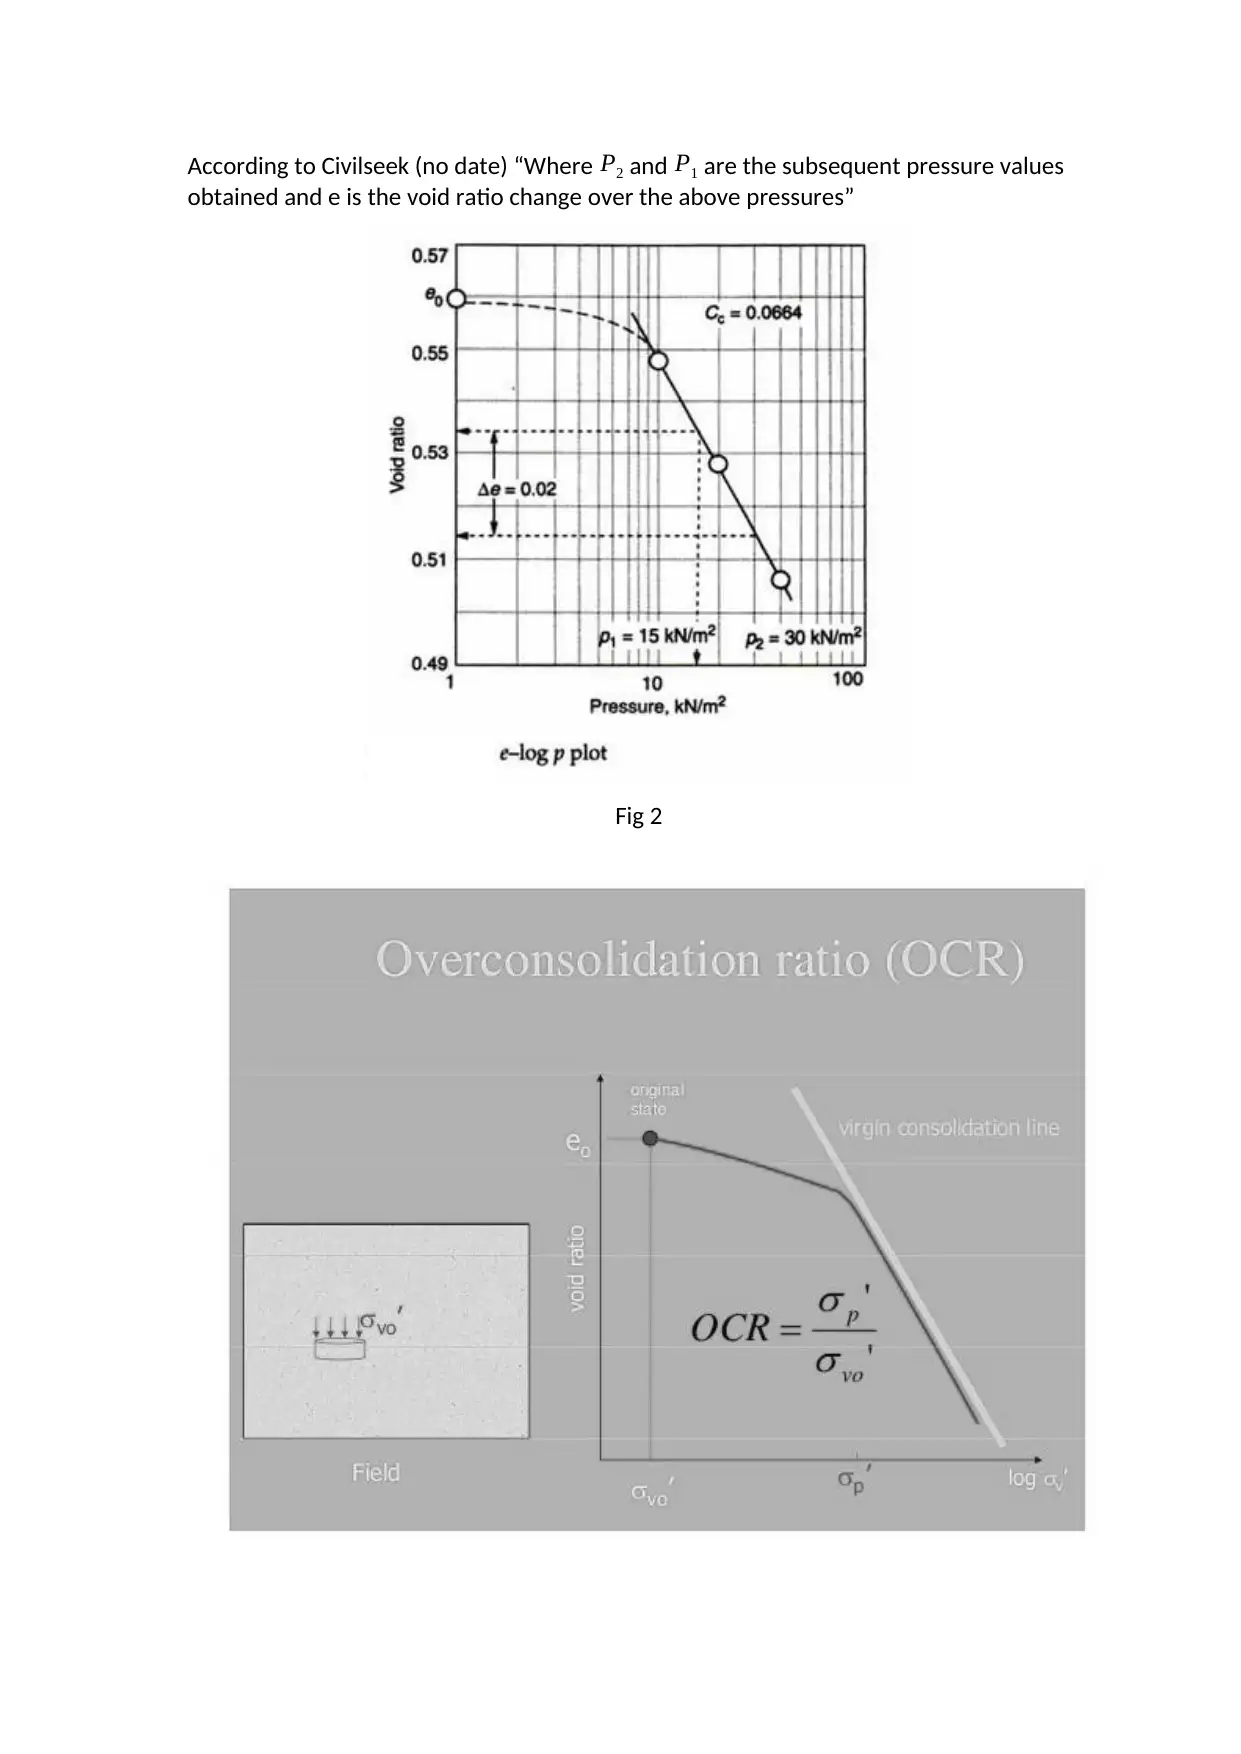
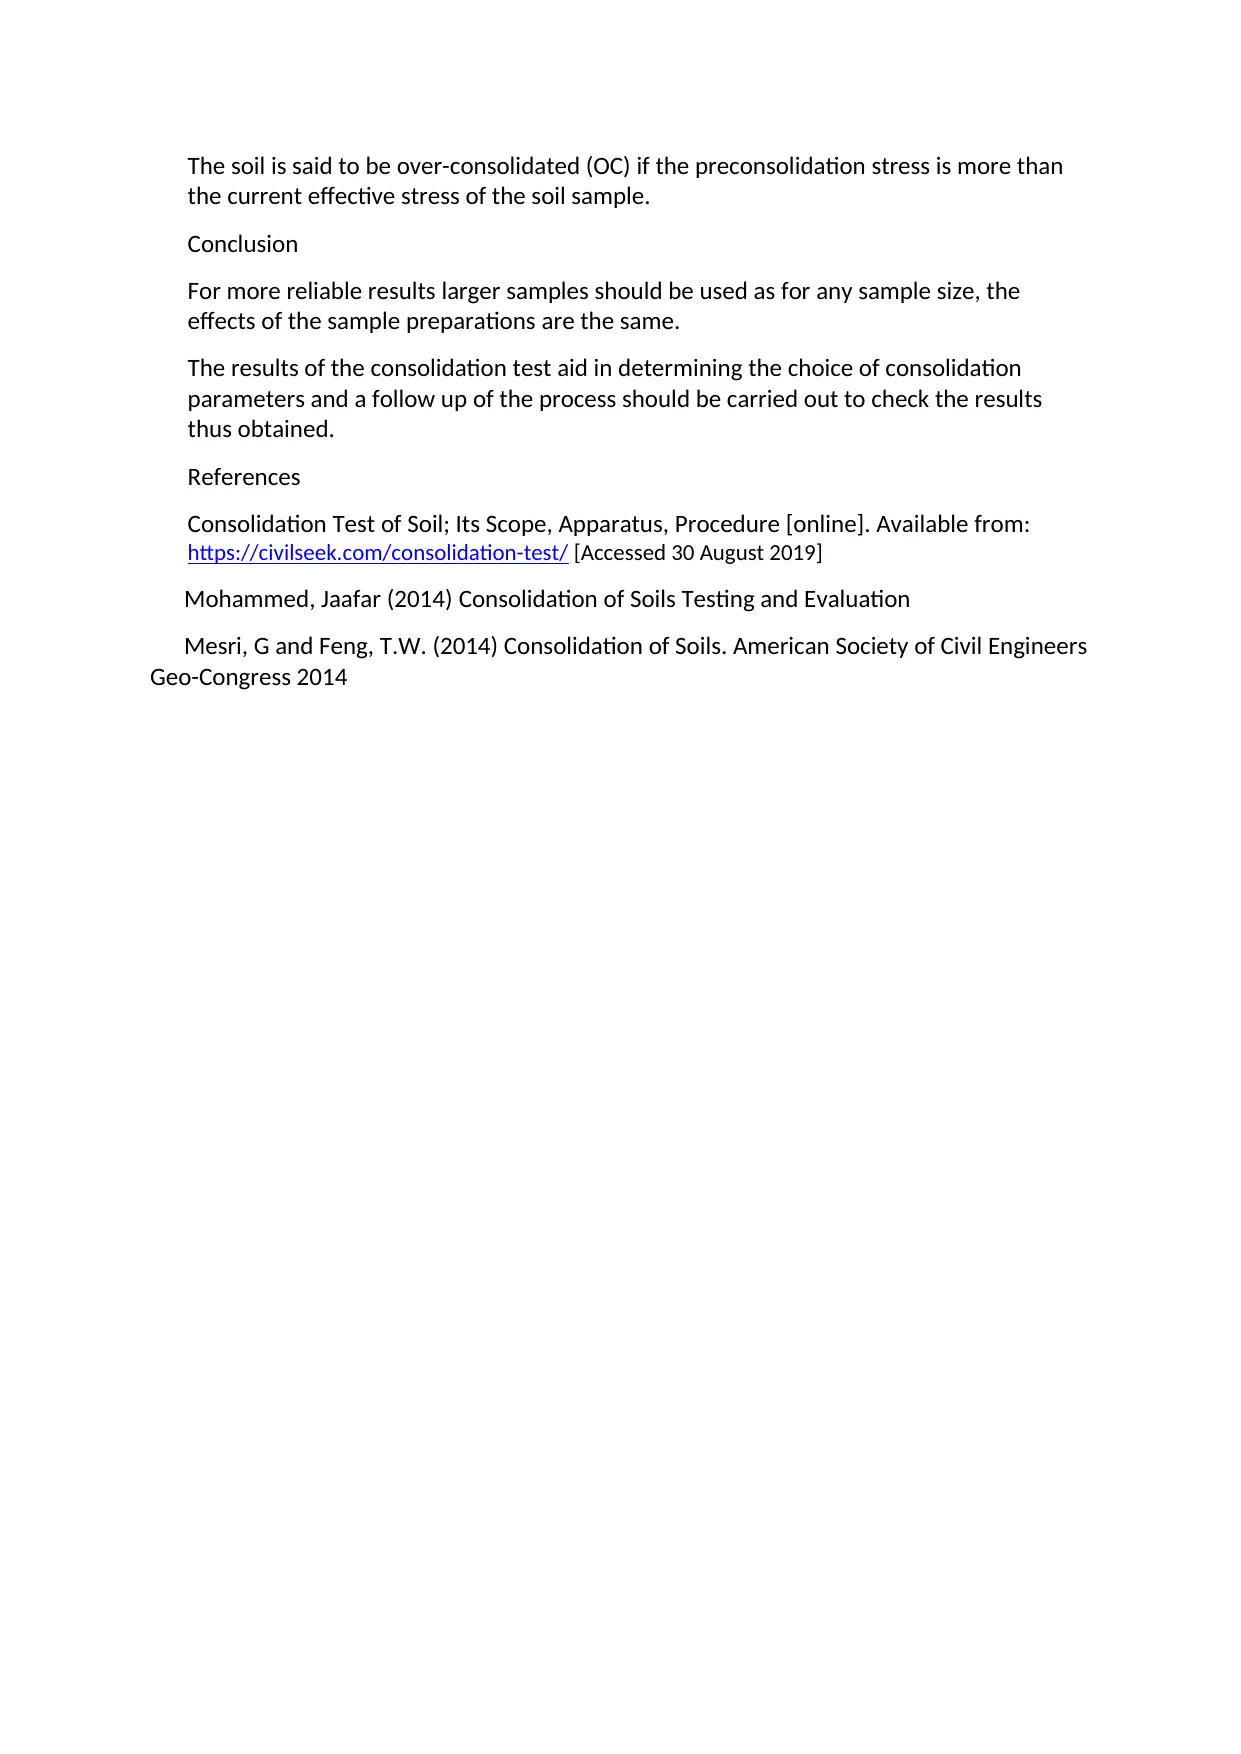
This assignment provides a detailed overview of the Oedometer test, a crucial geotechnical engineering investigation used to measure the consolidation properties of soil. The solution outlines the apparatus used, including the consolidation apparatus, displacement transducer, and loading device. It describes the specimen preparation, the test procedure involving incremental loading and measurement of sample deformation, and the calculations involved, such as determining initial and final moisture content, bulk density, dry density, void ratio, and coefficients of volume compressibility and consolidation. The results section presents data on pressure, volume compressibility, and consolidation coefficients. The discussion interprets the curves representing consolidation test results and provides insights into the compression index. The assignment concludes by emphasizing the importance of larger samples for reliable results and the need for follow-up checks on the obtained consolidation parameters. References to relevant sources like Civilseek and Mesri and Feng (2014) are also included.
Document Page
Determination of Consolidation Properties of soil (Oedometer Test)
In geotechnical engineering, an oedometer test is an investigation carried out to measure
consolidation properties of soil. The deformation response is measured on a sample of soil
under different loads. Experimental results are used in predicting the deforming response of
soil with respect to the effective stress.
Mesri and Feng (2014) argue the compressive characteristics of soil are found by the
consolidation analysis (Oedometer test) of soil and are essential in the construction of any
structure being built on a compressible soil.
Apparatus
Consolidation apparatus
Consolidation cell
Displacement transducer
Loading device
Porous disc
Procedure
Specimen preparation
The test specimen was cut from an undisturbed soil sample with a ring diameter 75.00 mm
and ring height 19.00 mm. The surfaces of the sample (top and bottom) were trimmed using
a palette knife until they flushed and levelled with the surfaces of the ring i.e. both the top
and bottom.
Test procedure
1. The specific gravity of the soil particles, the weight of the cutting ring with and
without the sample and the initial moisture content of the sample were recorded.
2. The first porous disc was placed in the consolidation cell dry. The ring with the
specimen on top of the porous disc was placed with filter paper against each face of
the sample. The top porous disc was placed, and then the loading cap into the cell.
The assembled consolidation cell was placed in position on the oedometer press. The
oedometer was adjusted to bring the load transmitting beam into contact with the
loading cap. The displacement transducers were positioned to monitor any vertical
movement.
3. Within 3 minutes of pressure being applied to the soil sample, the cell was filled with
water so that the sample was submerged.
4. The loading apparatus was set up and the vertical load to the sample was applied. A
load was then applied and the change in the sample thickness was measured using
the displacement transducer.
tabler-icon-diamond-filled.svg

Secure Best Marks with AI Grader

Need help grading? Try our AI Grader for instant feedback on your assignments.
Document Page
5. The load was increased in increments, each increment being held constant for 1 day,
and each applied stress being double that of the preceding stage.
6. The load was removed and swelling allowed for 24 hours. After the final decrement,
the final height and weight of the sample were measured after removing the load
and the hanger.
7. The final moisture content was then determined”
Results
Initial Final
Moisture Content 16% Moisture Content 16%
Bulk Density 2.04 Mg/m3 Bulk Density 2.39 Mg/m3
Dry Density 1.76 Mg/ m3 Dry Density 2.06 Mg/ m3
Void Ratio 0.508 Void Ratio 0.2870
Degree of Saturation 83.5% Degree of Saturation 147.77%
Pressure (Loading Stages)
(kPa)
Volume Compressibility
Coefficient (mv)(m2/MN)
Consolidation Coefficient
(Cv)(m2/yr)
0
50 0.79 5.24
100 1.00 5.48
200 0.19 1.68
400 0.12 5.11
50 -0.07
Calculations
Initial bulk density:
ρ=m0 ×1000
A × H0
= 171.12× 1000
4414.9 ×19.0 =2.04 Mg
m3
Document Page
Initial dry density:
ρd =( 100
100+W ) ρ= ( 100
100+16 )2.04=1.76 Mg
m3
Initial voids ratio:
e0= Gs
ρd
1= 2.65
1.76 1=0.506
Equivalent height of the solid particles:
Hs = H0
1e0
= 19.0
10.506 =38.46 mm
Coefficient volume compressibility:
M v= ( H1H2
H1 ) ( 1000
p2 p1 )= ( 1912.6
19 )( 1000
40050 )=0.96 m2
MN
Final Void Ratio:
ef =wf ×Gs=0.424
Discussion
According to Civilseek (no date) “The type of curves representing consolidation test results
is e versus log stress, e versus log t, e versus square root t, av versus log pressure, cv versus
log pressure curves”
Tables 1, 2 and 3 represent some typical results obtained from a consolidation test and
figures 1 and 2 represent the corresponding plots.
The Coefficient volume compressibility M v was found to be 0.96 m2 / MN and the final void
ratio of 0.424 and the consolidation coefficient is also adequate.
Document Page
Table 1
Table 2
Table 3
tabler-icon-diamond-filled.svg

Secure Best Marks with AI Grader

Need help grading? Try our AI Grader for instant feedback on your assignments.
Document Page
For 90% consolidation of the sample ( t90), the coefficient of consolidation can be found
taking into account double drainage condition.
Since T v= Cv t
(H av/2)2
Cv= 0.848( Hav /2)2
t90
Where for a certain load increment, Hav is the average thickness of the specimen and
time factor (T v)= 0.848
Fig 1
From Fig 2, According to Civilseek (no date) “Index of Compression Cc is represented by
the straight-line slope of the curve which can be found from the following expression”
Cc= Δe
log (P2 / P1)
Document Page
According to Civilseek (no date) “Where P2 and P1 are the subsequent pressure values
obtained and e is the void ratio change over the above pressures”
Fig 2
Document Page
The soil is said to be over-consolidated (OC) if the preconsolidation stress is more than
the current effective stress of the soil sample.
Conclusion
For more reliable results larger samples should be used as for any sample size, the
effects of the sample preparations are the same.
The results of the consolidation test aid in determining the choice of consolidation
parameters and a follow up of the process should be carried out to check the results
thus obtained.
References
Consolidation Test of Soil; Its Scope, Apparatus, Procedure [online]. Available from:
https://civilseek.com/consolidation-test/ [Accessed 30 August 2019]
Mohammed, Jaafar (2014) Consolidation of Soils Testing and Evaluation
Mesri, G and Feng, T.W. (2014) Consolidation of Soils. American Society of Civil Engineers
Geo-Congress 2014
chevron_up_icon
1 out of 7
circle_padding
hide_on_mobile
zoom_out_icon
logo.png

Your All-in-One AI-Powered Toolkit for Academic Success.

Available 24*7 on WhatsApp / Email

[object Object]