Building Performance Modeling: Office Building Assessment Report

Verified

Added on  2022/08/17

|13
|1911
|11
Report
AI Summary
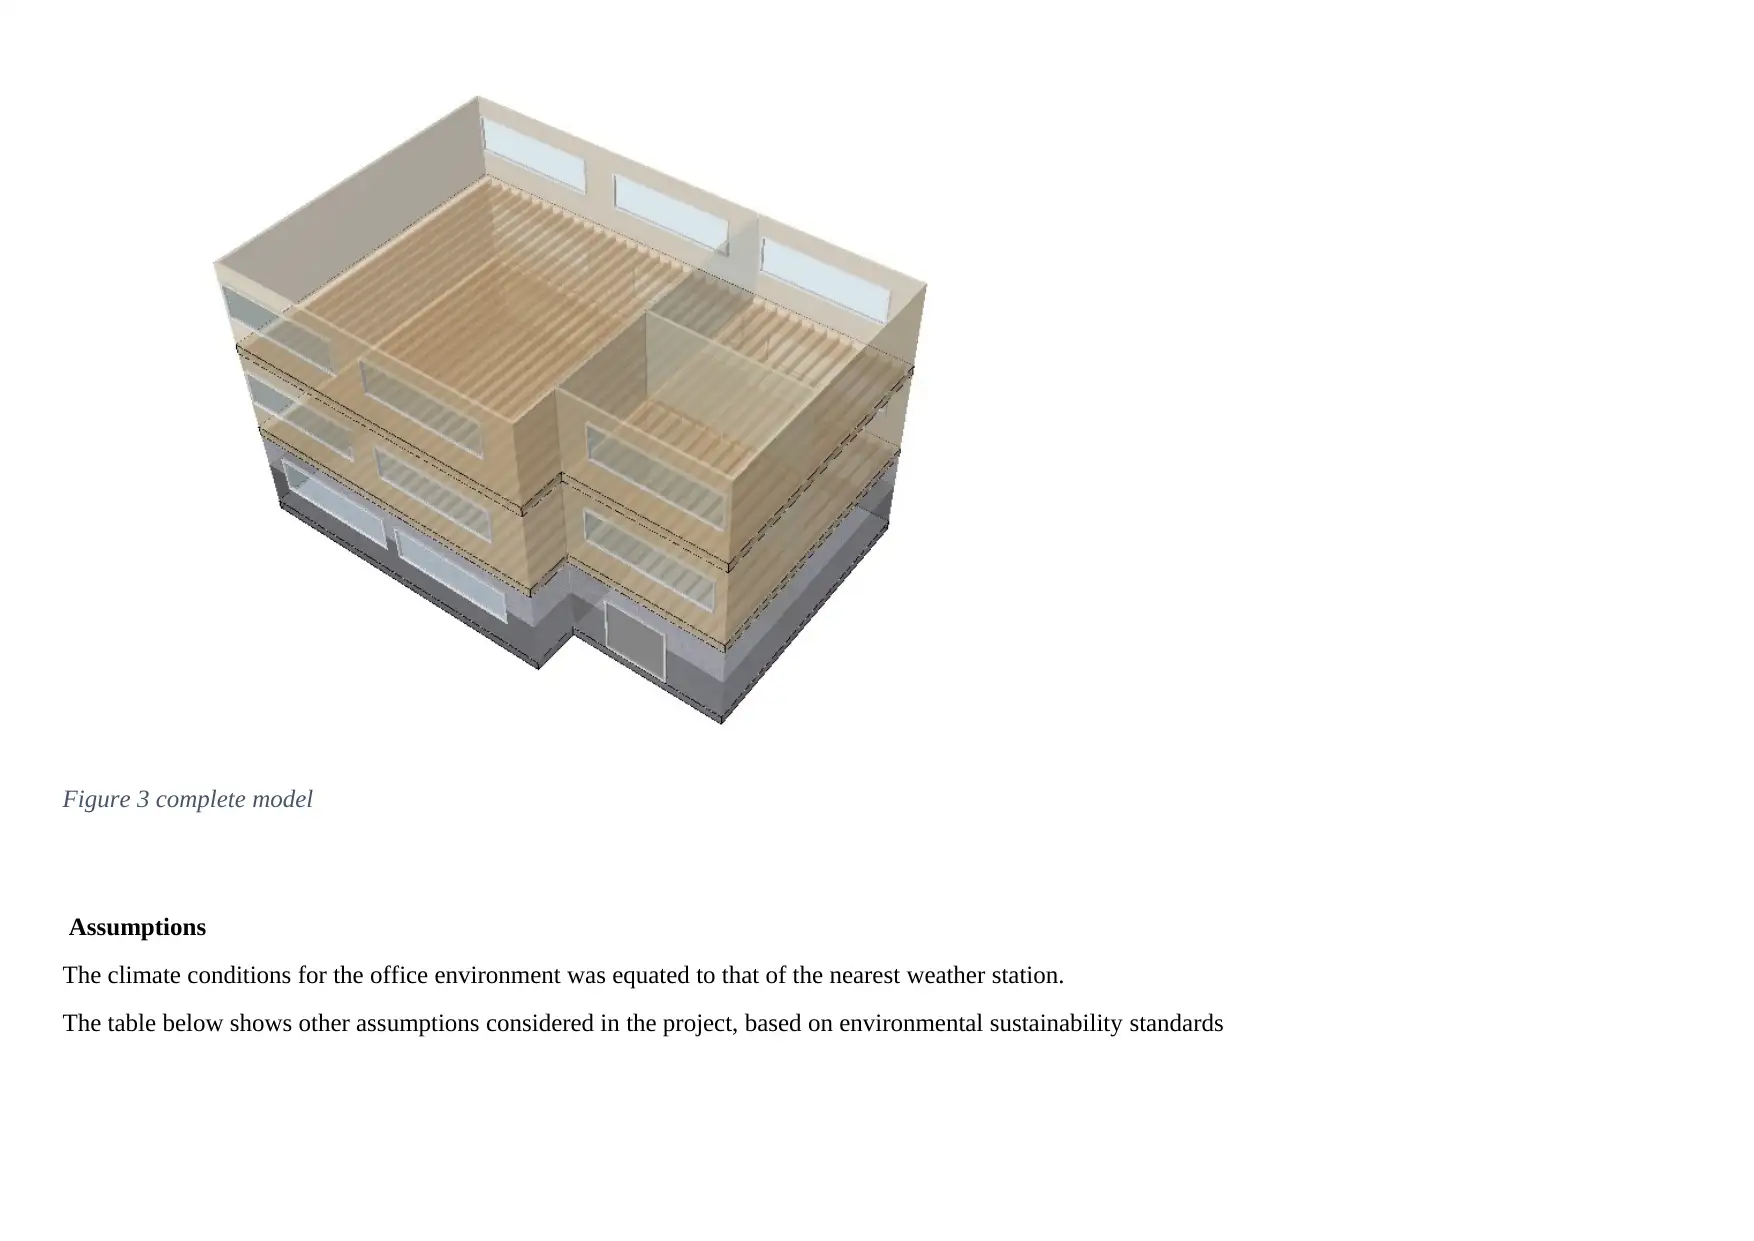
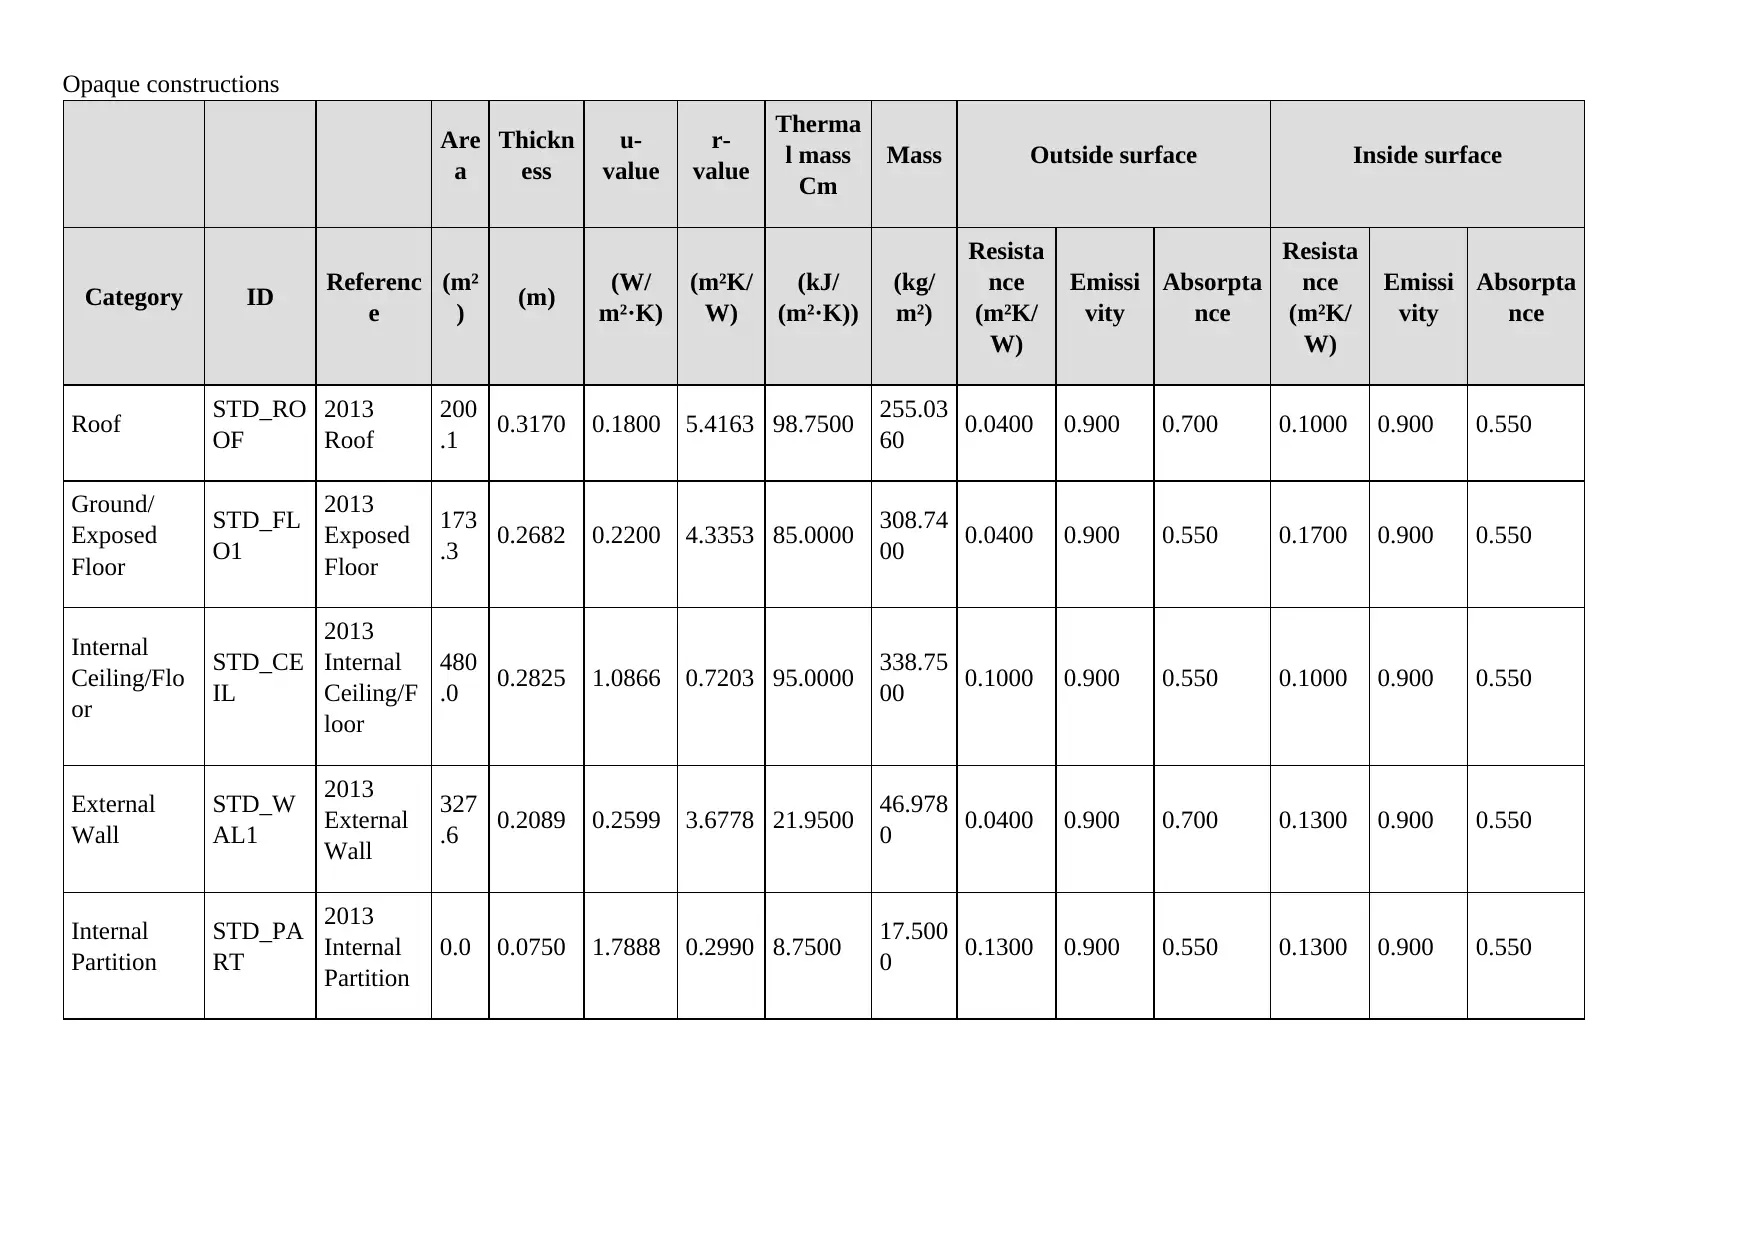
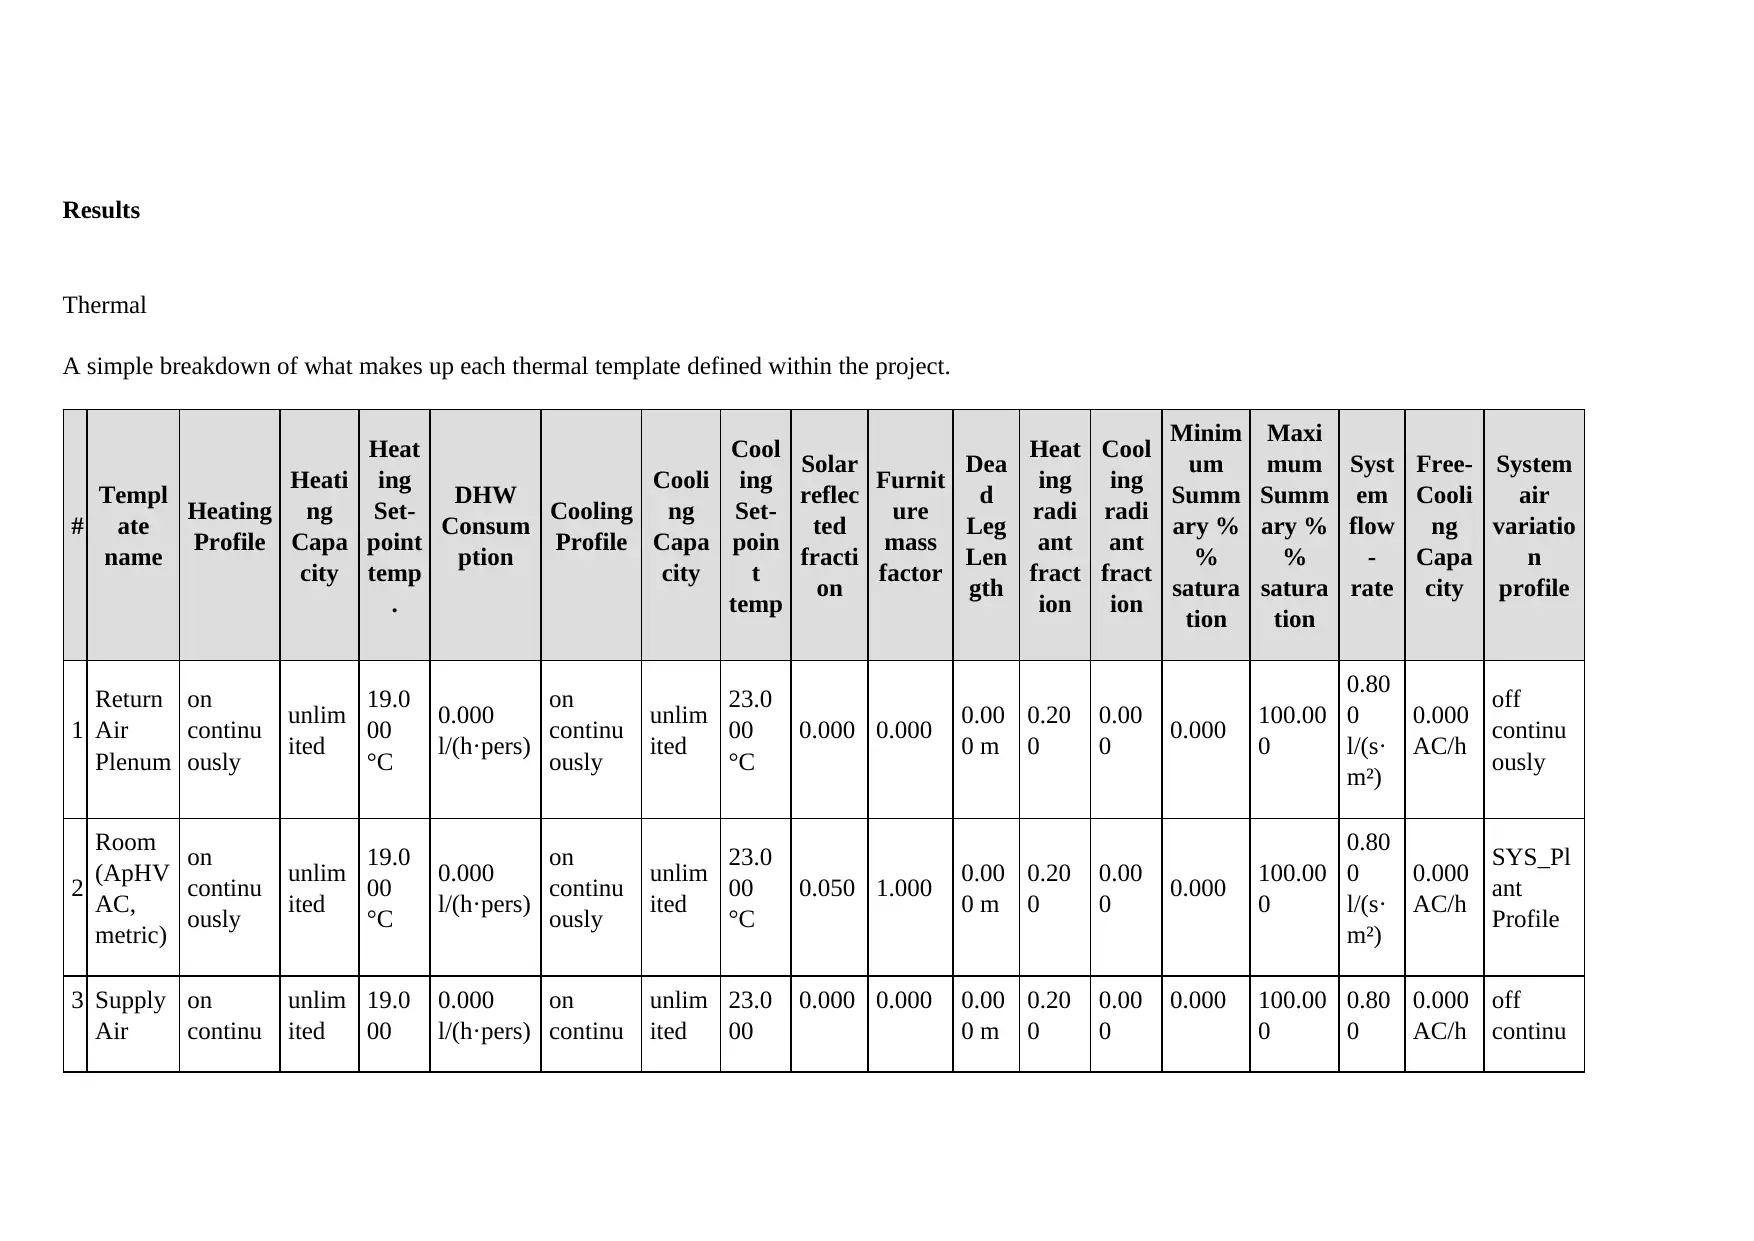
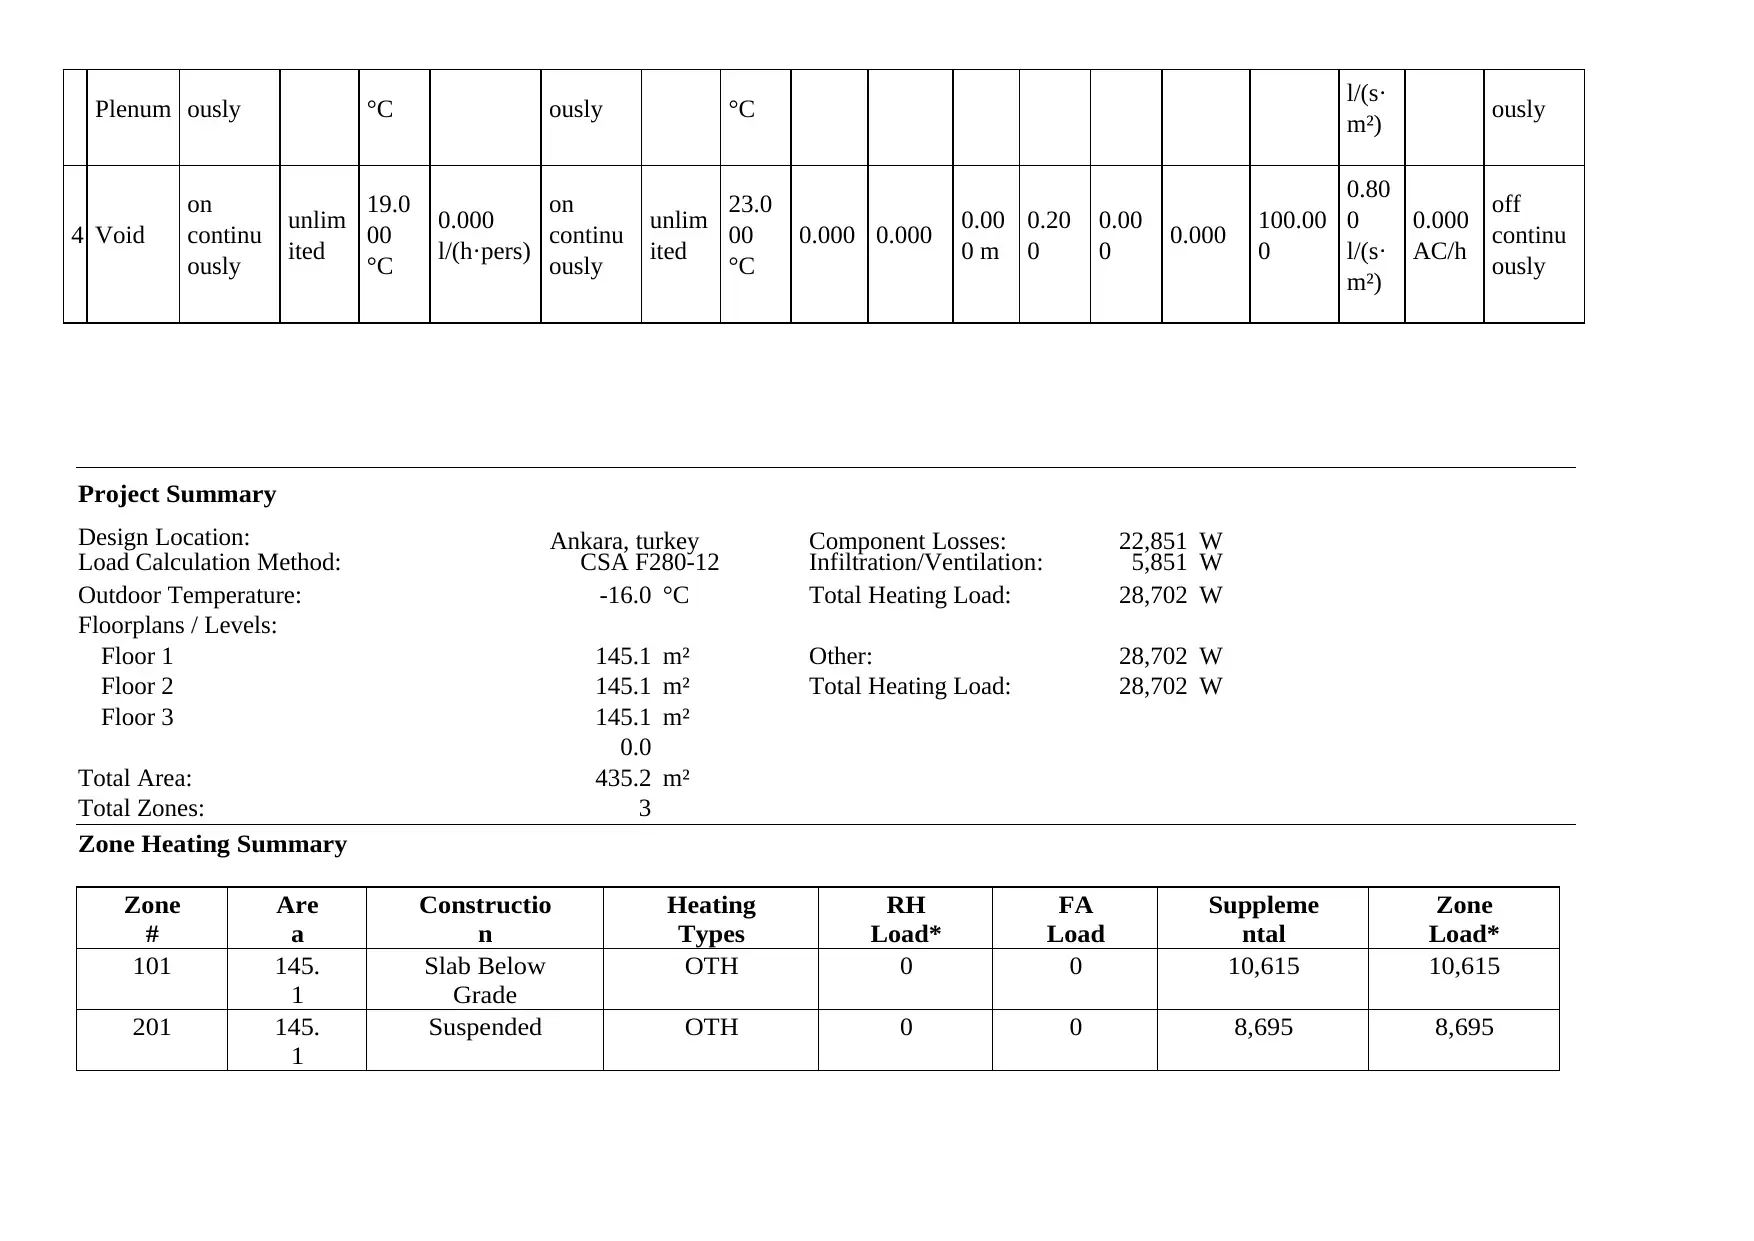
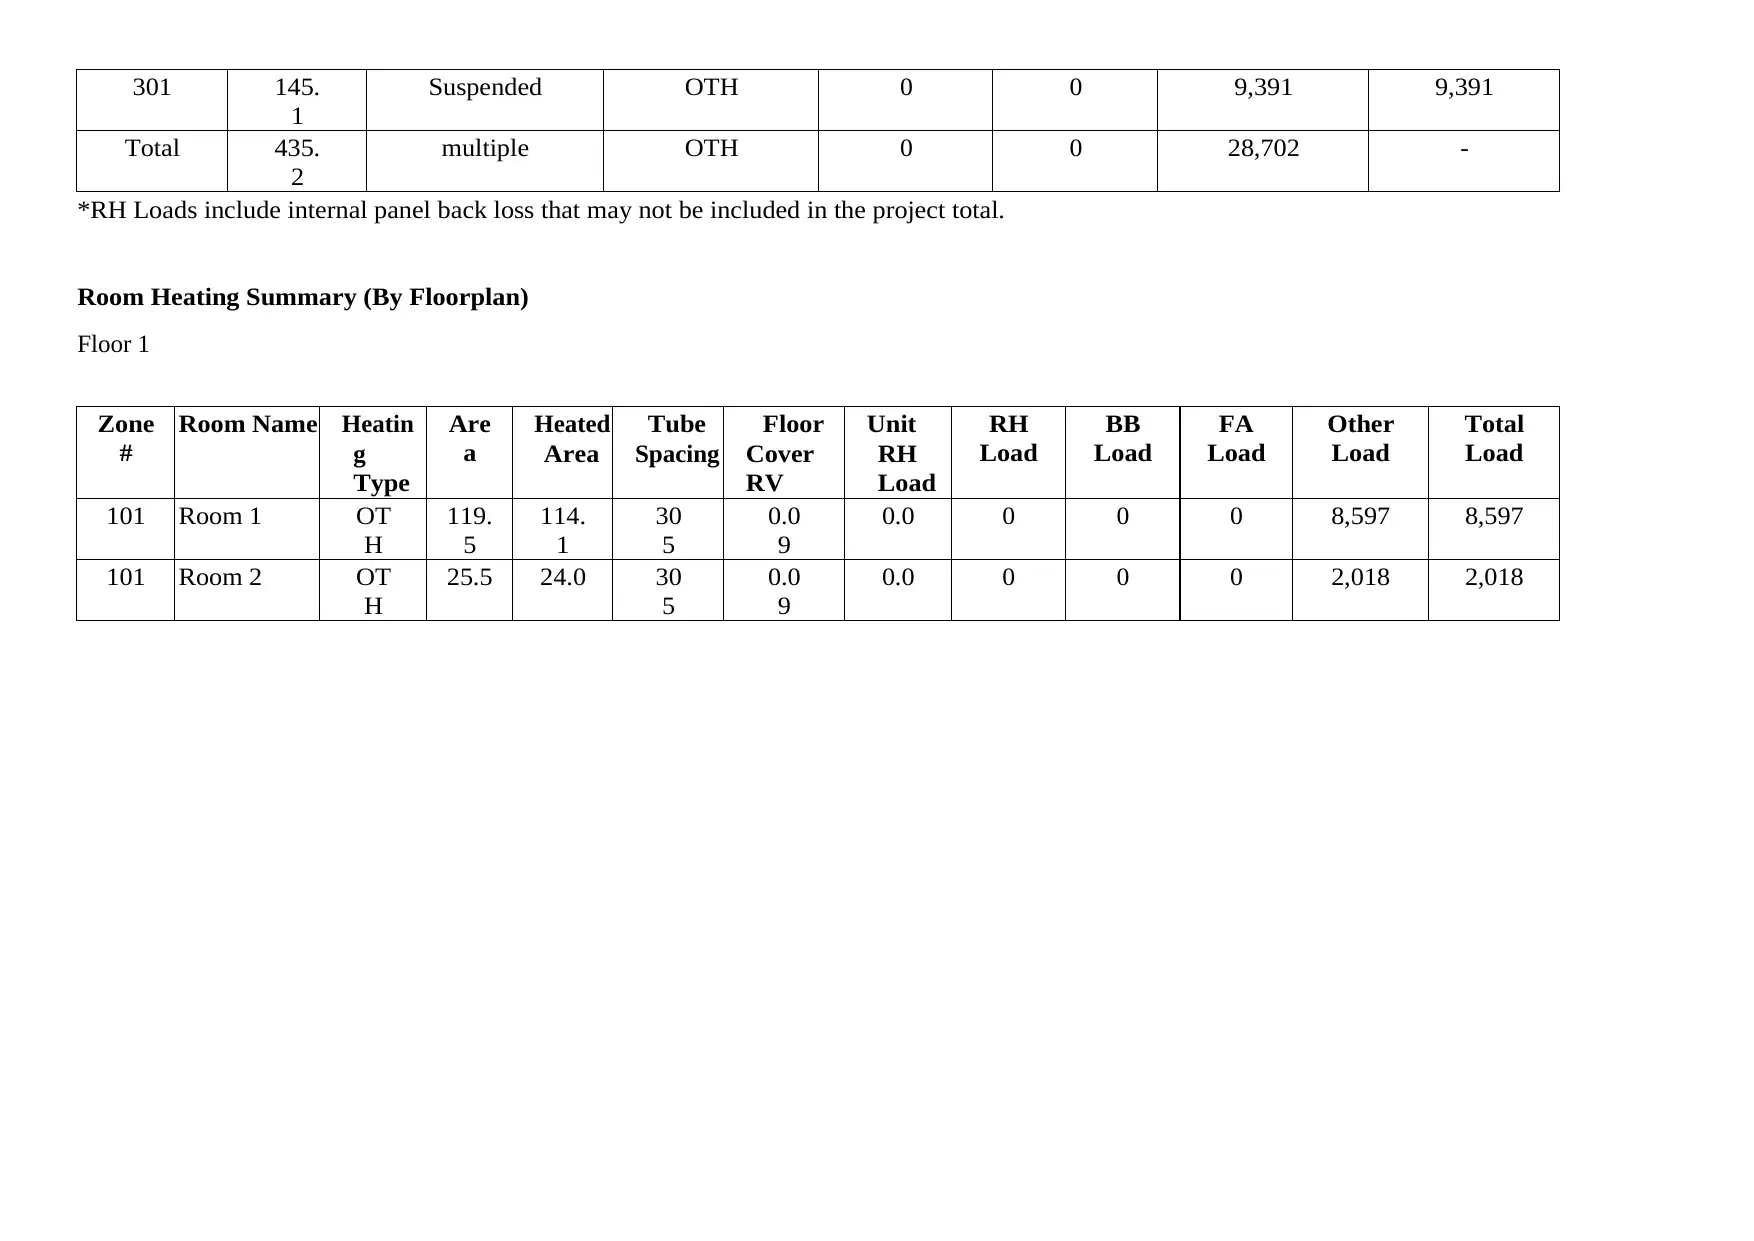
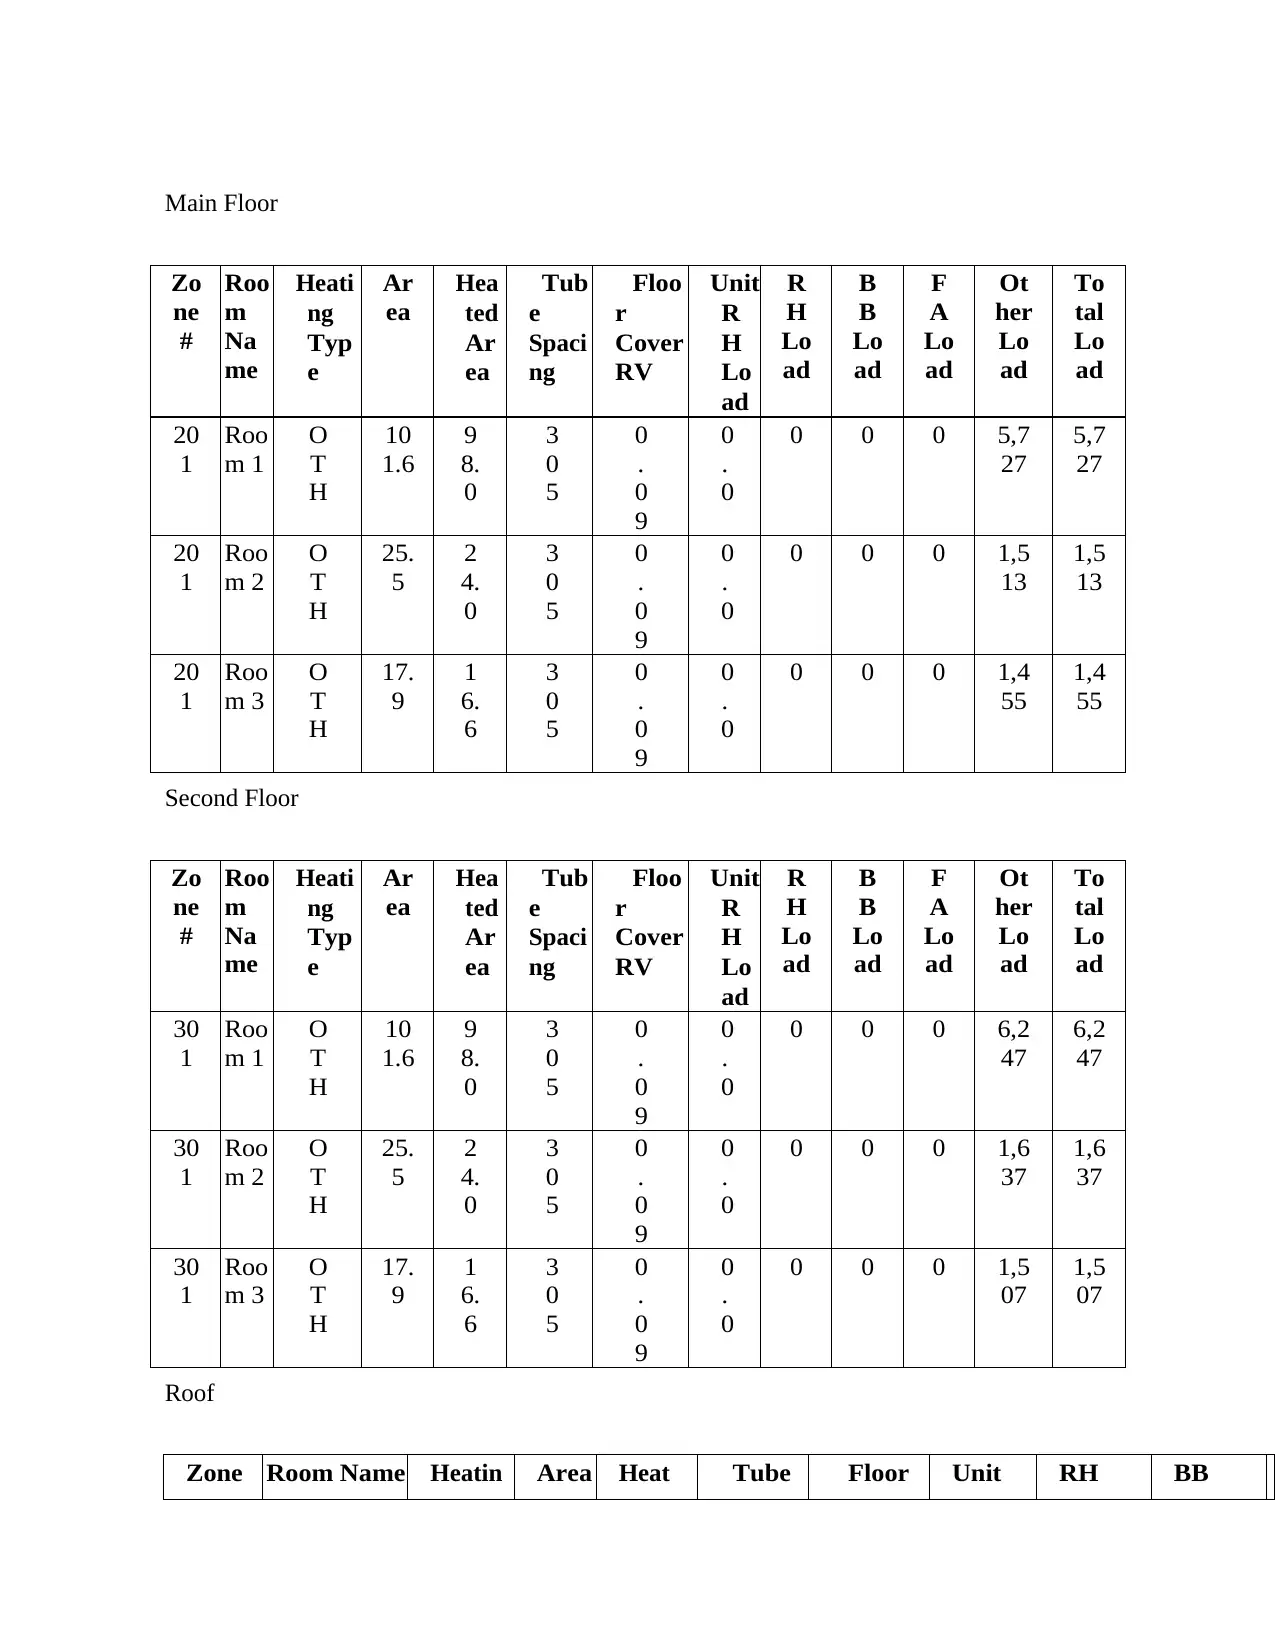
This report presents an assessment of an office building's thermal performance, focusing on the application of the IES model for simulation. The study establishes a baseline for the building, analyzing parameters like radiance, solar gain, air temperature, and humidity to evaluate energy efficiency and thermal comfort. The analysis includes detailed assumptions regarding construction materials and climate conditions, alongside a breakdown of thermal templates and zone heating summaries. The findings emphasize the impact of HVAC systems and the building envelope on indoor thermal conditions, offering insights into energy-saving measures and recommendations for improving building performance. The report also includes floor plans, software version details, and references to support the analysis, aiming to provide a comprehensive understanding of building performance modeling and simulation.
tabler-icon-diamond-filled.svg

Contribute Materials

Your contribution can guide someone’s learning journey. Share your documents today.
Document Page
Assessment of an office building
Author
The issue date
Confidentiality statement
tabler-icon-diamond-filled.svg

Secure Best Marks with AI Grader

Need help grading? Try our AI Grader for instant feedback on your assignments.
Document Page
Executive summary
In the construction architecture, the achievement of a warm condition has become significant concern. Furthermore, thermal conditions are critical for
optimization in the case of existing buildings. To this end, the program IES modelit is chosen as a model for thermal state simulation. The purpose of
this paper is to describe the measures taken before the thermal analysis is carried out. Accordingly, parameters of simulation such as radiance, solar
gain, air temperature, humidity and relative humidity were established. Computing and simulation modeling offer an overview of how internal and
external design systems can impact building performance. The models offer a condensed description of our ecosystems. This include activities or
characteristics used to guide design through performance. To evaluate the effects of electricity, regular illumination, condensation and thermal comfort,
the uses different building efficiency analysis methods to assess whether project goals can better be achieved. The efficiency improvement programs
include both construction and maintenance structures. Environmental analysis modeling methods are a huge help used by housing developers to reduce
energy savings in buildings. The program for energy simulations allows the precision of the assessment of such factors to help planners decide on the
right steps to apply to any new or existing building. The market includes a range of electronic energy modeling tools. The aim of the present analysis is
to define and compares some of the most important variables due to their ability to measure and distinguish a large number of variables.
Introduction
House simulation is intended as a modeling method that applies to different indoor as well as outdoor scenarios. While researchers have a particular
purpose and focus performance parameter. Its performance will lead to a detailed creation and optimization of the thermal characteristics of the
buildings on the basis of data extraction, respectively. The aim of thermal analysis on the current building is to establish a baseline. On the opposite, the
goal is to make an early prediction based on many phenomena if it is performed during the design stage.
BIM is a mechanism assisted by specific tools, technology, and contracts, which include digital representation generation and maintenance of the
physical and functional features of the sites. Building Information Models (BIMs) are files that can be collected, shared or networked in support of
decisions about a built-in asset (frequently but not all of them in proprietary formats and containing proprietary data). Today BIM is used in numerous
physical infrastructural areas, including water, sewage, power, coal, phones, highways, highways, railway lines and bridges. BIM Software offers
information and connectivity solutions.
Computing and simulation modeling offer an overview of how internal and external design systems can impact building performance. To evaluate the
effects of electricity, regular illumination, condensation and thermal comfort, Walter P Moore uses different building efficiency analysis methods to
assess whether project goals can better be achieved. The efficiency improvement programs include both construction and maintenance structures.
Several daylight metrics were then calculated, such as Work Plane Illuminance (WPI) and Daylight Factor (DF). WPI will be calculated in various
locations in each space simultaneously in order to achieve average working plane illumination and daylight factor. The geometrical properties of the
Document Page
space are related to a minimal number of locations. The following equation can be used to determine the space index and a minimal number of
locations may be obtained for daylight calculation from the table below.
Room index=(width ×lengths)/ ¿
Figure 1 house plan
Document Page
Figure 2 3d view of the first floor
tabler-icon-diamond-filled.svg

Secure Best Marks with AI Grader

Need help grading? Try our AI Grader for instant feedback on your assignments.
Document Page
Figure 3 complete model
Assumptions
The climate conditions for the office environment was equated to that of the nearest weather station.
The table below shows other assumptions considered in the project, based on environmental sustainability standards
Document Page
Opaque constructions
Are
a
Thickn
ess
u-
value
r-
value
Therma
l mass
Cm
Mass Outside surface Inside surface
Category ID Referenc
e
(m²
) (m) (W/
m²·K)
(m²K/
W)
(kJ/
(m²·K))
(kg/
m²)
Resista
nce
(m²K/
W)
Emissi
vity
Absorpta
nce
Resista
nce
(m²K/
W)
Emissi
vity
Absorpta
nce
Roof STD_RO
OF
2013
Roof
200
.1 0.3170 0.1800 5.4163 98.7500 255.03
60 0.0400 0.900 0.700 0.1000 0.900 0.550
Ground/
Exposed
Floor
STD_FL
O1
2013
Exposed
Floor
173
.3 0.2682 0.2200 4.3353 85.0000 308.74
00 0.0400 0.900 0.550 0.1700 0.900 0.550
Internal
Ceiling/Flo
or
STD_CE
IL
2013
Internal
Ceiling/F
loor
480
.0 0.2825 1.0866 0.7203 95.0000 338.75
00 0.1000 0.900 0.550 0.1000 0.900 0.550
External
Wall
STD_W
AL1
2013
External
Wall
327
.6 0.2089 0.2599 3.6778 21.9500 46.978
0 0.0400 0.900 0.700 0.1300 0.900 0.550
Internal
Partition
STD_PA
RT
2013
Internal
Partition
0.0 0.0750 1.7888 0.2990 8.7500 17.500
0 0.1300 0.900 0.550 0.1300 0.900 0.550
Document Page
Results
Thermal
A simple breakdown of what makes up each thermal template defined within the project.
#
Templ
ate
name
Heating
Profile
Heati
ng
Capa
city
Heat
ing
Set-
point
temp
.
DHW
Consum
ption
Cooling
Profile
Cooli
ng
Capa
city
Cool
ing
Set-
poin
t
temp
Solar
reflec
ted
fracti
on
Furnit
ure
mass
factor
Dea
d
Leg
Len
gth
Heat
ing
radi
ant
fract
ion
Cool
ing
radi
ant
fract
ion
Minim
um
Summ
ary %
%
satura
tion
Maxi
mum
Summ
ary %
%
satura
tion
Syst
em
flow
-
rate
Free-
Cooli
ng
Capa
city
System
air
variatio
n
profile
1
Return
Air
Plenum
on
continu
ously
unlim
ited
19.0
00
°C
0.000
l/(h·pers)
on
continu
ously
unlim
ited
23.0
00
°C
0.000 0.000 0.00
0 m
0.20
0
0.00
0 0.000 100.00
0
0.80
0
l/(s·
m²)
0.000
AC/h
off
continu
ously
2
Room
(ApHV
AC,
metric)
on
continu
ously
unlim
ited
19.0
00
°C
0.000
l/(h·pers)
on
continu
ously
unlim
ited
23.0
00
°C
0.050 1.000 0.00
0 m
0.20
0
0.00
0 0.000 100.00
0
0.80
0
l/(s·
m²)
0.000
AC/h
SYS_Pl
ant
Profile
3 Supply
Air
on
continu
unlim
ited
19.0
00
0.000
l/(h·pers)
on
continu
unlim
ited
23.0
00
0.000 0.000 0.00
0 m
0.20
0
0.00
0
0.000 100.00
0
0.80
0
0.000
AC/h
off
continu
tabler-icon-diamond-filled.svg

Paraphrase This Document

Need a fresh take? Get an instant paraphrase of this document with our AI Paraphraser
Document Page
Plenum ously °C ously °C l/(s·
m²) ously
4 Void
on
continu
ously
unlim
ited
19.0
00
°C
0.000
l/(h·pers)
on
continu
ously
unlim
ited
23.0
00
°C
0.000 0.000 0.00
0 m
0.20
0
0.00
0 0.000 100.00
0
0.80
0
l/(s·
m²)
0.000
AC/h
off
continu
ously
Project Summary
Design Location: Ankara, turkey Component Losses: 22,851 W
Load Calculation Method: CSA F280-12 Infiltration/Ventilation: 5,851 W
Outdoor Temperature: -16.0 °C Total Heating Load: 28,702 W
Floorplans / Levels:
Floor 1 145.1 m² Other: 28,702 W
Floor 2 145.1 m² Total Heating Load: 28,702 W
Floor 3 145.1 m²
0.0
Total Area: 435.2 m²
Total Zones: 3
Zone Heating Summary
Zone
#
Are
a
Constructio
n
Heating
Types
RH
Load*
FA
Load
Suppleme
ntal
Zone
Load*
101 145.
1
Slab Below
Grade
OTH 0 0 10,615 10,615
201 145.
1
Suspended OTH 0 0 8,695 8,695
Document Page
301 145.
1
Suspended OTH 0 0 9,391 9,391
Total 435.
2
multiple OTH 0 0 28,702 -
*RH Loads include internal panel back loss that may not be included in the project total.
Room Heating Summary (By Floorplan)
Floor 1
Zone
#
Room Name Heatin
g
Type
Are
a
Heated
Area
Tube
Spacing
Floor
Cover
RV
Unit
RH
Load
RH
Load
BB
Load
FA
Load
Other
Load
Total
Load
101 Room 1 OT
H
119.
5
114.
1
30
5
0.0
9
0.0 0 0 0 8,597 8,597
101 Room 2 OT
H
25.5 24.0 30
5
0.0
9
0.0 0 0 0 2,018 2,018
Document Page
Main Floor
Zo
ne
#
Roo
m
Na
me
Heati
ng
Typ
e
Ar
ea
Hea
ted
Ar
ea
Tub
e
Spaci
ng
Floo
r
Cover
RV
Unit
R
H
Lo
ad
R
H
Lo
ad
B
B
Lo
ad
F
A
Lo
ad
Ot
her
Lo
ad
To
tal
Lo
ad
20
1
Roo
m 1
O
T
H
10
1.6
9
8.
0
3
0
5
0
.
0
9
0
.
0
0 0 0 5,7
27
5,7
27
20
1
Roo
m 2
O
T
H
25.
5
2
4.
0
3
0
5
0
.
0
9
0
.
0
0 0 0 1,5
13
1,5
13
20
1
Roo
m 3
O
T
H
17.
9
1
6.
6
3
0
5
0
.
0
9
0
.
0
0 0 0 1,4
55
1,4
55
Second Floor
Zo
ne
#
Roo
m
Na
me
Heati
ng
Typ
e
Ar
ea
Hea
ted
Ar
ea
Tub
e
Spaci
ng
Floo
r
Cover
RV
Unit
R
H
Lo
ad
R
H
Lo
ad
B
B
Lo
ad
F
A
Lo
ad
Ot
her
Lo
ad
To
tal
Lo
ad
30
1
Roo
m 1
O
T
H
10
1.6
9
8.
0
3
0
5
0
.
0
9
0
.
0
0 0 0 6,2
47
6,2
47
30
1
Roo
m 2
O
T
H
25.
5
2
4.
0
3
0
5
0
.
0
9
0
.
0
0 0 0 1,6
37
1,6
37
30
1
Roo
m 3
O
T
H
17.
9
1
6.
6
3
0
5
0
.
0
9
0
.
0
0 0 0 1,5
07
1,5
07
Roof
Zone Room Name Heatin Area Heat Tube Floor Unit RH BB
tabler-icon-diamond-filled.svg

Secure Best Marks with AI Grader

Need help grading? Try our AI Grader for instant feedback on your assignments.
Document Page
# g
Type
ed
Are
a
Spacing Cover
RV
RH
Load
Load Load
House simulation is intended for modeling structures which applies to different setups, which
include indoor and outdoor envinronment.
While researchers have a particular purpose and focus performance parameter. Its performance
will lead to a detailed creation and optimization of the thermal characteristics of the buildings on
the basis of data extraction, respectively. The aim of thermal analysis on the current building is
to establish a baseline. On the opposite, the goal is to make an early prediction based on many
phenomena if it is performed during the design stage.
Conclusions and recommendations
The HVAC systems designed in this model affects the thermal conditions of the
structure.Therefore, it is a critical concern, which is a thermal relief for an indoor setting, that the
building envelope has been built to withstand ambient weather by preventing excess heat
accumulation. Thermal simulation is used to model analyzes of critical factors such as air heating
load and cooling load. The simulation with IES model IT should be accurate as 14 high degrees
of certainty is included.
The efficiency analysis is based on this research on the proactive methods, which illustrate the
well-being of building facilities, while maintaining thermal comfort indoors.
Layout and presentation
Document Page
Figure 4 plan layout
Software version IESVE 2019
Document Page
References
Faulconbridge, J., 2015. Mobilising sustainable building assessment models: agents, strategies
and local effects. Area, 47(2), pp.116-123.
Jarzabek-Rychard, M. and Karpina, M., 2016. QUALITY ANALYSIS ON 3D BUIDLING
MODELS RECONSTRUCTED FROM UAV IMAGERY. ISPRS - International Archives of the
Photogrammetry, Remote Sensing and Spatial Information Sciences, XLI-B1, pp.1121-1126.
Mostafavi, N., Farzinmoghadam, M. and Hoque, S., 2013. Envelope retrofit analysis using
eQUEST, IESVE Revit Plug-in and Green Building Studio: a university dormitory case
study. International Journal of Sustainable Energy, 34(9), pp.594-613.
Rafiei, M. and Adeli, H., 2016. Sustainability in highrise building design and construction. The
Structural Design of Tall and Special Buildings, 25(13), pp.643-658.
Thomas, A., Menassa, C. and Kamat, V., 2017. Lightweight and adaptive building simulation
(LABS) framework for integrated building energy and thermal comfort analysis. Building
Simulation, 10(6), pp.1023-1044.
Tian, W. and de Wilde, P., 2011. Thermal building simulation using the UKCP09 probabilistic
climate projections. Journal of Building Performance Simulation, 4(2), pp.105-124.
Zhang, L., Chu, Z., He, Q. and Zhai, P., 2019. Investigating the Constraints to Buidling
Information Modeling (BIM) Applications for Sustainable Building Projects: A Case of
China. Sustainability, 11(7), p.1896.
chevron_up_icon
1 out of 13
circle_padding
hide_on_mobile
zoom_out_icon
logo.png

Your All-in-One AI-Powered Toolkit for Academic Success.

Available 24*7 on WhatsApp / Email

[object Object]