Analysis of John Wood Group Plc: Oil and Gas Accounting Management
VerifiedAdded on 2023/06/15
|29
|6588
|348
Report
AI Summary
This report provides a comprehensive analysis of John Wood Group Plc, a multinational company in the energy services industry, focusing on its financial performance over the last five years. It examines the company's growth rate, asset turnover ratio, business and financial risks, and systematic risk, comparing it against competitors like Petrofac Ltd and Schlumberger Ltd. The report evaluates the company's capital structure, cost of capital using Weighted Average Cost of Capital (WACC), and employs various valuation models to assess its share price. Furthermore, it delves into the company's dividend policy, projects, and acquisitions, offering insights into its financial health and strategic decisions. Desklib offers access to similar solved assignments and past papers for students.
RUNNING HEAD: OIL AND GAS ACCOUNTING
John Wood Group Plc. management report
John Wood Group Plc. management report
Paraphrase This Document
Need a fresh take? Get an instant paraphrase of this document with our AI Paraphraser
Oil and gas accounting 1
Contents
Executive Summary...................................................................................................................3
Introduction................................................................................................................................4
Risk Profile.................................................................................................................................4
Growth Rate (Sales)...............................................................................................................4
Asset Turnover Ratio.............................................................................................................6
Business Risk.........................................................................................................................7
Financial Risk.........................................................................................................................8
Systematic Risk....................................................................................................................10
Factors affecting systematic risk..........................................................................................10
Return on Assets..................................................................................................................11
Return on Equity..................................................................................................................12
Actions taken by Management to Manage the Risk.............................................................13
Analysis of company’s value...................................................................................................14
Cost of capital......................................................................................................................14
Net Asset Value Approach...................................................................................................16
The Dividend Valuation Approach......................................................................................16
Price-Earnings Ratio Approach............................................................................................17
Rappaport’s Shareholder Value Model................................................................................17
Projects and acquisitions..........................................................................................................18
Analysis of Company’s Dividend Policy.................................................................................19
References................................................................................................................................21
Bibliography.............................................................................................................................23
Appendices...............................................................................................................................26
Appendix 1...........................................................................................................................26
Appendix 2...........................................................................................................................26
Oil and gas accounting 2
Table of Figures
Figure 1: John Wood Revenues..............................................................................................4
Figure 2: John Wood growth rates.........................................................................................5
Figure 3: Asset Turnover.........................................................................................................5
Figure 4: Competitors' revenue..............................................................................................6
Figure 5: Operating Profit.......................................................................................................6
Figure 6: Net Profit..................................................................................................................7
Figure 7: Net Debt....................................................................................................................8
Figure 8: Rappaport Shareholder Value Model.................................................................14
Figure 9: Dividend Yield.......................................................................................................15
Table of Contents
Table 1: Sales by years.............................................................................................................5
Table 2: Financial Leverage....................................................................................................9
Table 3: Return on Assets......................................................................................................10
Table 4: Return on Equity.....................................................................................................10
Table 5: Cost of Equity..........................................................................................................12
Table 6: Cost of Debt.............................................................................................................12
Table 7: Weighted Average Cost of Capital........................................................................12
Table 8: Net Asset Value........................................................................................................13
Table 9: Dividends..................................................................................................................13
⊘ This is a preview!⊘
Do you want full access?
Subscribe today to unlock all pages.
Trusted by 1+ million students worldwide
Oil and gas accounting 3
Executive Summary
John Wood Group Plc was established in the year 1961 (Yahoo Finance, 2016) and is
listed on FTSE 250 Index. This report examines the performance of the company over the last
five years to bring out with a conclusion after identifying and evaluating various risks against
its competitors. The various competitors compared in this report are (Energy Business
Review, 2018) are:
Petrofac Ltd.
Schlumberger Ltd.
National Oilwell Varco
Halliburton Co.
The growth rate and how sales have been affected by various factors of the company has
been analysed. In addition, the operating profit, degree of operating leverage (DOL) and
degree of financial leverage (DFL) are assessed to know the business and financial risk of the
company. Further, the report also emphasizes on the capital structure of John Wood Group
PLC and evaluates its cost of capital through Weighted Average Cost of Capital (WACC).
Moreover, the significant models of valuations are used to compute the company’s share
price in the market.
Paraphrase This Document
Need a fresh take? Get an instant paraphrase of this document with our AI Paraphraser
Oil and gas accounting 4
Introduction
John Wood Group is a multinational company and operates in the energy services
Industry. Primarily, the company is headquartered in the Aberdeen, United Kingdom, but the
operations are spread in various countries across the globe. The company make available a
range of activities to oil and gas and energy sectors worldwide like engineering, maintaining
management services, and supporting production. The company has grown year by year
significantly to function in more than 60 countries and employed more than 25000 employees
(John Wood Group PLC, 2018).
Risk Profile
Growth Rate (Sales)
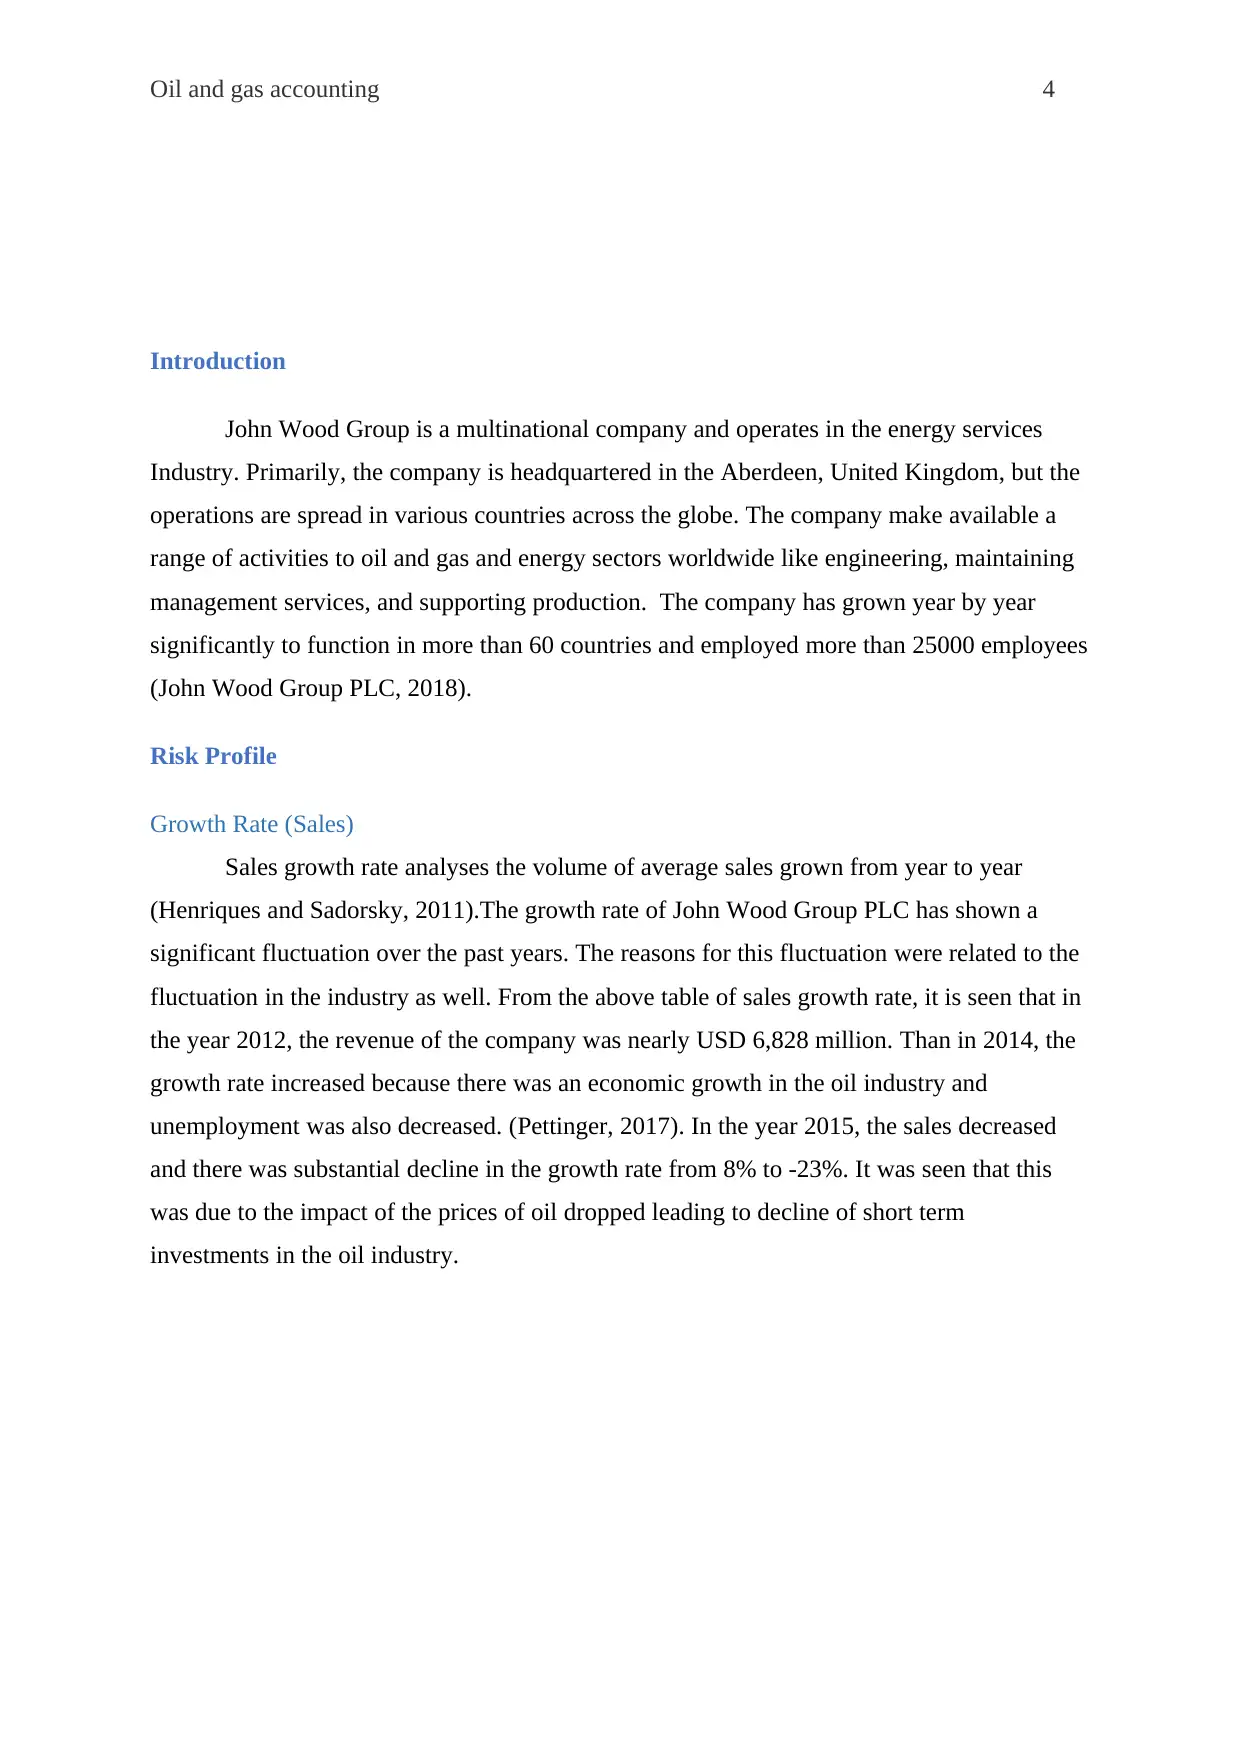
Sales growth rate analyses the volume of average sales grown from year to year
(Henriques and Sadorsky, 2011).The growth rate of John Wood Group PLC has shown a
significant fluctuation over the past years. The reasons for this fluctuation were related to the
fluctuation in the industry as well. From the above table of sales growth rate, it is seen that in
the year 2012, the revenue of the company was nearly USD 6,828 million. Than in 2014, the
growth rate increased because there was an economic growth in the oil industry and
unemployment was also decreased. (Pettinger, 2017). In the year 2015, the sales decreased
and there was substantial decline in the growth rate from 8% to -23%. It was seen that this
was due to the impact of the prices of oil dropped leading to decline of short term
investments in the oil industry.
Introduction
John Wood Group is a multinational company and operates in the energy services
Industry. Primarily, the company is headquartered in the Aberdeen, United Kingdom, but the
operations are spread in various countries across the globe. The company make available a
range of activities to oil and gas and energy sectors worldwide like engineering, maintaining
management services, and supporting production. The company has grown year by year
significantly to function in more than 60 countries and employed more than 25000 employees
(John Wood Group PLC, 2018).
Risk Profile
Growth Rate (Sales)
Sales growth rate analyses the volume of average sales grown from year to year
(Henriques and Sadorsky, 2011).The growth rate of John Wood Group PLC has shown a
significant fluctuation over the past years. The reasons for this fluctuation were related to the
fluctuation in the industry as well. From the above table of sales growth rate, it is seen that in
the year 2012, the revenue of the company was nearly USD 6,828 million. Than in 2014, the
growth rate increased because there was an economic growth in the oil industry and
unemployment was also decreased. (Pettinger, 2017). In the year 2015, the sales decreased
and there was substantial decline in the growth rate from 8% to -23%. It was seen that this
was due to the impact of the prices of oil dropped leading to decline of short term
investments in the oil industry.
Oil and gas accounting 5
2012 2013 2014 2015 2016
0
1,000
2,000
3,000
4,000
5,000
6,000
7,000
8,000
Revenue
Sales($m)
Years
$m
Figure 1: John Wood Revenues
Sales Growth Rate
Year
Sales
($m) Growth rate
2012 6,828
2013 7,064 3%
2014 7,616 8%
2015 5,852 -23%
2016 4,934 -16%
(Annual Report, 2016)
Table 1: Sales by years
2012 2013 2014 2015 2016
0
1,000
2,000
3,000
4,000
5,000
6,000
7,000
8,000
Revenue
Sales($m)
Years
$m
Figure 1: John Wood Revenues
Sales Growth Rate
Year
Sales
($m) Growth rate
2012 6,828
2013 7,064 3%
2014 7,616 8%
2015 5,852 -23%
2016 4,934 -16%
(Annual Report, 2016)
Table 1: Sales by years
⊘ This is a preview!⊘
Do you want full access?
Subscribe today to unlock all pages.
Trusted by 1+ million students worldwide
Oil and gas accounting 6
2012 2013 2014 2015 2016
-25%
-20%
-15%
-10%
-5%
0%
5%
10%
Sales Growth Rate
Growth Rate
Years
%
Figure 2: John Wood growth rates
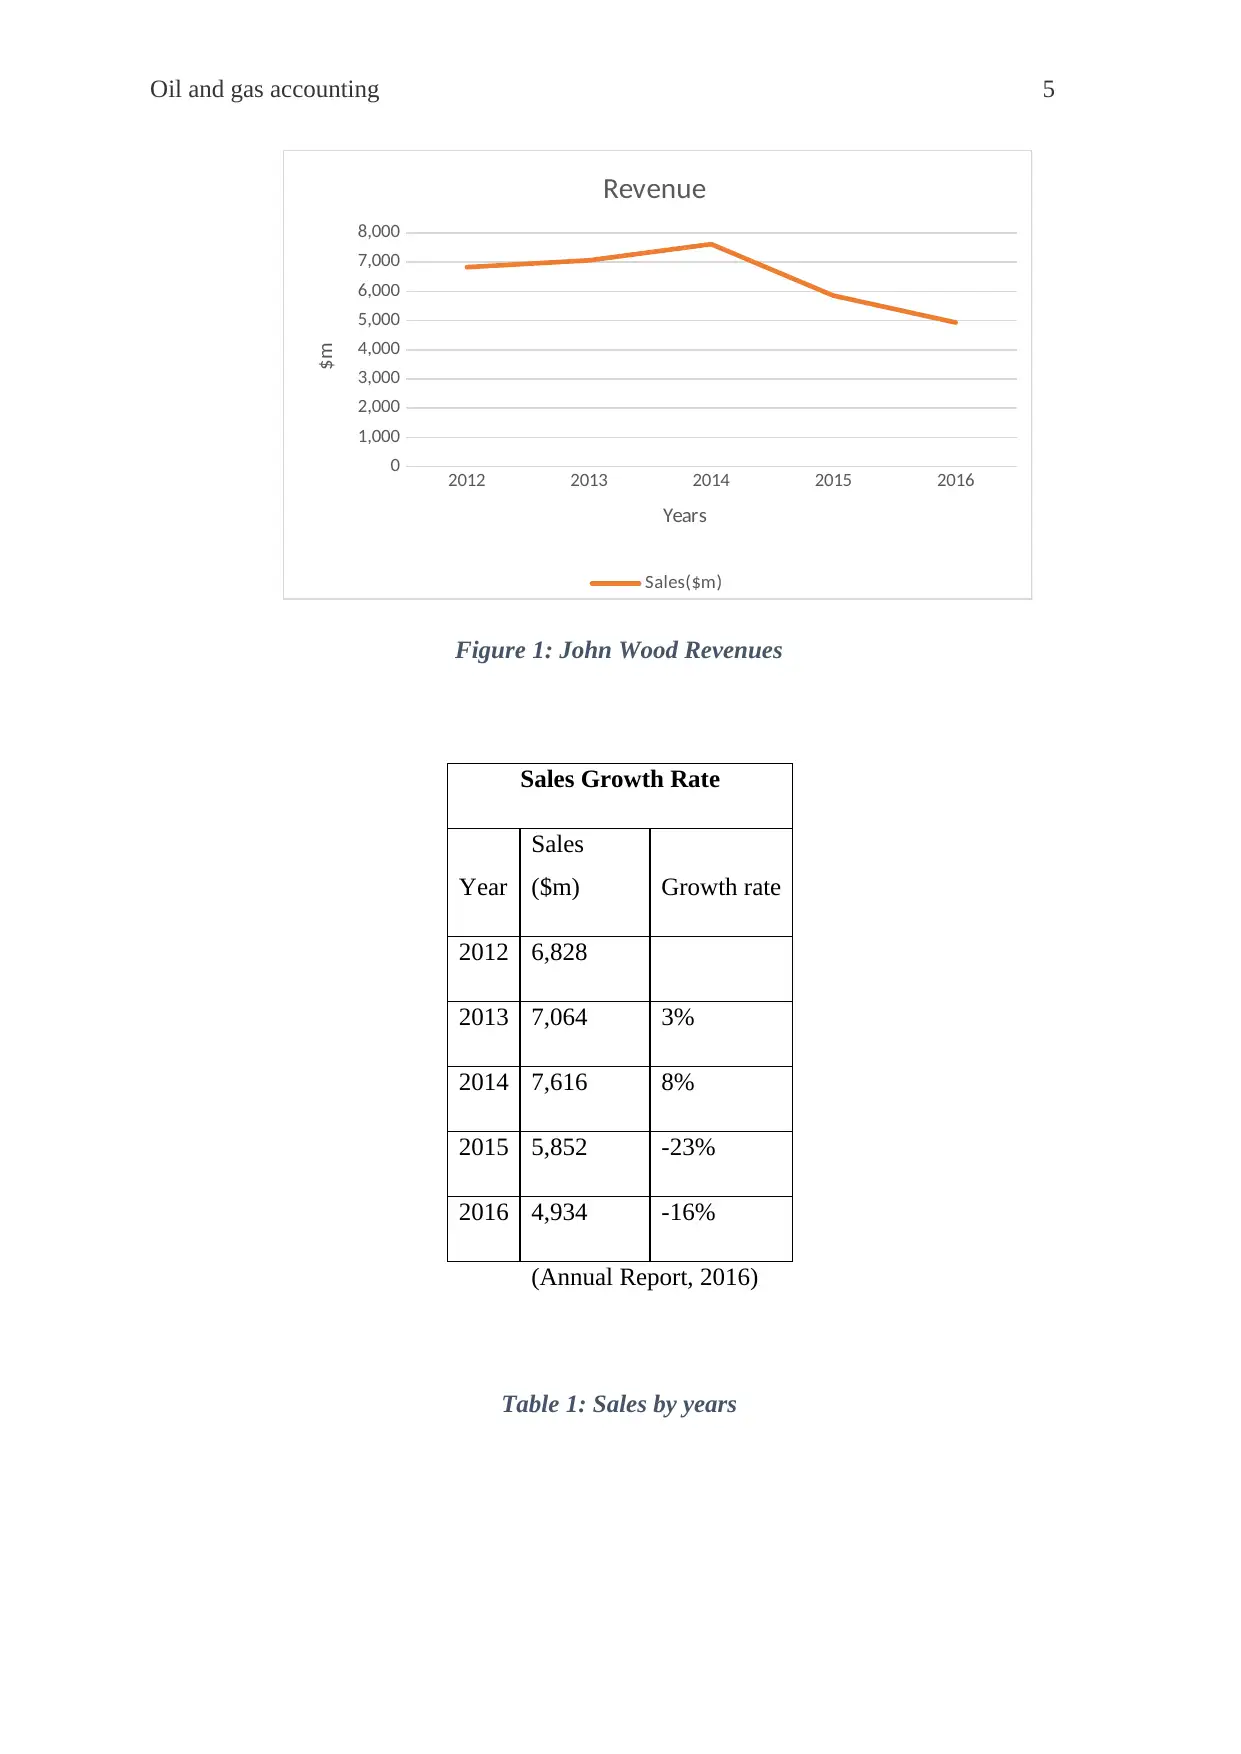
Asset Turnover Ratio
The asset turnover ratio measures the capability of the company to generate revenue
by deploying its assets effectively and efficiently. From the below figure, it can be seen that
John wood Group Plc competitors had enough assets to sustain positive growth. However, the
company was not able to maintain assets.
2012 2013 2014 2015 2016
0
0.2
0.4
0.6
0.8
1
1.2
1.4
1.6
1.8
Asset Turnover Ratio
John Wood Group PLC Petrofac Ltd. Schlumberger Ltd.
National Oilwell Varco Halliburton Co.
Years
Values
Figure 3: Asset Turnover
2012 2013 2014 2015 2016
-25%
-20%
-15%
-10%
-5%
0%
5%
10%
Sales Growth Rate
Growth Rate
Years
%
Figure 2: John Wood growth rates
Asset Turnover Ratio
The asset turnover ratio measures the capability of the company to generate revenue
by deploying its assets effectively and efficiently. From the below figure, it can be seen that
John wood Group Plc competitors had enough assets to sustain positive growth. However, the
company was not able to maintain assets.
2012 2013 2014 2015 2016
0
0.2
0.4
0.6
0.8
1
1.2
1.4
1.6
1.8
Asset Turnover Ratio
John Wood Group PLC Petrofac Ltd. Schlumberger Ltd.
National Oilwell Varco Halliburton Co.
Years
Values
Figure 3: Asset Turnover
Paraphrase This Document
Need a fresh take? Get an instant paraphrase of this document with our AI Paraphraser
Oil and gas accounting 7
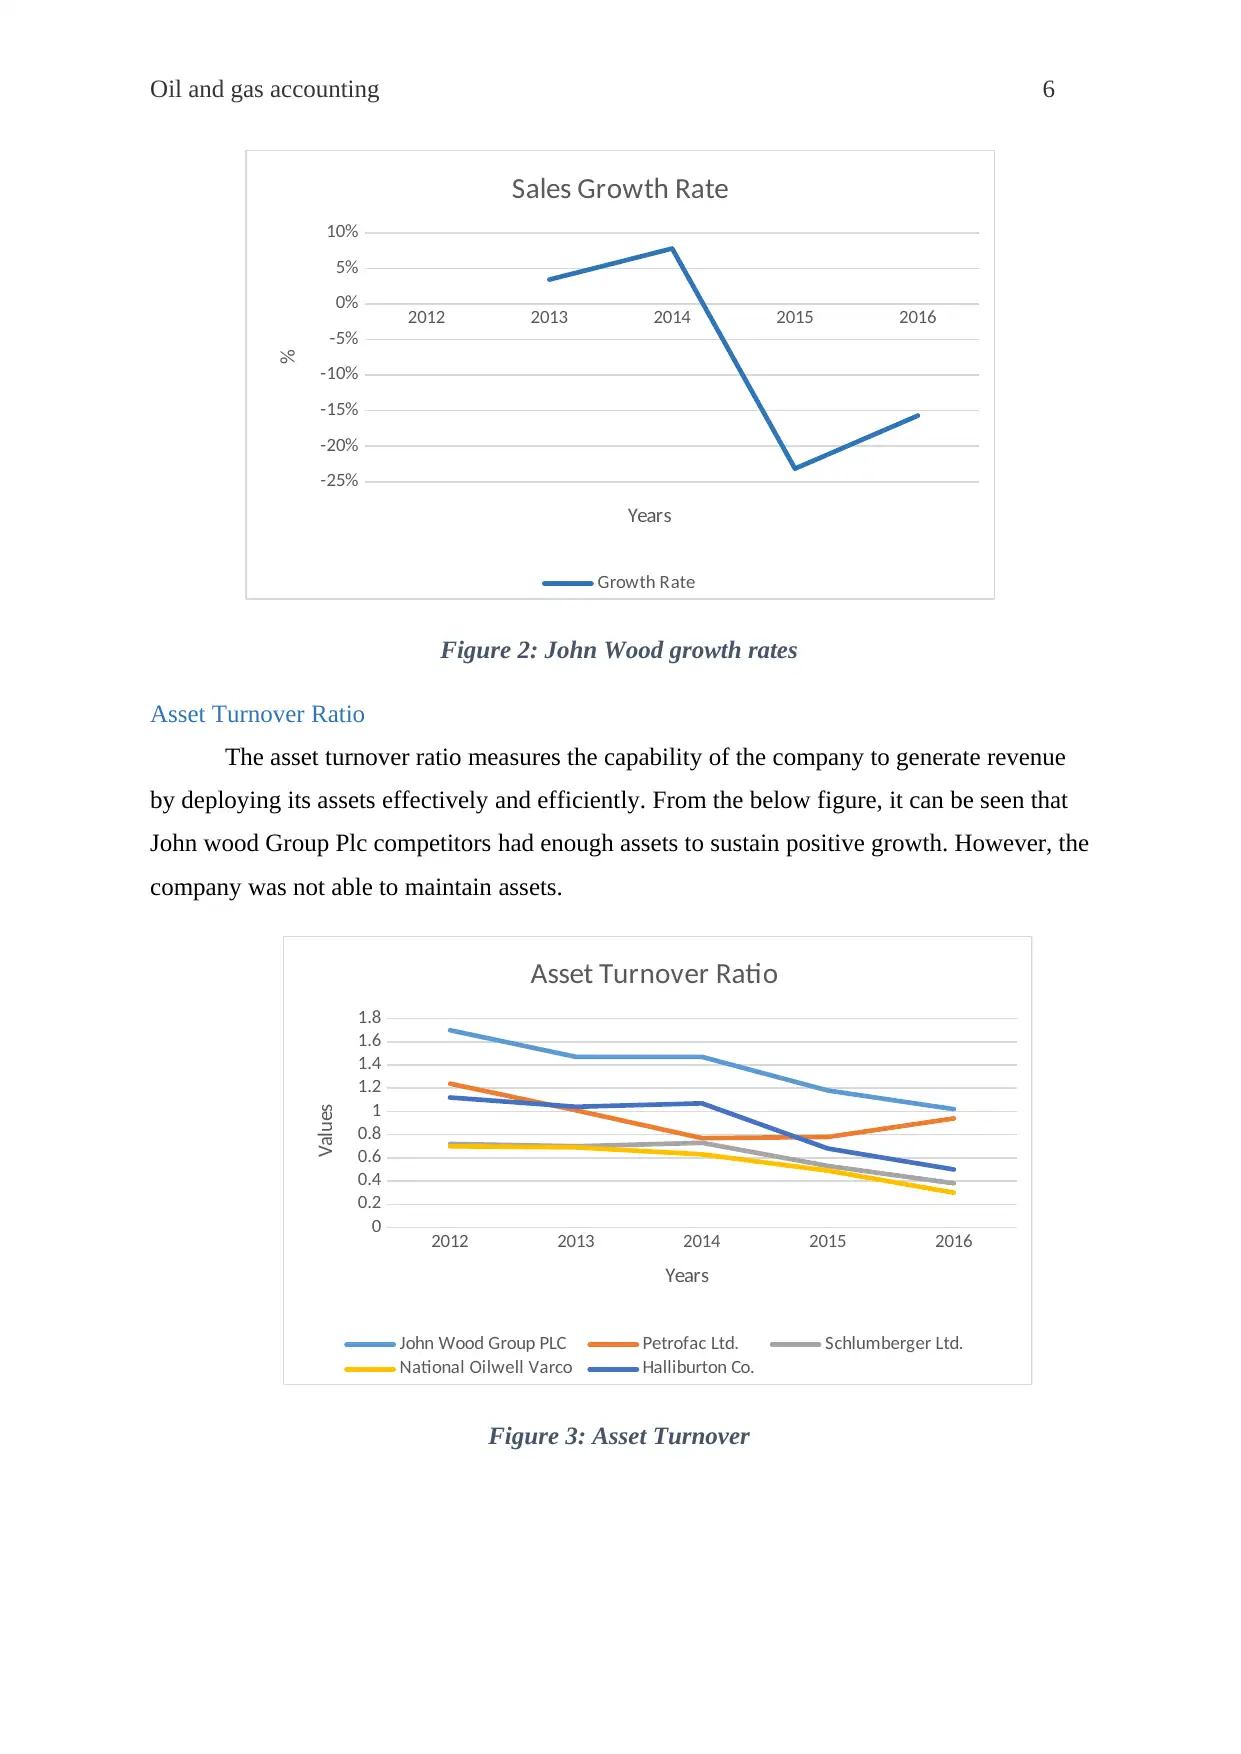
Business Risk
The possibility where a business can have lower profits than the expected ones is
generally called as business risk. It is directly affected by the operating profits of the
company. Operating profit margin is a profitability ratio which helps to measure the amount
of revenue left after deducting all operating cost and thus indicating the degree of business
risk. The decisions of creditors and investors are based upon this ratio as it gives a picture of
how profitable a company’s working are and creating value for shareholders (Knight, 2012).
However, business risk is also affected by the level of debt in the capital structure of the
company. Wood Group’s debt-to-equity ratio is 42.1% indicating not a strong performance of
the company. Therefore, in June 2017, John Wood Group PLC has an operating margin of
4.74% (Yahoo Finance, 2018). Apart from that, the joint ventures of the company made a
major contribution in the company’s total revenue and earnings before income and tax. A
high turnover indicates a healthier state of affairs of the company (Gibson, 2011).
2012 2013 2014 2015 2016
0
10000
20000
30000
40000
50000
60000
Revenue
John Wood Group PLC Petrofac Ltd. Schlumberger Ltd.
National Oilwell Varco Halliburton Co.
Years
$m
Figure 4: Competitors' revenue
From the above figure, it can be seen that after 2014, all the competitors of John Wood Group
except Petrofac Ltd, faced a decline in their turnover including the company itself.
Oil and gas accounting 8
2012 2013 2014 2015 2016
-8000
-6000
-4000
-2000
0
2000
4000
6000
8000
10000
12000
Operating Profit
John Wood Group PLC Petrofac Ltd. Schlumberger Ltd.
National Oilwell Varco Halliburton Co.
Years
$m
Figure 5: Operating Profit
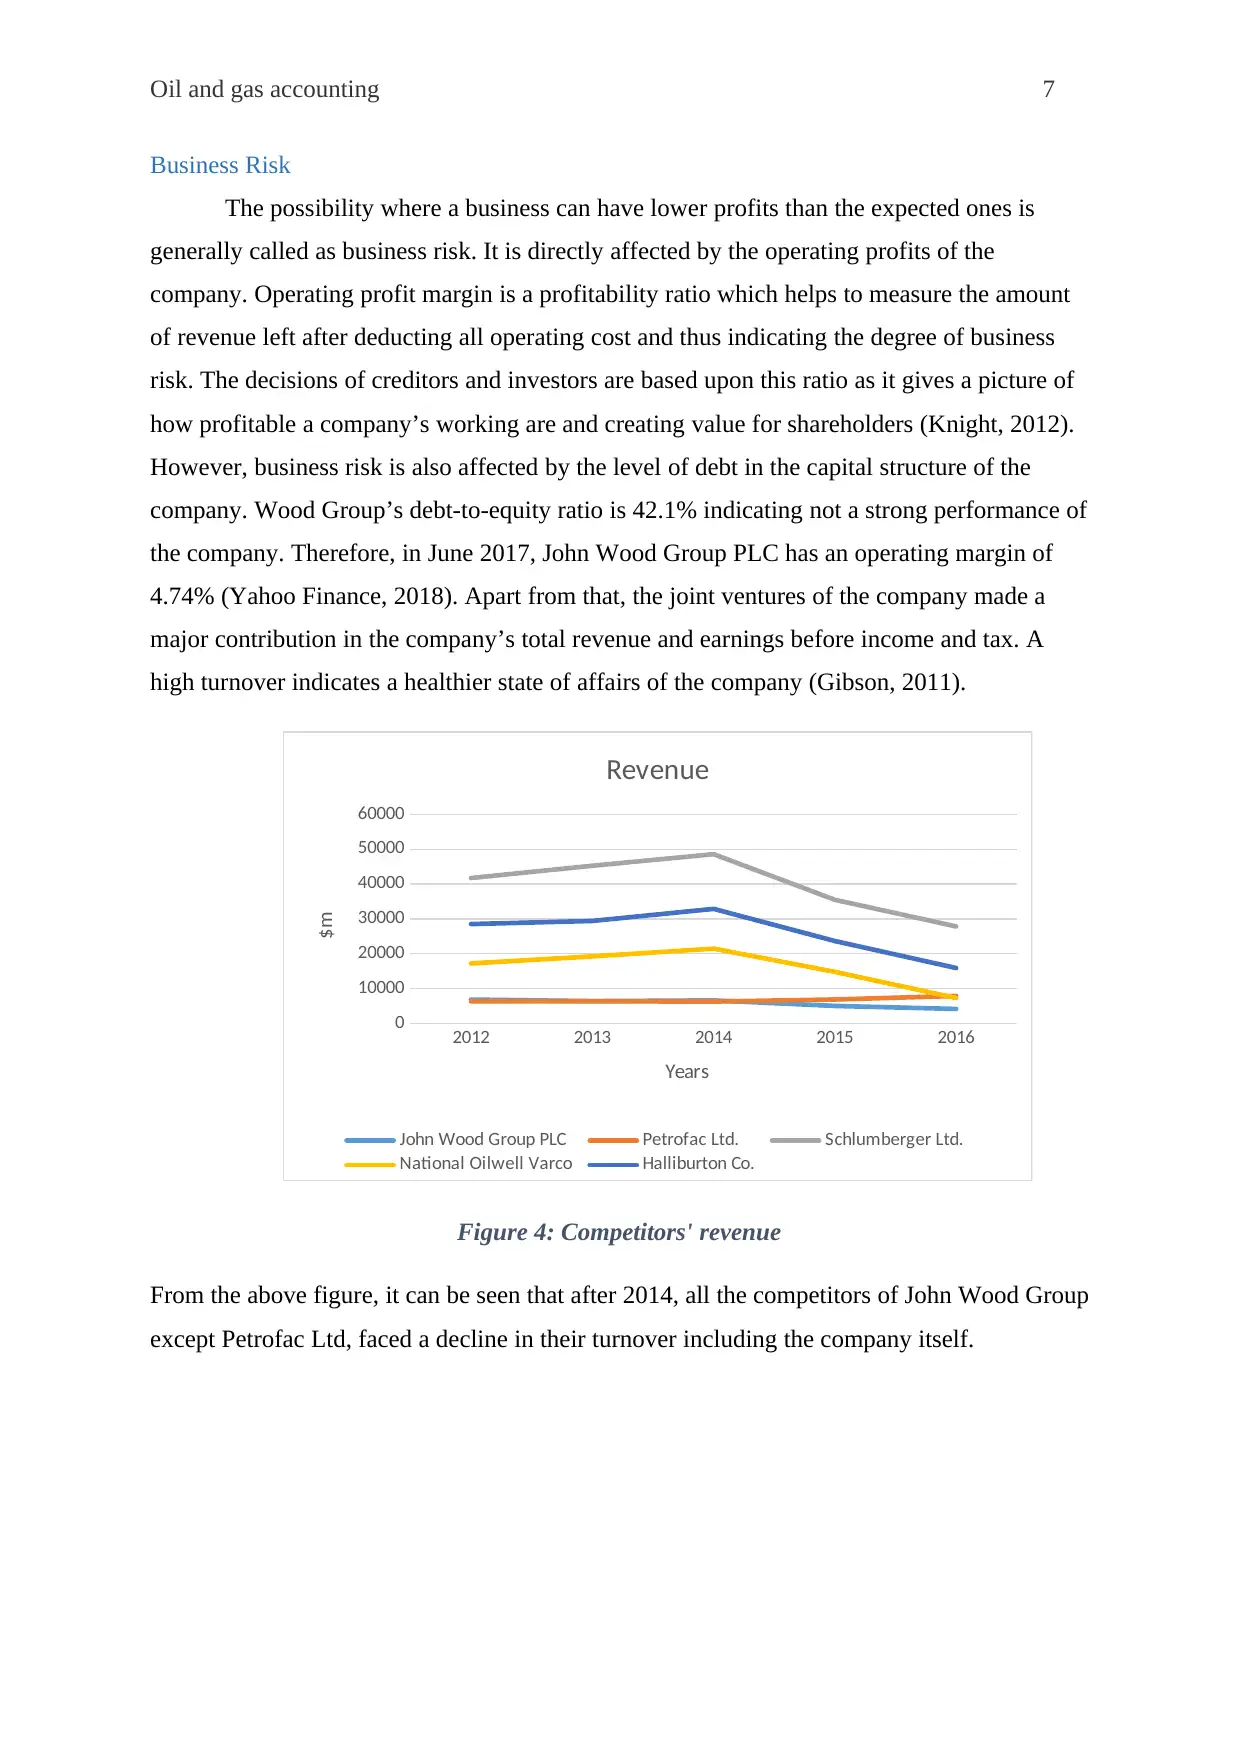
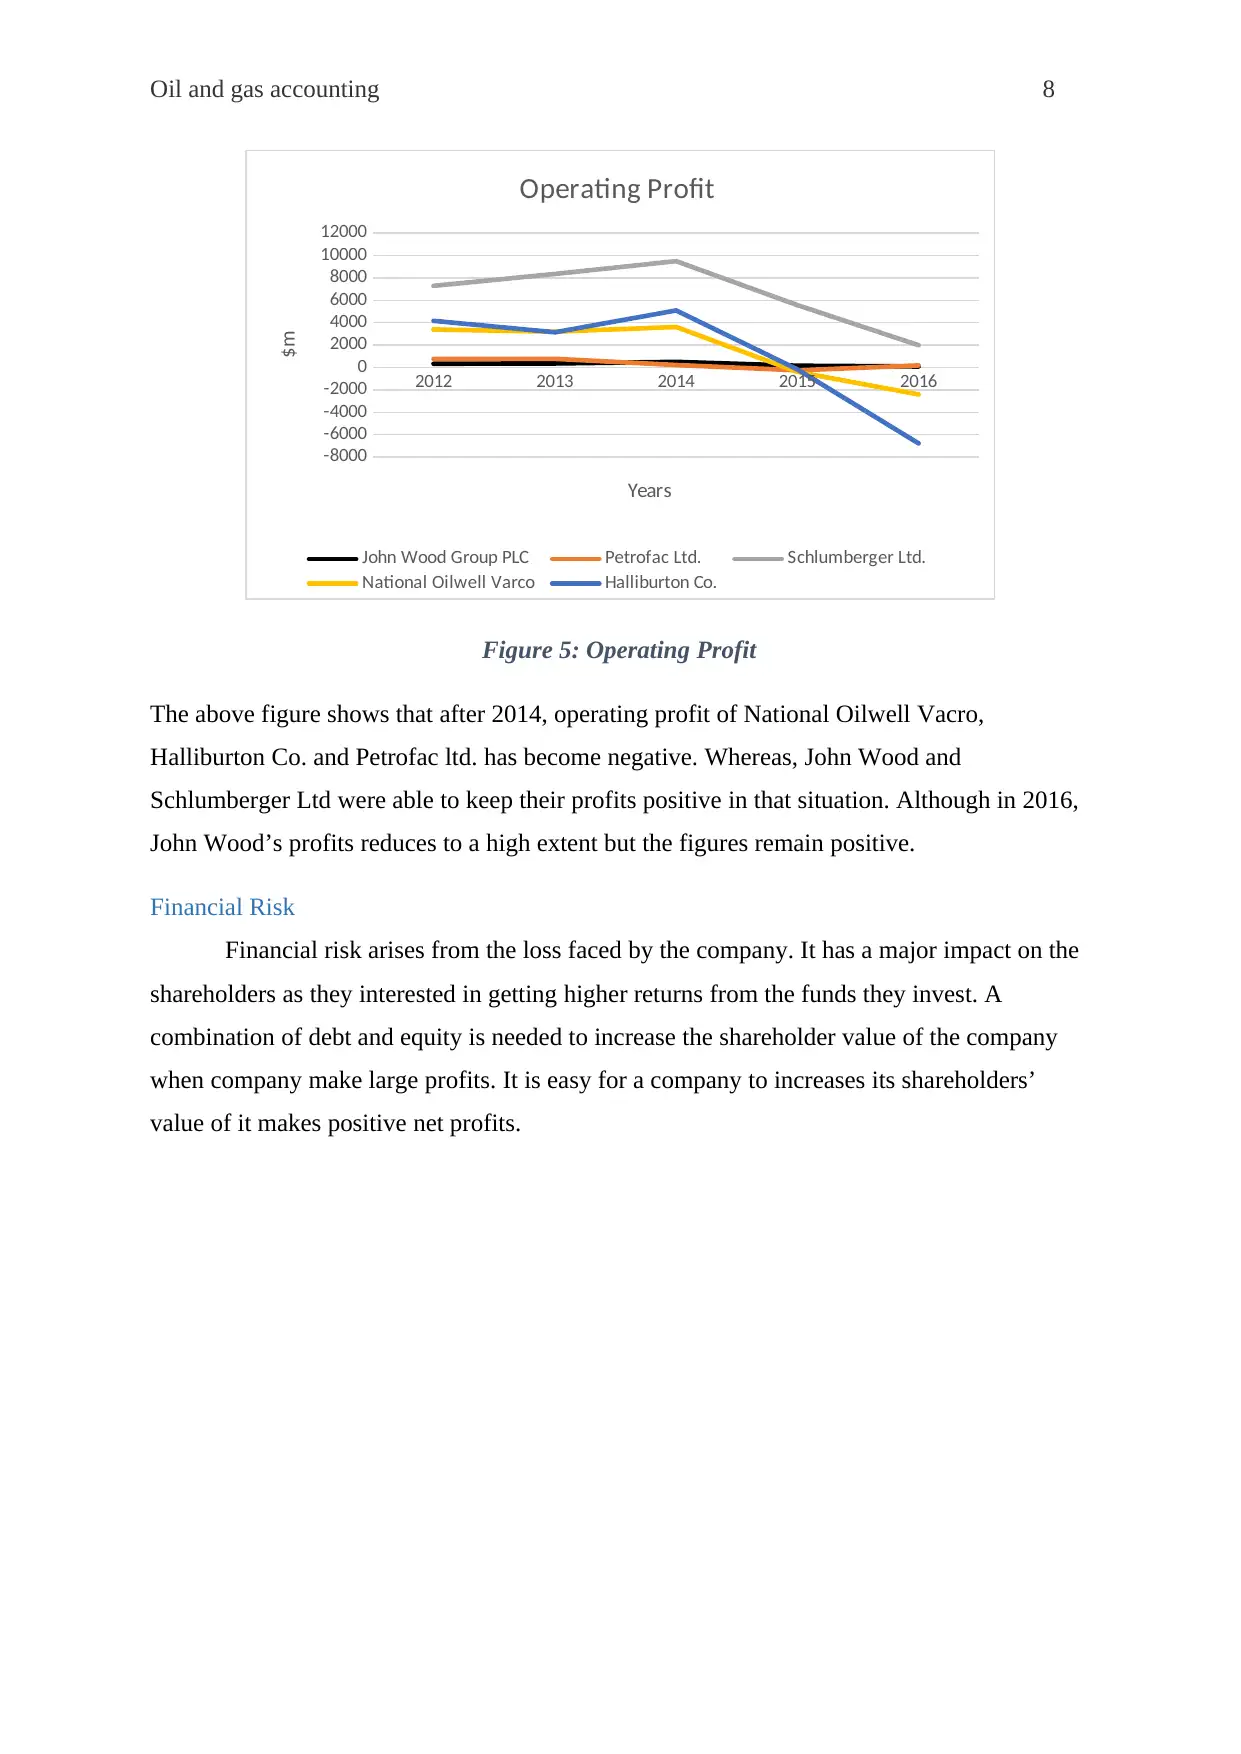
The above figure shows that after 2014, operating profit of National Oilwell Vacro,
Halliburton Co. and Petrofac ltd. has become negative. Whereas, John Wood and
Schlumberger Ltd were able to keep their profits positive in that situation. Although in 2016,
John Wood’s profits reduces to a high extent but the figures remain positive.
Financial Risk
Financial risk arises from the loss faced by the company. It has a major impact on the
shareholders as they interested in getting higher returns from the funds they invest. A
combination of debt and equity is needed to increase the shareholder value of the company
when company make large profits. It is easy for a company to increases its shareholders’
value of it makes positive net profits.
2012 2013 2014 2015 2016
-8000
-6000
-4000
-2000
0
2000
4000
6000
8000
10000
12000
Operating Profit
John Wood Group PLC Petrofac Ltd. Schlumberger Ltd.
National Oilwell Varco Halliburton Co.
Years
$m
Figure 5: Operating Profit
The above figure shows that after 2014, operating profit of National Oilwell Vacro,
Halliburton Co. and Petrofac ltd. has become negative. Whereas, John Wood and
Schlumberger Ltd were able to keep their profits positive in that situation. Although in 2016,
John Wood’s profits reduces to a high extent but the figures remain positive.
Financial Risk
Financial risk arises from the loss faced by the company. It has a major impact on the
shareholders as they interested in getting higher returns from the funds they invest. A
combination of debt and equity is needed to increase the shareholder value of the company
when company make large profits. It is easy for a company to increases its shareholders’
value of it makes positive net profits.
⊘ This is a preview!⊘
Do you want full access?
Subscribe today to unlock all pages.
Trusted by 1+ million students worldwide
Oil and gas accounting 9
2012 2013 2014 2015 2016
-8000
-6000
-4000
-2000
0
2000
4000
6000
8000
Net Profit
John Wood Group PLC Petrofac Ltd. Schlumberger Ltd.
National Oilwell Varco Halliburton Co.
Years
$m
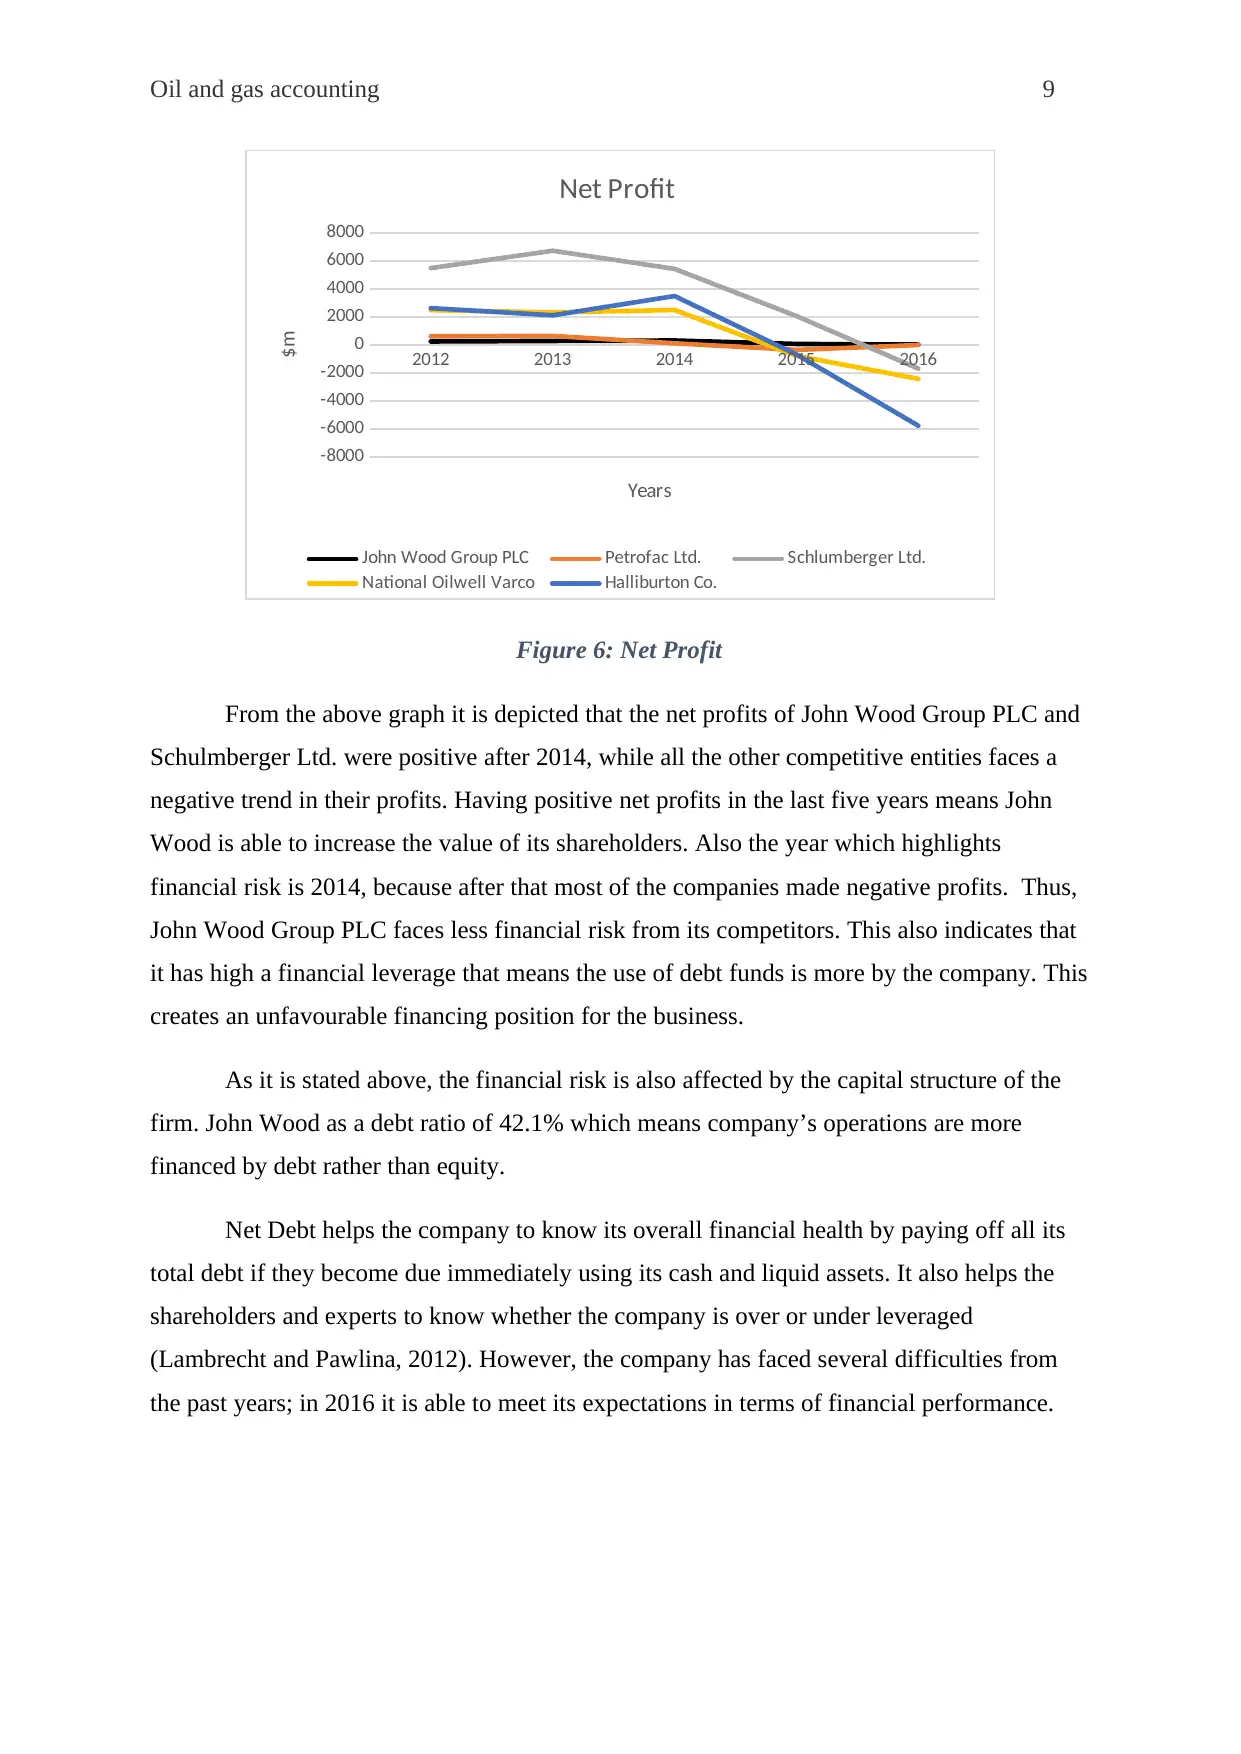
Figure 6: Net Profit
From the above graph it is depicted that the net profits of John Wood Group PLC and
Schulmberger Ltd. were positive after 2014, while all the other competitive entities faces a
negative trend in their profits. Having positive net profits in the last five years means John
Wood is able to increase the value of its shareholders. Also the year which highlights
financial risk is 2014, because after that most of the companies made negative profits. Thus,
John Wood Group PLC faces less financial risk from its competitors. This also indicates that
it has high a financial leverage that means the use of debt funds is more by the company. This
creates an unfavourable financing position for the business.
As it is stated above, the financial risk is also affected by the capital structure of the
firm. John Wood as a debt ratio of 42.1% which means company’s operations are more
financed by debt rather than equity.
Net Debt helps the company to know its overall financial health by paying off all its
total debt if they become due immediately using its cash and liquid assets. It also helps the
shareholders and experts to know whether the company is over or under leveraged
(Lambrecht and Pawlina, 2012). However, the company has faced several difficulties from
the past years; in 2016 it is able to meet its expectations in terms of financial performance.
2012 2013 2014 2015 2016
-8000
-6000
-4000
-2000
0
2000
4000
6000
8000
Net Profit
John Wood Group PLC Petrofac Ltd. Schlumberger Ltd.
National Oilwell Varco Halliburton Co.
Years
$m
Figure 6: Net Profit
From the above graph it is depicted that the net profits of John Wood Group PLC and
Schulmberger Ltd. were positive after 2014, while all the other competitive entities faces a
negative trend in their profits. Having positive net profits in the last five years means John
Wood is able to increase the value of its shareholders. Also the year which highlights
financial risk is 2014, because after that most of the companies made negative profits. Thus,
John Wood Group PLC faces less financial risk from its competitors. This also indicates that
it has high a financial leverage that means the use of debt funds is more by the company. This
creates an unfavourable financing position for the business.
As it is stated above, the financial risk is also affected by the capital structure of the
firm. John Wood as a debt ratio of 42.1% which means company’s operations are more
financed by debt rather than equity.
Net Debt helps the company to know its overall financial health by paying off all its
total debt if they become due immediately using its cash and liquid assets. It also helps the
shareholders and experts to know whether the company is over or under leveraged
(Lambrecht and Pawlina, 2012). However, the company has faced several difficulties from
the past years; in 2016 it is able to meet its expectations in terms of financial performance.
Paraphrase This Document
Need a fresh take? Get an instant paraphrase of this document with our AI Paraphraser
Oil and gas accounting 10
2012 2013 2014 2015 2016
0
2000
4000
6000
8000
10000
12000
14000
16000
18000
Net Debt
John Wood Group PLC
Petrofac Ltd
Schlumberger Ltd.
National Oilwell Varco
Halliburton Co.
Years
$m
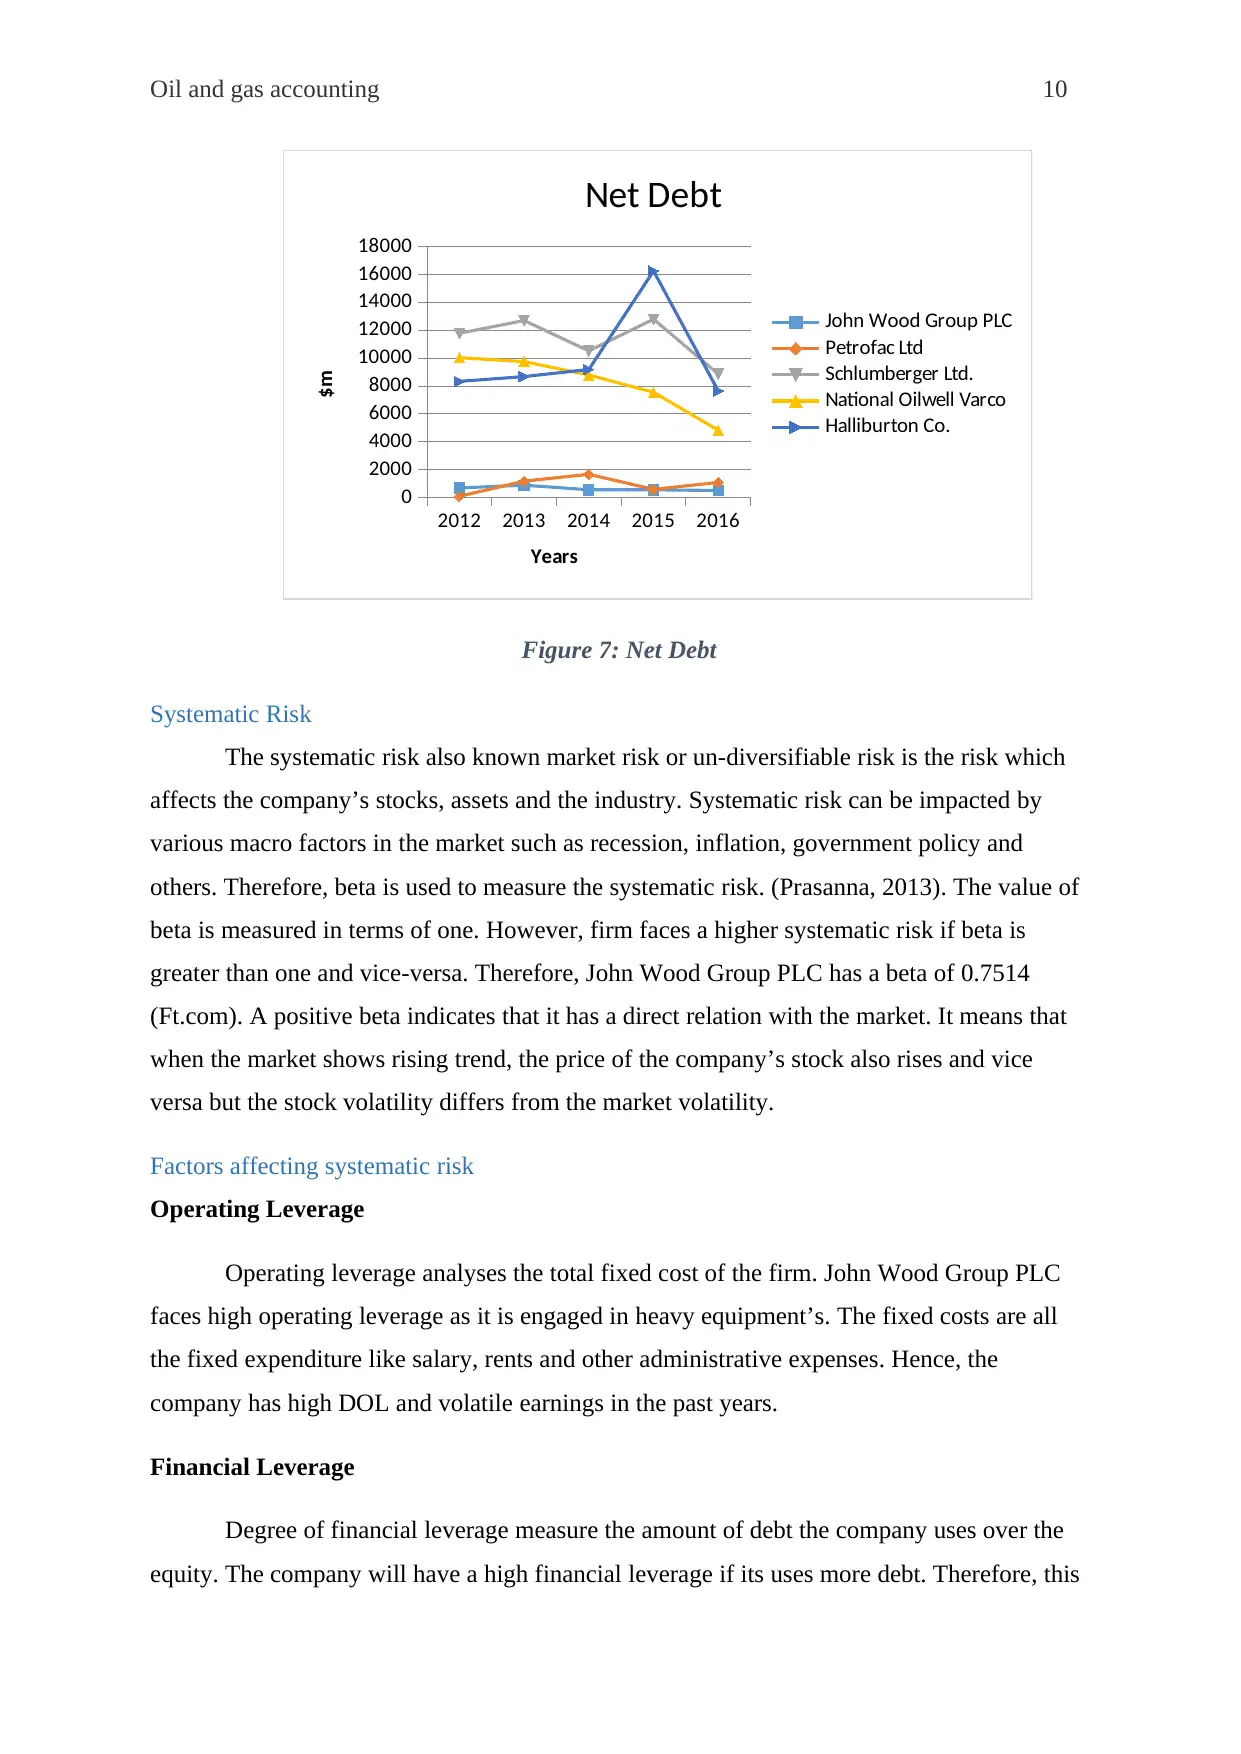
Figure 7: Net Debt
Systematic Risk
The systematic risk also known market risk or un-diversifiable risk is the risk which
affects the company’s stocks, assets and the industry. Systematic risk can be impacted by
various macro factors in the market such as recession, inflation, government policy and
others. Therefore, beta is used to measure the systematic risk. (Prasanna, 2013). The value of
beta is measured in terms of one. However, firm faces a higher systematic risk if beta is
greater than one and vice-versa. Therefore, John Wood Group PLC has a beta of 0.7514
(Ft.com). A positive beta indicates that it has a direct relation with the market. It means that
when the market shows rising trend, the price of the company’s stock also rises and vice
versa but the stock volatility differs from the market volatility.
Factors affecting systematic risk
Operating Leverage
Operating leverage analyses the total fixed cost of the firm. John Wood Group PLC
faces high operating leverage as it is engaged in heavy equipment’s. The fixed costs are all
the fixed expenditure like salary, rents and other administrative expenses. Hence, the
company has high DOL and volatile earnings in the past years.
Financial Leverage
Degree of financial leverage measure the amount of debt the company uses over the
equity. The company will have a high financial leverage if its uses more debt. Therefore, this
2012 2013 2014 2015 2016
0
2000
4000
6000
8000
10000
12000
14000
16000
18000
Net Debt
John Wood Group PLC
Petrofac Ltd
Schlumberger Ltd.
National Oilwell Varco
Halliburton Co.
Years
$m
Figure 7: Net Debt
Systematic Risk
The systematic risk also known market risk or un-diversifiable risk is the risk which
affects the company’s stocks, assets and the industry. Systematic risk can be impacted by
various macro factors in the market such as recession, inflation, government policy and
others. Therefore, beta is used to measure the systematic risk. (Prasanna, 2013). The value of
beta is measured in terms of one. However, firm faces a higher systematic risk if beta is
greater than one and vice-versa. Therefore, John Wood Group PLC has a beta of 0.7514
(Ft.com). A positive beta indicates that it has a direct relation with the market. It means that
when the market shows rising trend, the price of the company’s stock also rises and vice
versa but the stock volatility differs from the market volatility.
Factors affecting systematic risk
Operating Leverage
Operating leverage analyses the total fixed cost of the firm. John Wood Group PLC
faces high operating leverage as it is engaged in heavy equipment’s. The fixed costs are all
the fixed expenditure like salary, rents and other administrative expenses. Hence, the
company has high DOL and volatile earnings in the past years.
Financial Leverage
Degree of financial leverage measure the amount of debt the company uses over the
equity. The company will have a high financial leverage if its uses more debt. Therefore, this
Oil and gas accounting 11
also increases the burden of repayment of debts along with their interest on the maturity date
affecting the company’s EPS.
Financial Leverage (%)
Year Financial Leverage
201
2 1.87
201
3 1.89
201
4 1.72
201
5 1.7
201
6 1.84
(Morningstar, 2018)
Table 2: Financial Leverage
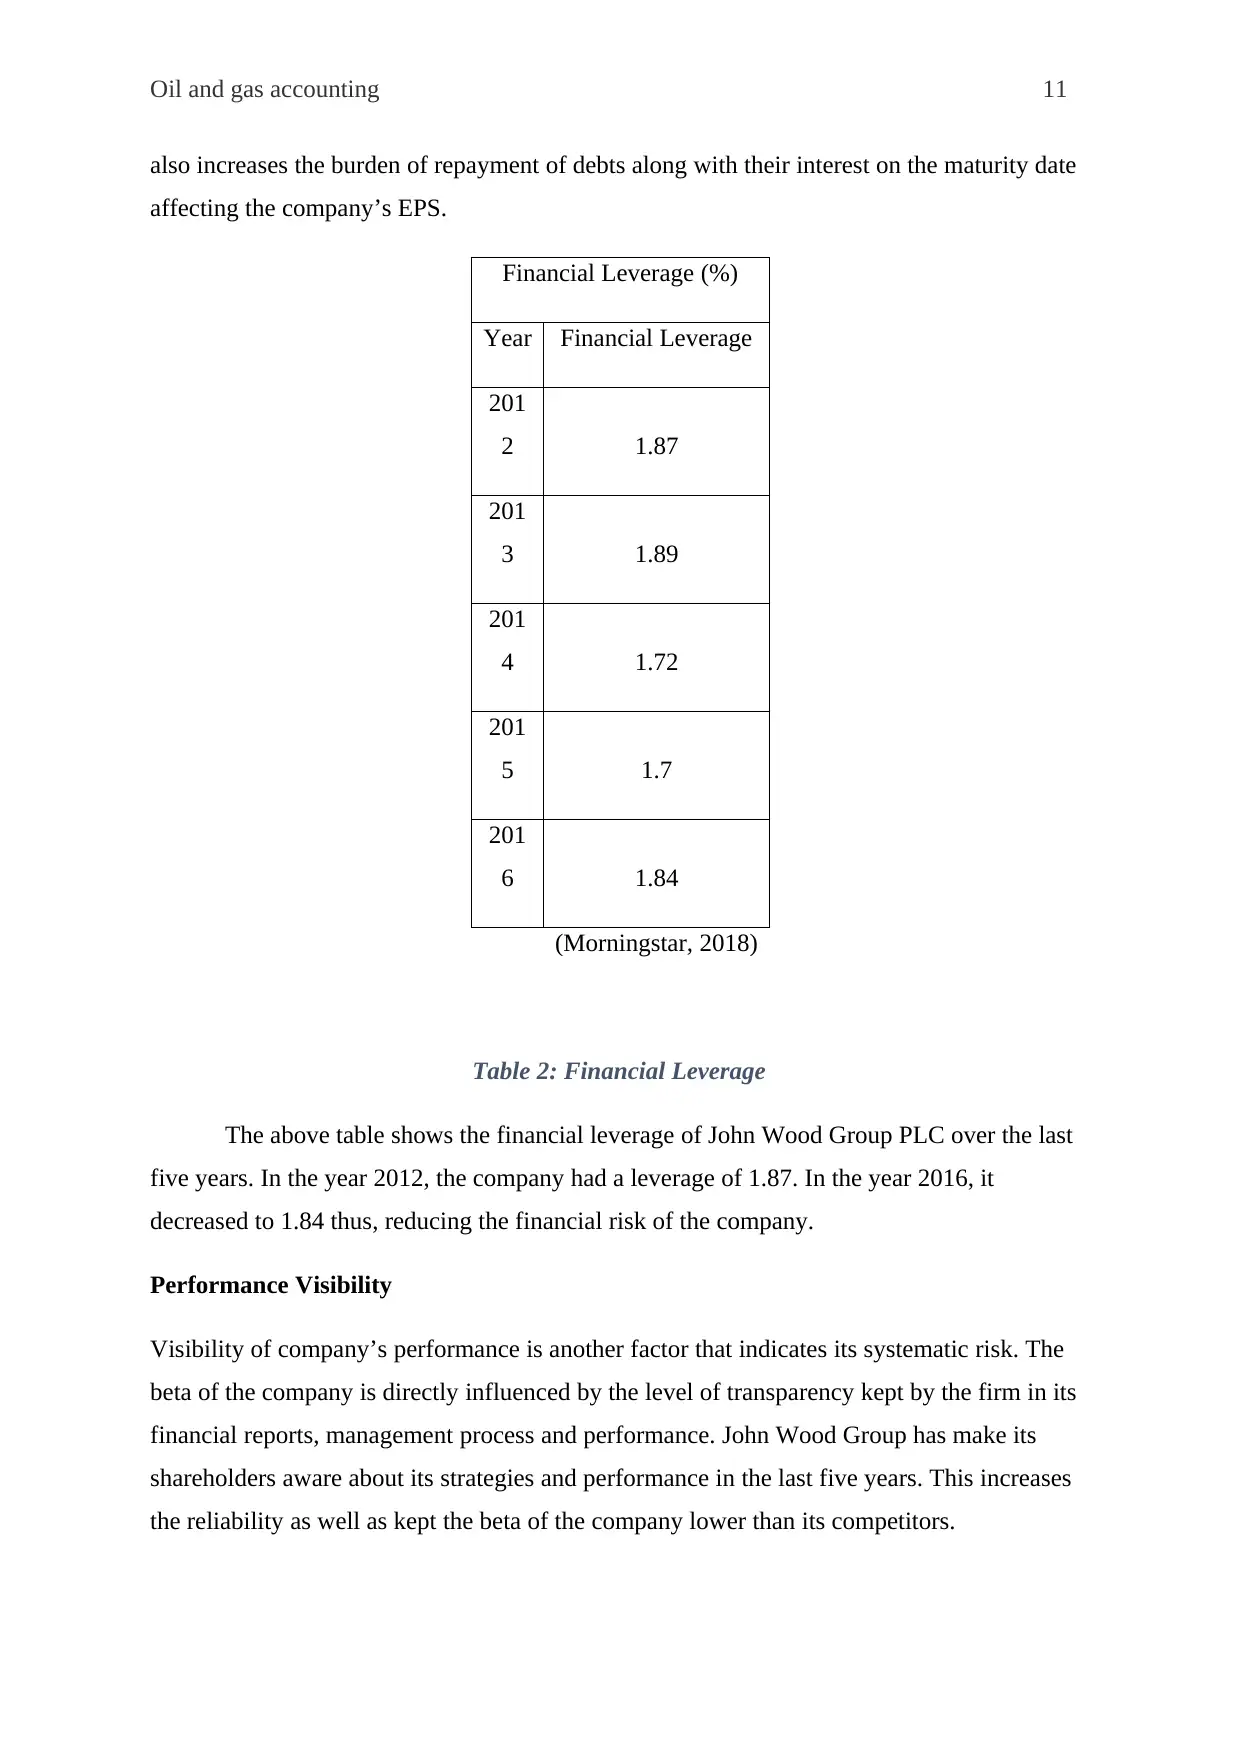
The above table shows the financial leverage of John Wood Group PLC over the last
five years. In the year 2012, the company had a leverage of 1.87. In the year 2016, it
decreased to 1.84 thus, reducing the financial risk of the company.
Performance Visibility
Visibility of company’s performance is another factor that indicates its systematic risk. The
beta of the company is directly influenced by the level of transparency kept by the firm in its
financial reports, management process and performance. John Wood Group has make its
shareholders aware about its strategies and performance in the last five years. This increases
the reliability as well as kept the beta of the company lower than its competitors.
also increases the burden of repayment of debts along with their interest on the maturity date
affecting the company’s EPS.
Financial Leverage (%)
Year Financial Leverage
201
2 1.87
201
3 1.89
201
4 1.72
201
5 1.7
201
6 1.84
(Morningstar, 2018)
Table 2: Financial Leverage
The above table shows the financial leverage of John Wood Group PLC over the last
five years. In the year 2012, the company had a leverage of 1.87. In the year 2016, it
decreased to 1.84 thus, reducing the financial risk of the company.
Performance Visibility
Visibility of company’s performance is another factor that indicates its systematic risk. The
beta of the company is directly influenced by the level of transparency kept by the firm in its
financial reports, management process and performance. John Wood Group has make its
shareholders aware about its strategies and performance in the last five years. This increases
the reliability as well as kept the beta of the company lower than its competitors.
⊘ This is a preview!⊘
Do you want full access?
Subscribe today to unlock all pages.
Trusted by 1+ million students worldwide
1 out of 29
Related Documents


Your All-in-One AI-Powered Toolkit for Academic Success.
+13062052269
info@desklib.com
Available 24*7 on WhatsApp / Email
![[object Object]](/_next/static/media/star-bottom.7253800d.svg)
Unlock your academic potential
Copyright © 2020–2026 A2Z Services. All Rights Reserved. Developed and managed by ZUCOL.