Econ 41-4140 Assignment 2: Correlograms and Time-Series Stationarity
VerifiedAdded on 2023/04/19
|5
|929
|100
Homework Assignment
AI Summary
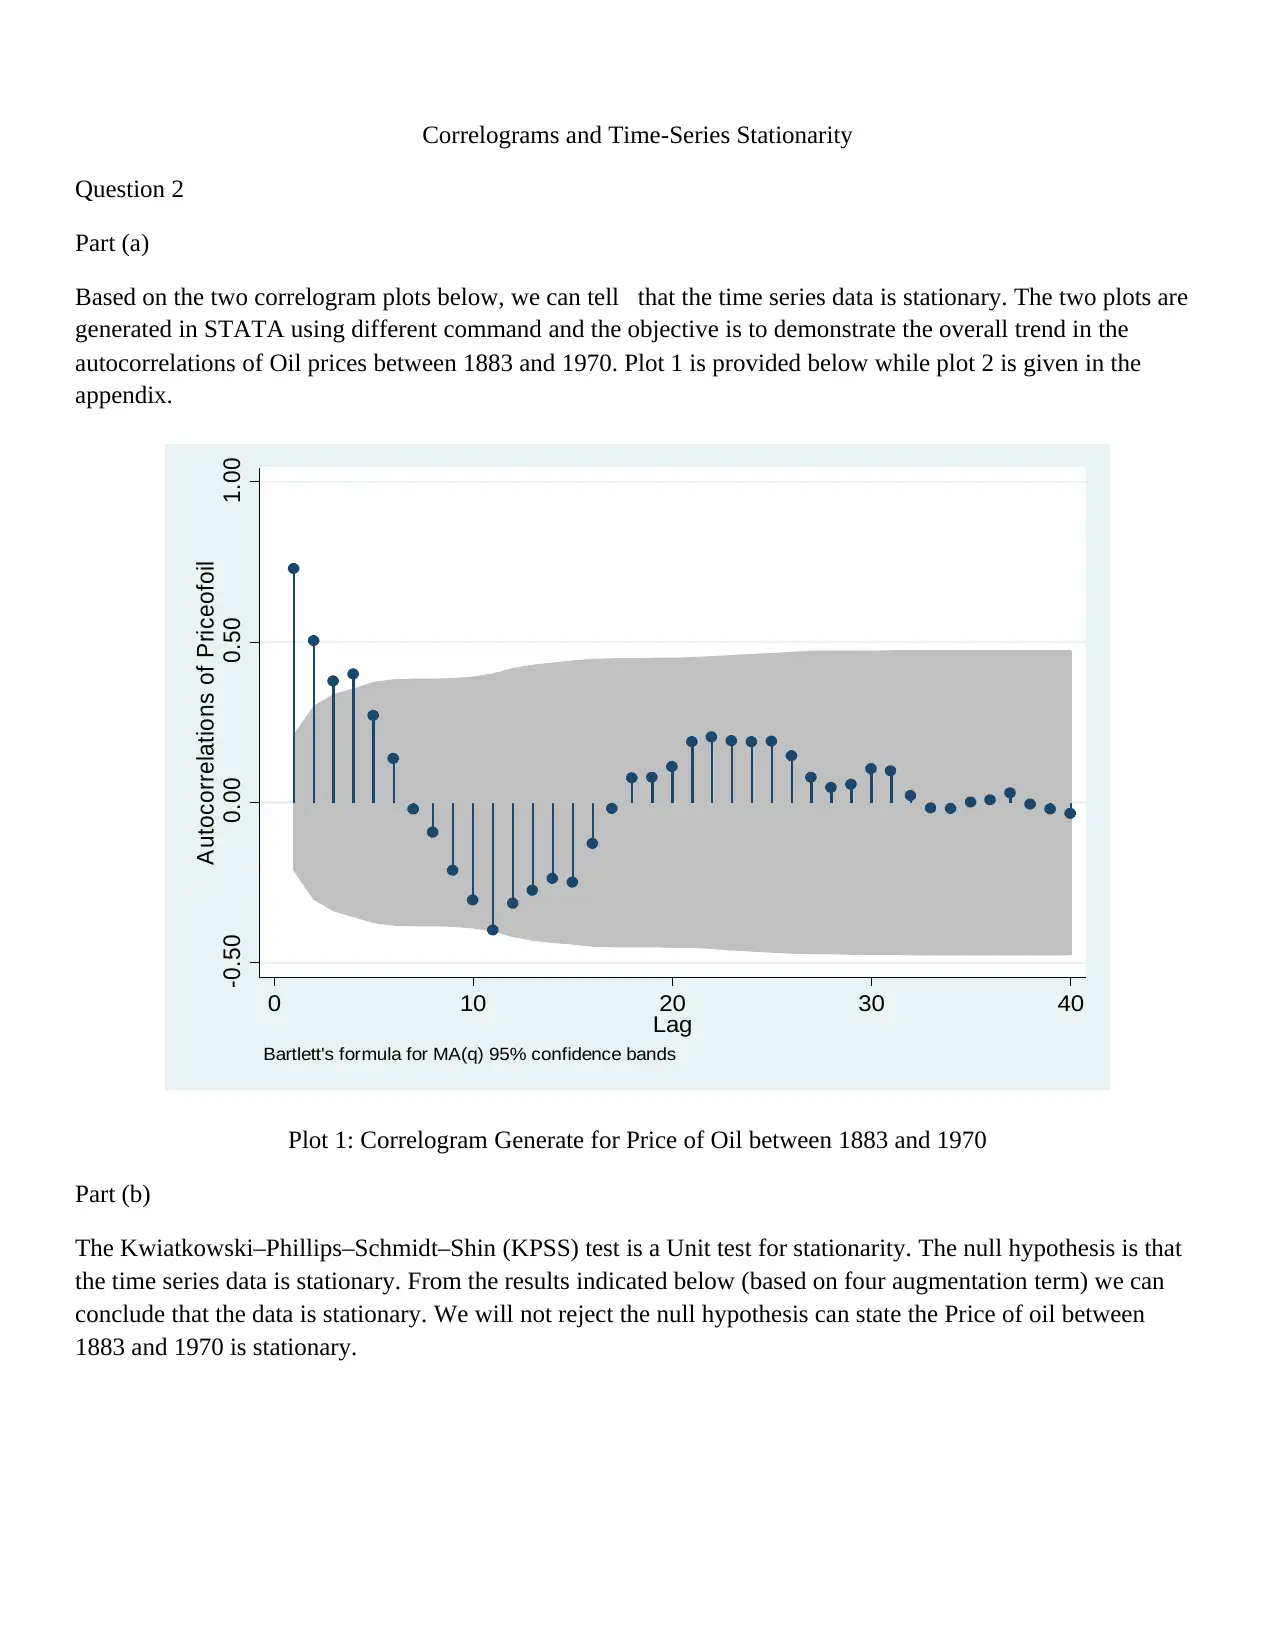
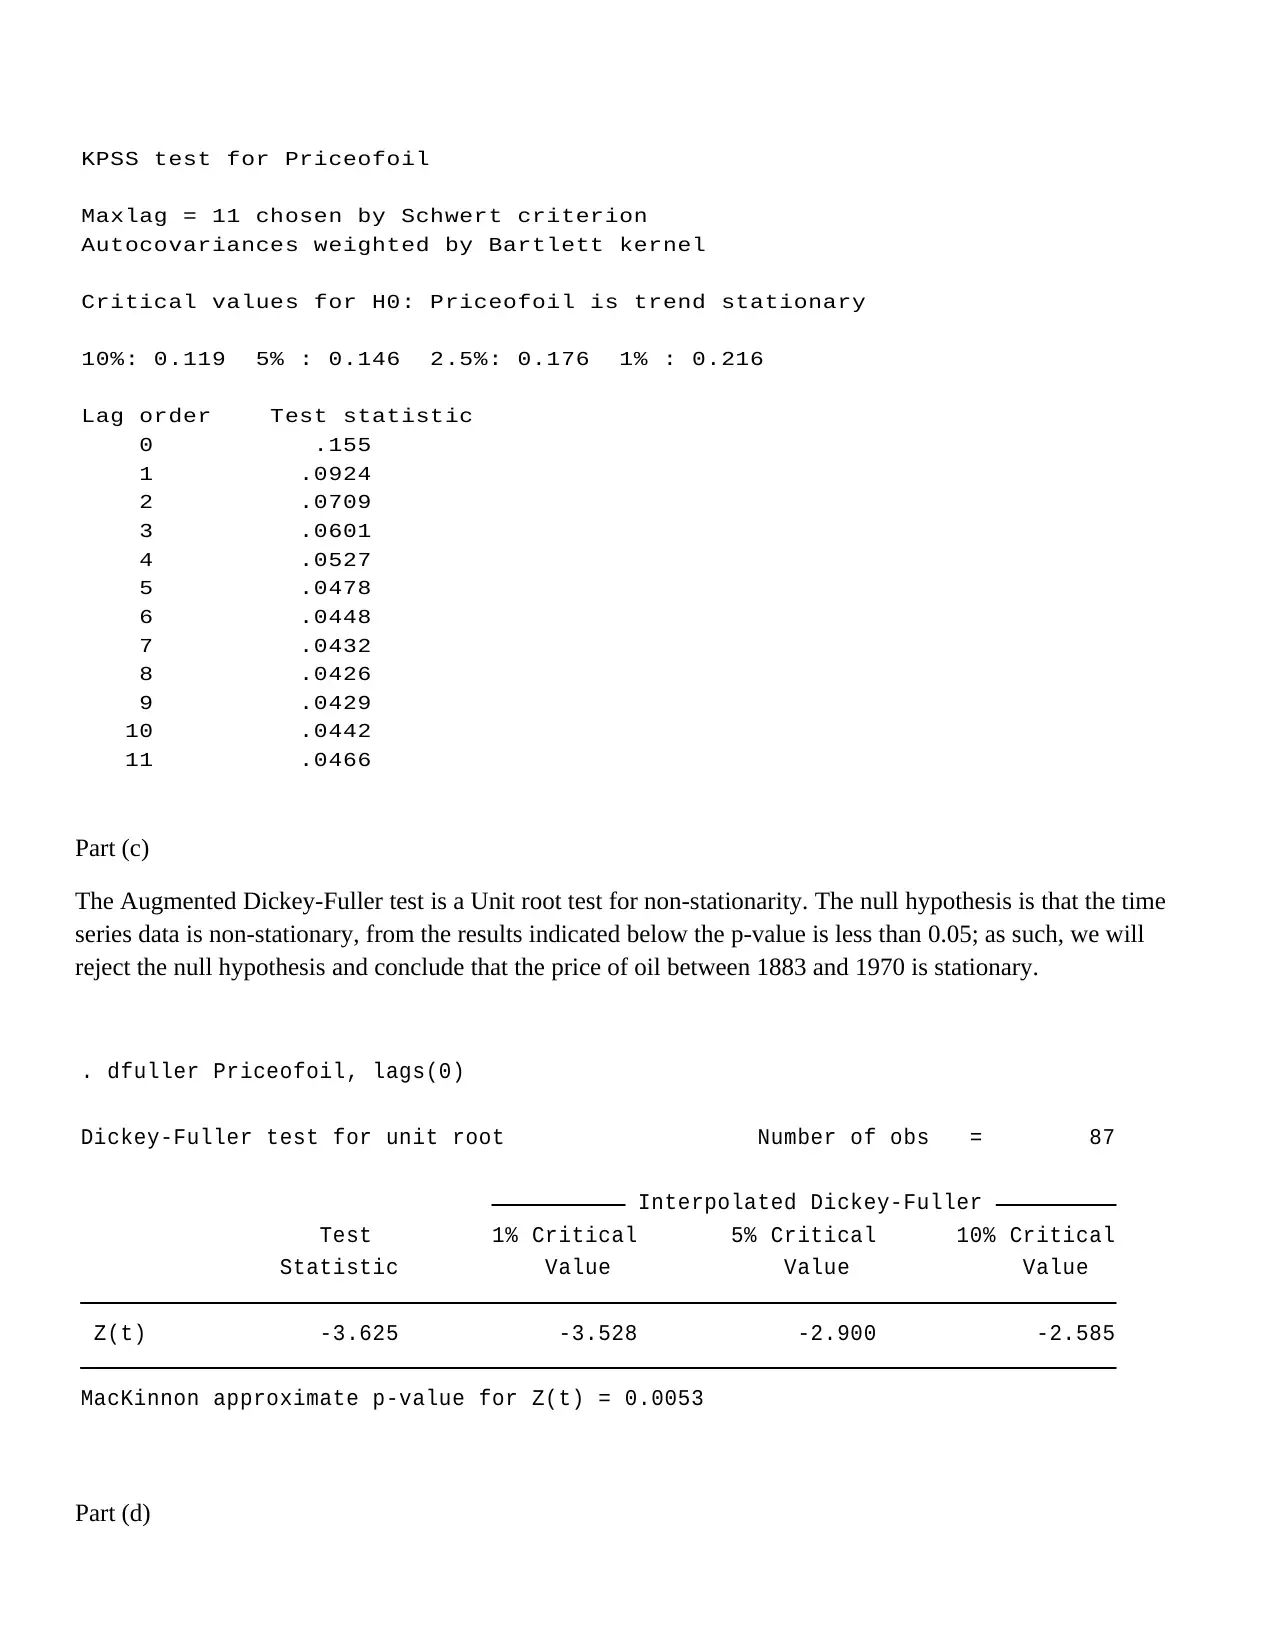
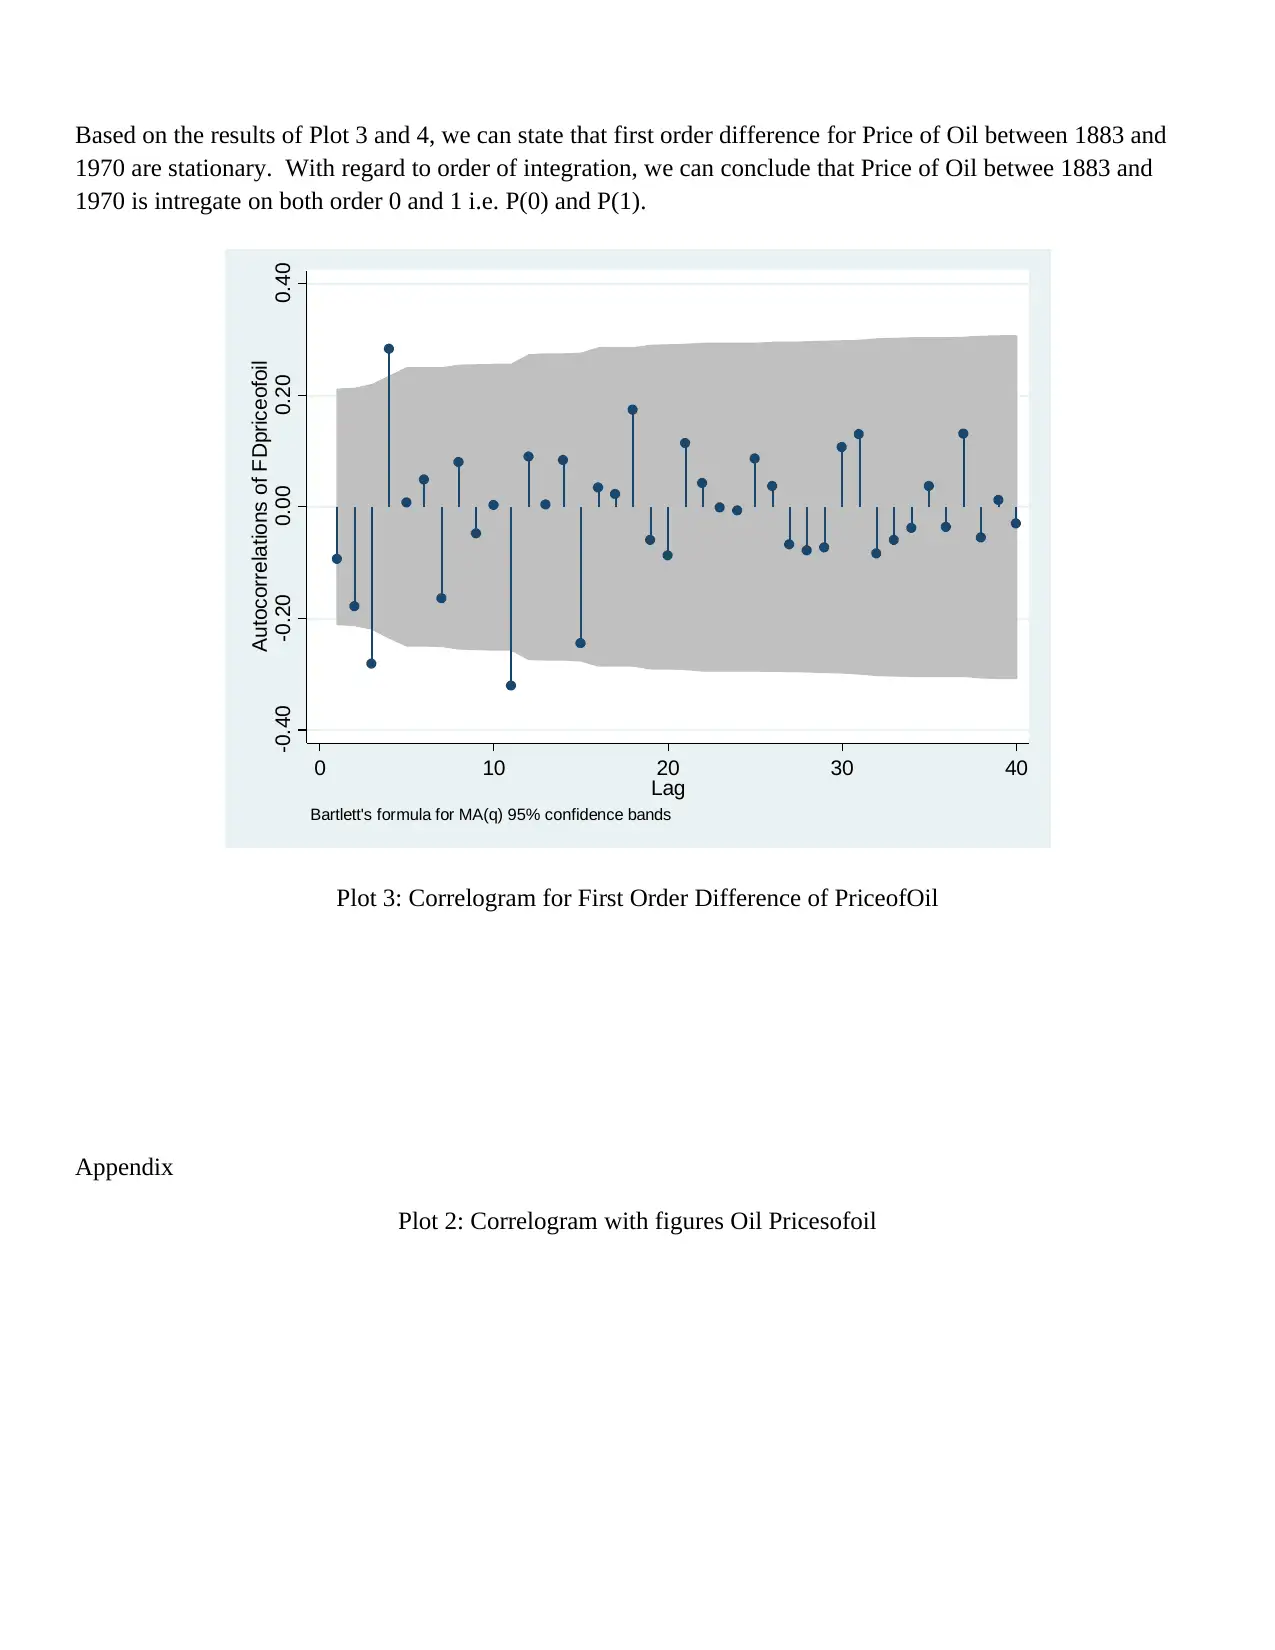
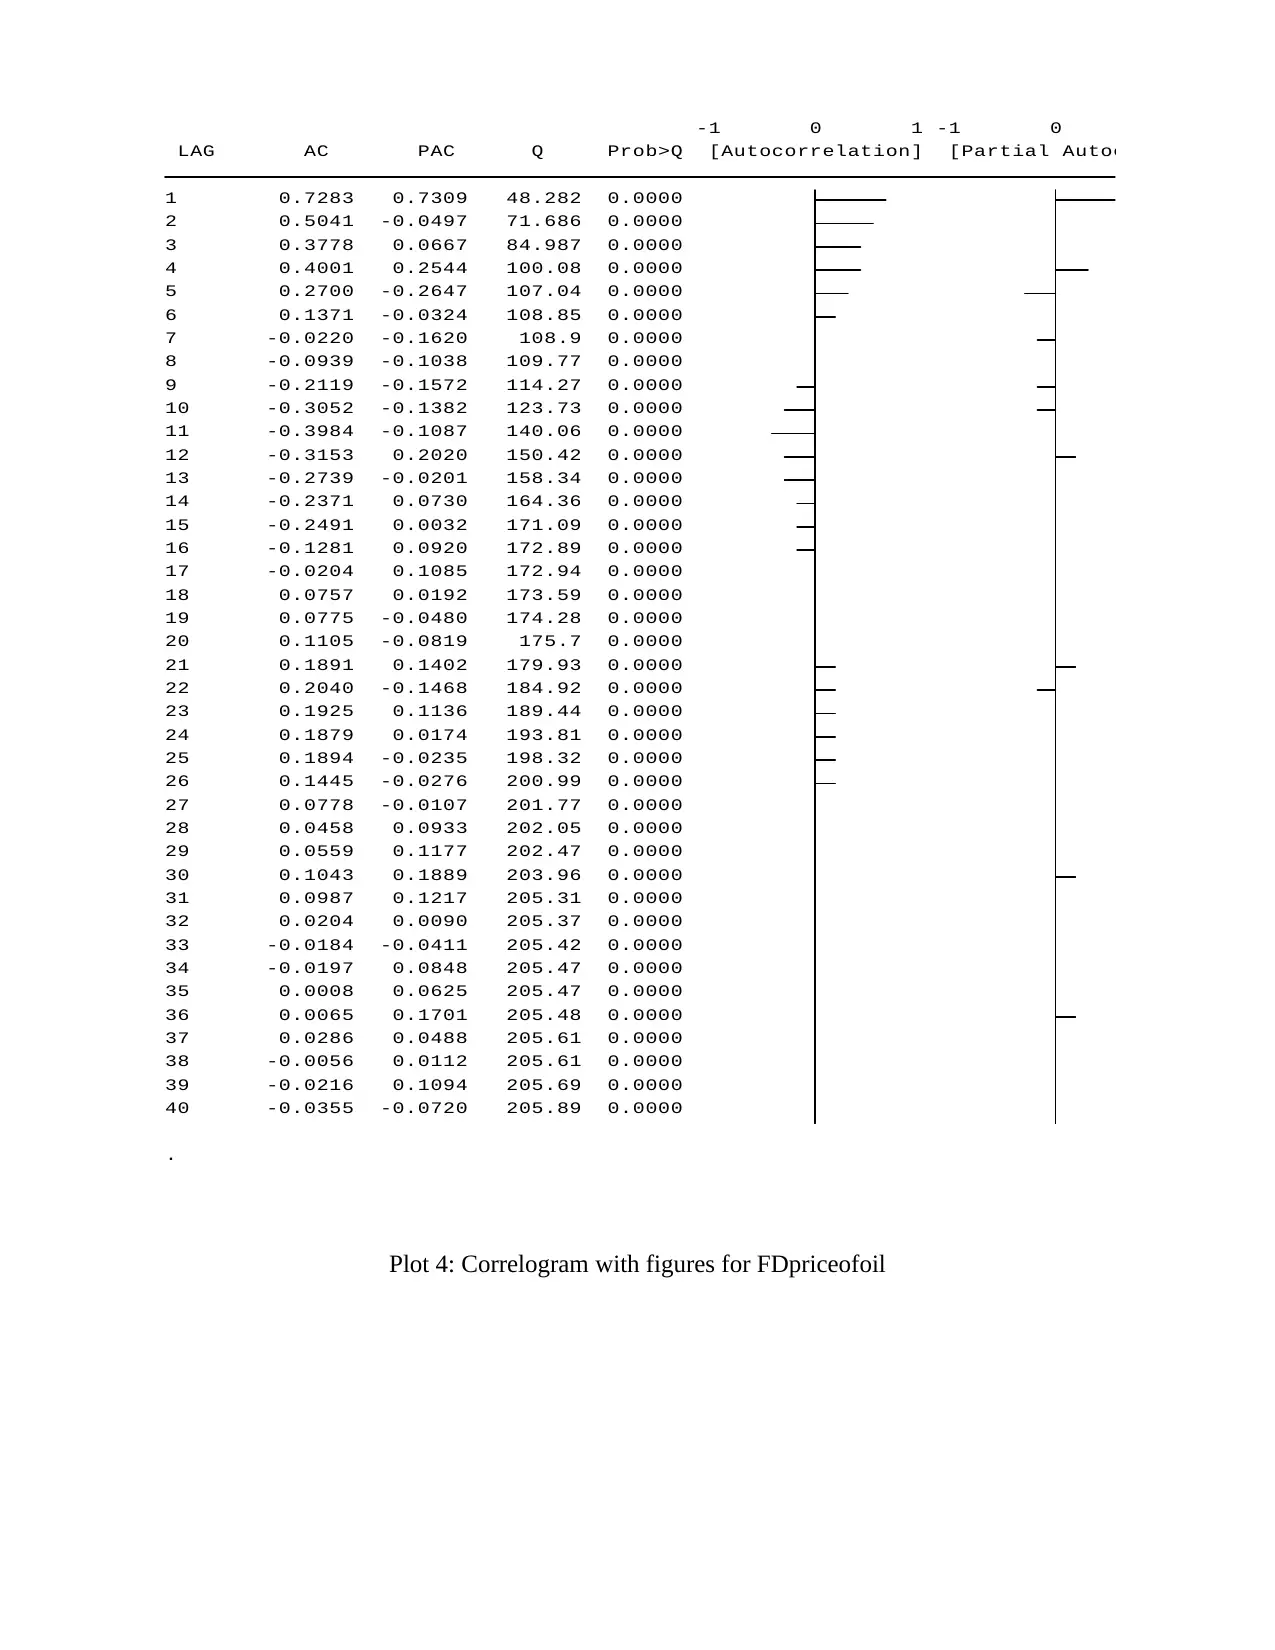
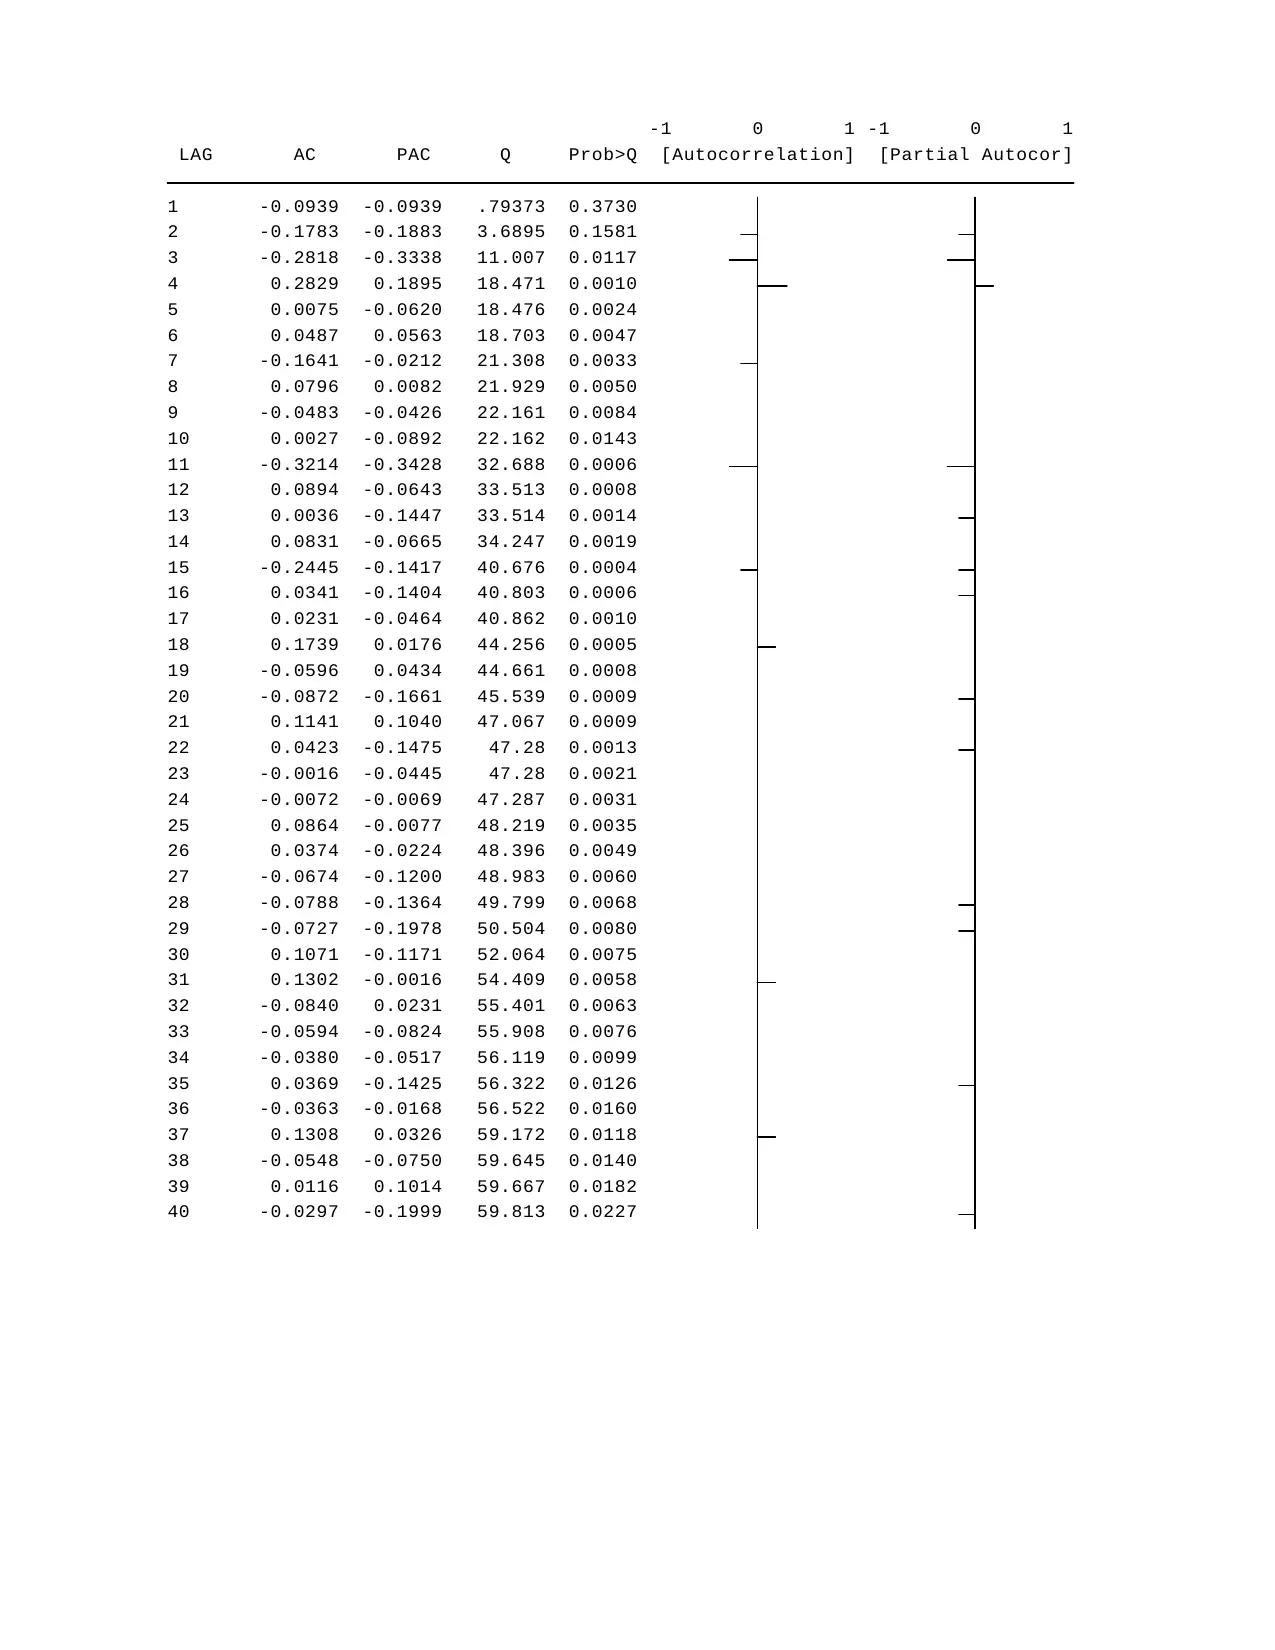
This assignment analyzes the stationarity of oil prices from 1883 to 1970. The analysis begins with visual inspection using correlograms, demonstrating the overall trend in autocorrelations of oil prices. Subsequently, the Kwiatkowski–Phillips–Schmidt–Shin (KPSS) test is employed, with the null hypothesis of stationarity being accepted. The Augmented Dickey-Fuller (ADF) test is then applied, and the null hypothesis of non-stationarity is rejected. The results from both tests, along with correlograms of the first-order difference, support the conclusion that the oil price time series is stationary and integrated of order zero and one. The assignment utilizes STATA to generate the plots and perform the statistical tests, providing a comprehensive examination of the time series properties of oil prices.
1 out of 5
Related Documents


Your All-in-One AI-Powered Toolkit for Academic Success.
+13062052269
info@desklib.com
Available 24*7 on WhatsApp / Email
![[object Object]](/_next/static/media/star-bottom.7253800d.svg)
Copyright © 2020–2026 A2Z Services. All Rights Reserved. Developed and managed by ZUCOL.