Financial Market Report: Top-Down Analysis of Energy Companies
VerifiedAdded on 2020/02/24
|19
|4871
|33
Report
AI Summary
This report provides a detailed financial analysis of Oil Search Ltd and Pan Pacific Petroleum, two major energy companies. It employs both top-down and bottom-up analysis to evaluate their performance within the dynamic economic environment. The report delves into the brief history, GDP, and investment strategies of both companies, examining their economic fundamentals and forecasting methods. It analyzes the impact of forecast changes on investment outcomes and includes statistical data, such as revenue and investment figures, to support the discussion. The report also includes recommendations to improve company operations and concludes with a summary of key findings and a list of references.

PRINCIPALS OF FINANCIAL MARKETS GROUP
Paraphrase This Document
Need a fresh take? Get an instant paraphrase of this document with our AI Paraphraser
Executive Summary
The following report is about the different aspects and parameters of a company’s operations that
are to be taken care of before making any investment in it. It has mentioned the Top-Down
Analysis and the Bottom-Up Analysis of two Energy Giants named Oil Search Ltd Australia and
Pan Pacific petroleum Australia. This part has described the brief history, GDP, and other
investments that have been made by various sectors and organizations in Oil Search Ltd and Pan
Pacific petroleum. The basic concept of Forecasting and its significances with the companies’
operations have been talked about in detail. Another important thing that has been included in the
Economic environment of these tow companies. The effect of variations made in forecast by
investors has been analyses and possible outcomes have been described. Finally, the report has
included some recommendations that can prove to be helpful in catapulting the company
operations.
2
Table of Contents
Introduction......................................................................................................................................4
Top-Down Analysis.........................................................................................................................4
Brief History of Oil search Ltd............................................................................................................4
Economic Environment of Oil search Ltd Australia.........................................................................5
Change of Forecast in Economic Fundamentals...............................................................................5
Gross Domestic Product of Oil search Ltd Australia...............................................................6
Profit and Losses in the recent years........................................................................................6
Investments made in Research and Development....................................................................7
Brief History of Pan Pacific petroleum..............................................................................................7
Economic Environment of Pan Pacific petroleum Australia...........................................................8
Change of Forecast in Economic Fundamentals...............................................................................9
Gross Domestic Product of Pan Pacific petroleum Australia...................................................9
The Profits and Losses in the recent years.............................................................................10
Investment made in Research and Development...................................................................11
Impact of Forecast Changes in the Economic Fundamentals of both companies........................11
Bottom-Up Analysis......................................................................................................................12
Oil search Ltd Australia.....................................................................................................................12
Pan Pacific petroleum Australia........................................................................................................12
Recommendations..........................................................................................................................13
Summary........................................................................................................................................13
References......................................................................................................................................15
3
⊘ This is a preview!⊘
Do you want full access?
Subscribe today to unlock all pages.
Trusted by 1+ million students worldwide
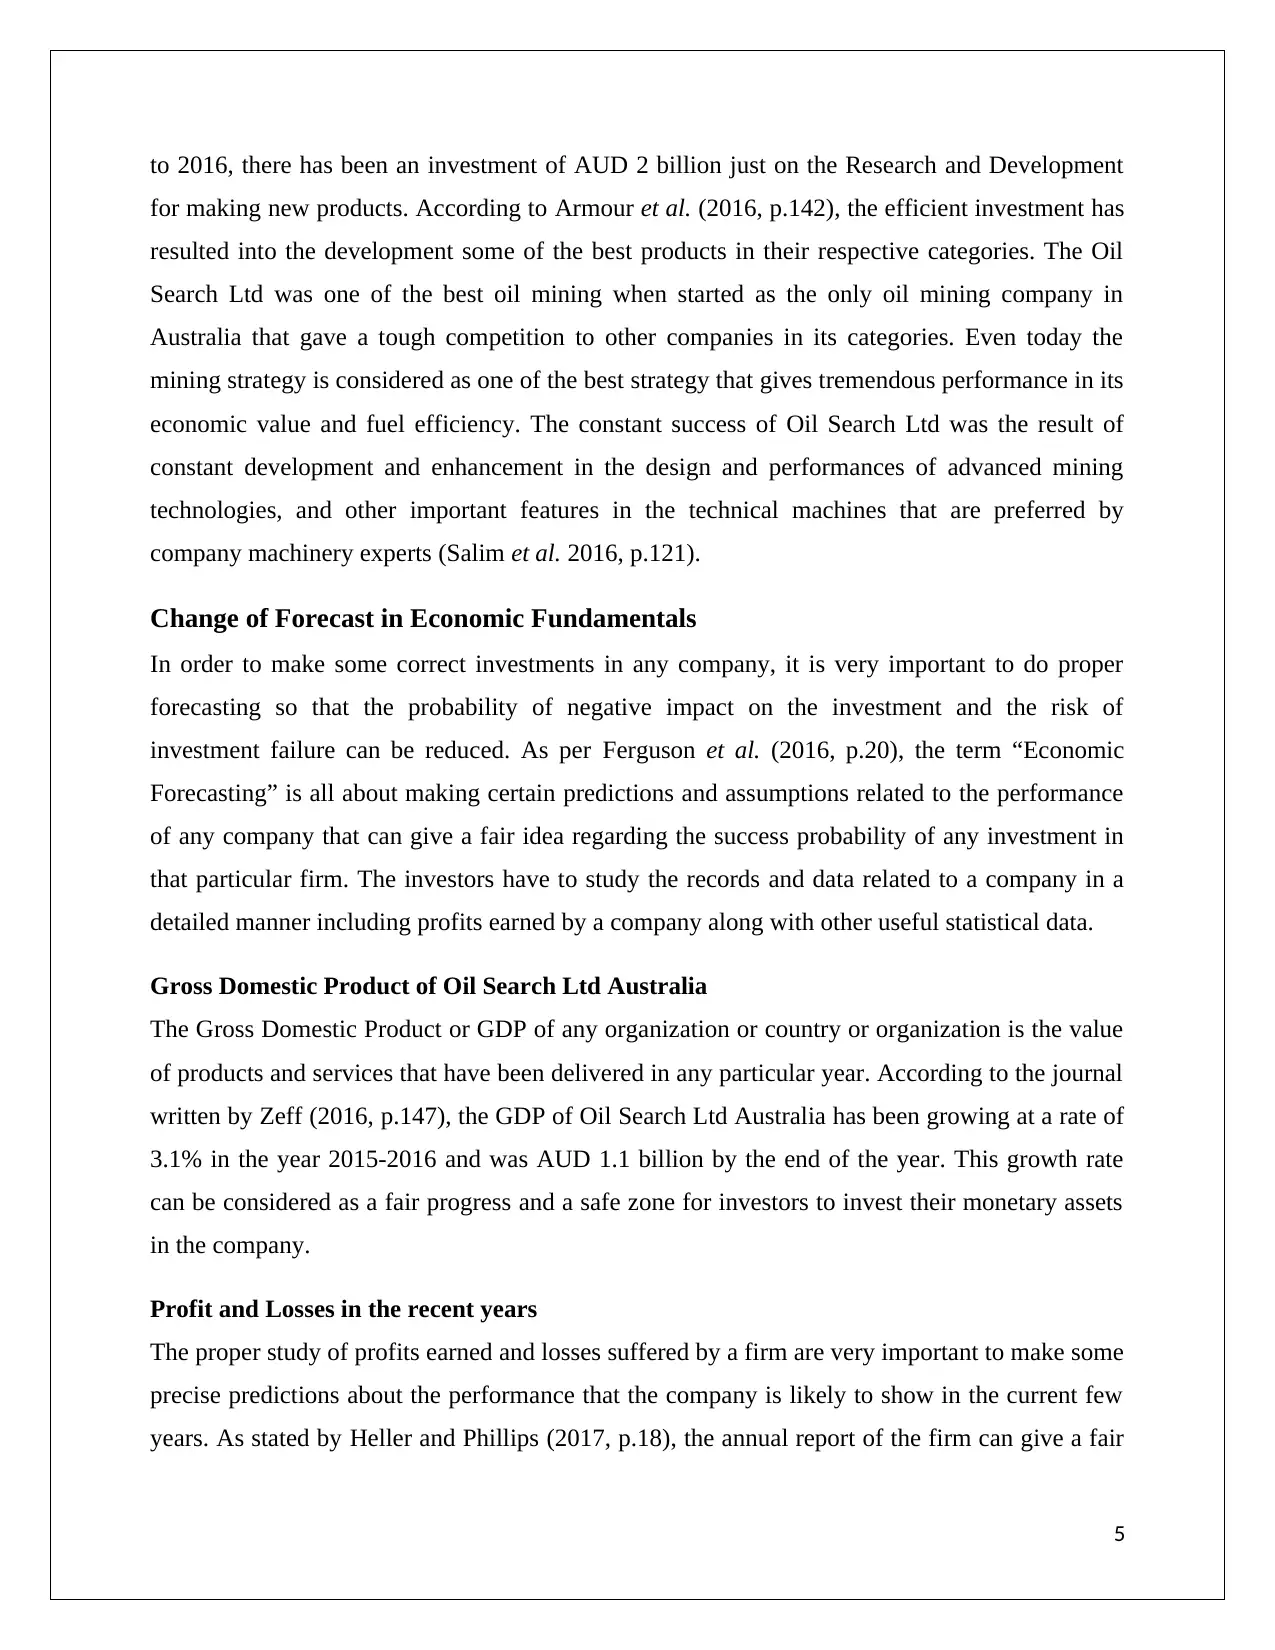
Introduction
In the modern market of dynamic economic conditions and competition, it is very difficult for
any organization to maintain the optimum pace of growth without the proper analysis of market
groups and implementing the marketing strategies accordingly and effectively. The report has
considered Oil Search Ltd Australia and Pan Pacific petroleum Australia. Despite having foreign
countries as origin, these two companies have been have given tough competition to each other
over time in terms of market stability, better design of motors, meeting customers’ demands and
certain other factors of performance. The report has included the top-down as well as bottom-up
analysis of these companies and has compared various things about both the Energy giants and
has included some statistical figures and calculations in order to support the discussion.
Top-Down Analysis
“Top-Down Analysis” means the method of analyzing the performance of any organization
starting from the top level of operations and calculations. According to Porter and Williams
(2016, p.126), Top-down Analysis is done mostly by the investors that are looking forward to
invest some of their funds in the company assets and market share of the companies.(Guenther et
al. 2017, p.16). Following are the detailed analysis of the Oil Search Ltd Australia Company in
terms of change in forecast in the economic fundamentals that can be highlighted by an investor
to make some investment in the organization.
Brief History of Oil Search Ltd
The Oil Search in the global Energy market is one of the leading Energy Company that was
established in Papua New Guinea in 1903. With its main headquarter located in Papua New
Guinea, the company has been successfully able to spread its business in different parts of the
world along with Australia. In the year 1925, the Oil Search Ltd administration founded Oil
Search Ltd Australia in Geelong, Victoria as a subsidiary of Oil Search Ltd Company
(Oilsearch.com, 2017).
Economic Environment of Oil Search Ltd Australia
The specialty of Australian based Oil Search Ltd subsidiary is that the investments have been
done in a very huge amount compared to any other subsidiary in a different country. From 2010
4
Paraphrase This Document
Need a fresh take? Get an instant paraphrase of this document with our AI Paraphraser
to 2016, there has been an investment of AUD 2 billion just on the Research and Development
for making new products. According to Armour et al. (2016, p.142), the efficient investment has
resulted into the development some of the best products in their respective categories. The Oil
Search Ltd was one of the best oil mining when started as the only oil mining company in
Australia that gave a tough competition to other companies in its categories. Even today the
mining strategy is considered as one of the best strategy that gives tremendous performance in its
economic value and fuel efficiency. The constant success of Oil Search Ltd was the result of
constant development and enhancement in the design and performances of advanced mining
technologies, and other important features in the technical machines that are preferred by
company machinery experts (Salim et al. 2016, p.121).
Change of Forecast in Economic Fundamentals
In order to make some correct investments in any company, it is very important to do proper
forecasting so that the probability of negative impact on the investment and the risk of
investment failure can be reduced. As per Ferguson et al. (2016, p.20), the term “Economic
Forecasting” is all about making certain predictions and assumptions related to the performance
of any company that can give a fair idea regarding the success probability of any investment in
that particular firm. The investors have to study the records and data related to a company in a
detailed manner including profits earned by a company along with other useful statistical data.
Gross Domestic Product of Oil Search Ltd Australia
The Gross Domestic Product or GDP of any organization or country or organization is the value
of products and services that have been delivered in any particular year. According to the journal
written by Zeff (2016, p.147), the GDP of Oil Search Ltd Australia has been growing at a rate of
3.1% in the year 2015-2016 and was AUD 1.1 billion by the end of the year. This growth rate
can be considered as a fair progress and a safe zone for investors to invest their monetary assets
in the company.
Profit and Losses in the recent years
The proper study of profits earned and losses suffered by a firm are very important to make some
precise predictions about the performance that the company is likely to show in the current few
years. As stated by Heller and Phillips (2017, p.18), the annual report of the firm can give a fair
5
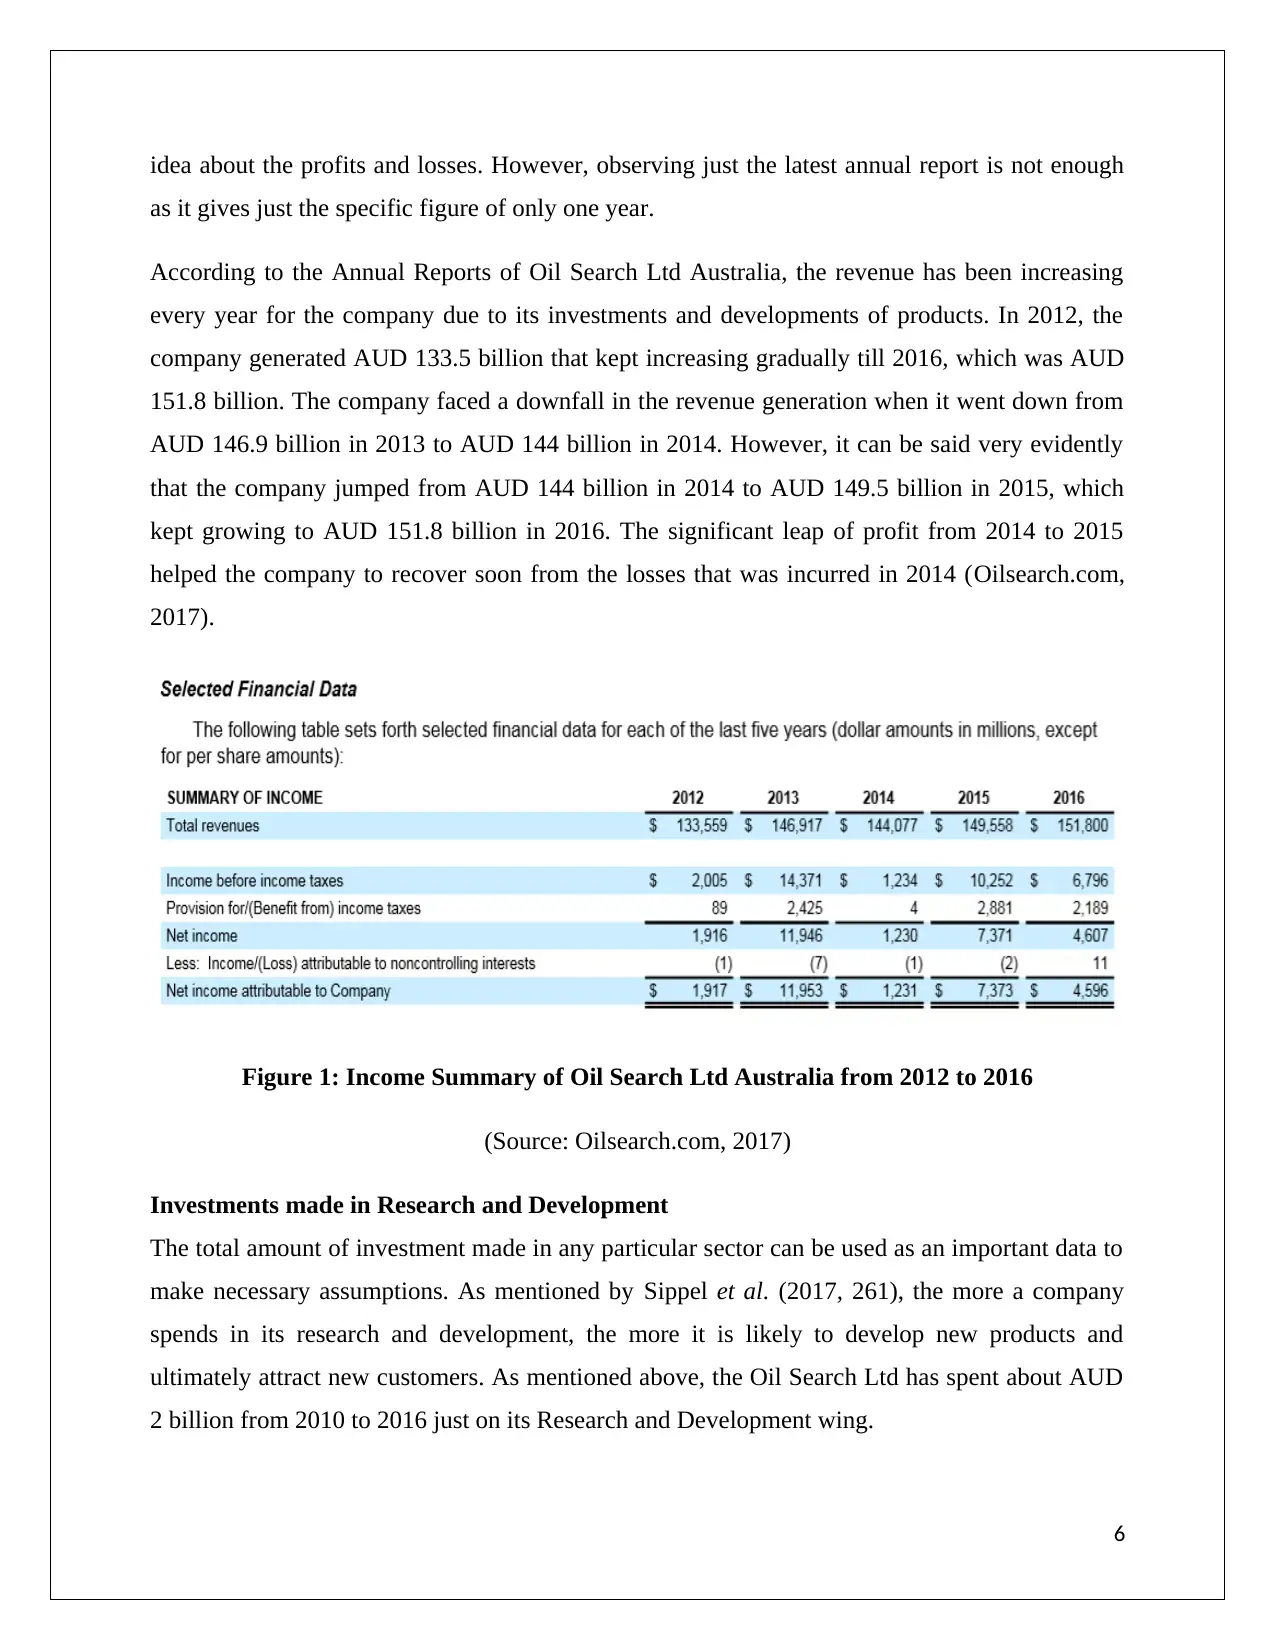
idea about the profits and losses. However, observing just the latest annual report is not enough
as it gives just the specific figure of only one year.
According to the Annual Reports of Oil Search Ltd Australia, the revenue has been increasing
every year for the company due to its investments and developments of products. In 2012, the
company generated AUD 133.5 billion that kept increasing gradually till 2016, which was AUD
151.8 billion. The company faced a downfall in the revenue generation when it went down from
AUD 146.9 billion in 2013 to AUD 144 billion in 2014. However, it can be said very evidently
that the company jumped from AUD 144 billion in 2014 to AUD 149.5 billion in 2015, which
kept growing to AUD 151.8 billion in 2016. The significant leap of profit from 2014 to 2015
helped the company to recover soon from the losses that was incurred in 2014 (Oilsearch.com,
2017).
Figure 1: Income Summary of Oil Search Ltd Australia from 2012 to 2016
(Source: Oilsearch.com, 2017)
Investments made in Research and Development
The total amount of investment made in any particular sector can be used as an important data to
make necessary assumptions. As mentioned by Sippel et al. (2017, 261), the more a company
spends in its research and development, the more it is likely to develop new products and
ultimately attract new customers. As mentioned above, the Oil Search Ltd has spent about AUD
2 billion from 2010 to 2016 just on its Research and Development wing.
6
⊘ This is a preview!⊘
Do you want full access?
Subscribe today to unlock all pages.
Trusted by 1+ million students worldwide
The huge investments have resulted into the design, development and ultimately, the launch of
new products in the Energy market. Hence, it can be said that the investment in Oil search Ltd
can lead to some good profit if the investment is made for several years. As described by Sain et
al. (2016, p.102), the Oil Search Ltd company has been known for its tough selection procedure
for various posts in the organization. Therefore, the presence of some great minds cannot be
denied in the company.
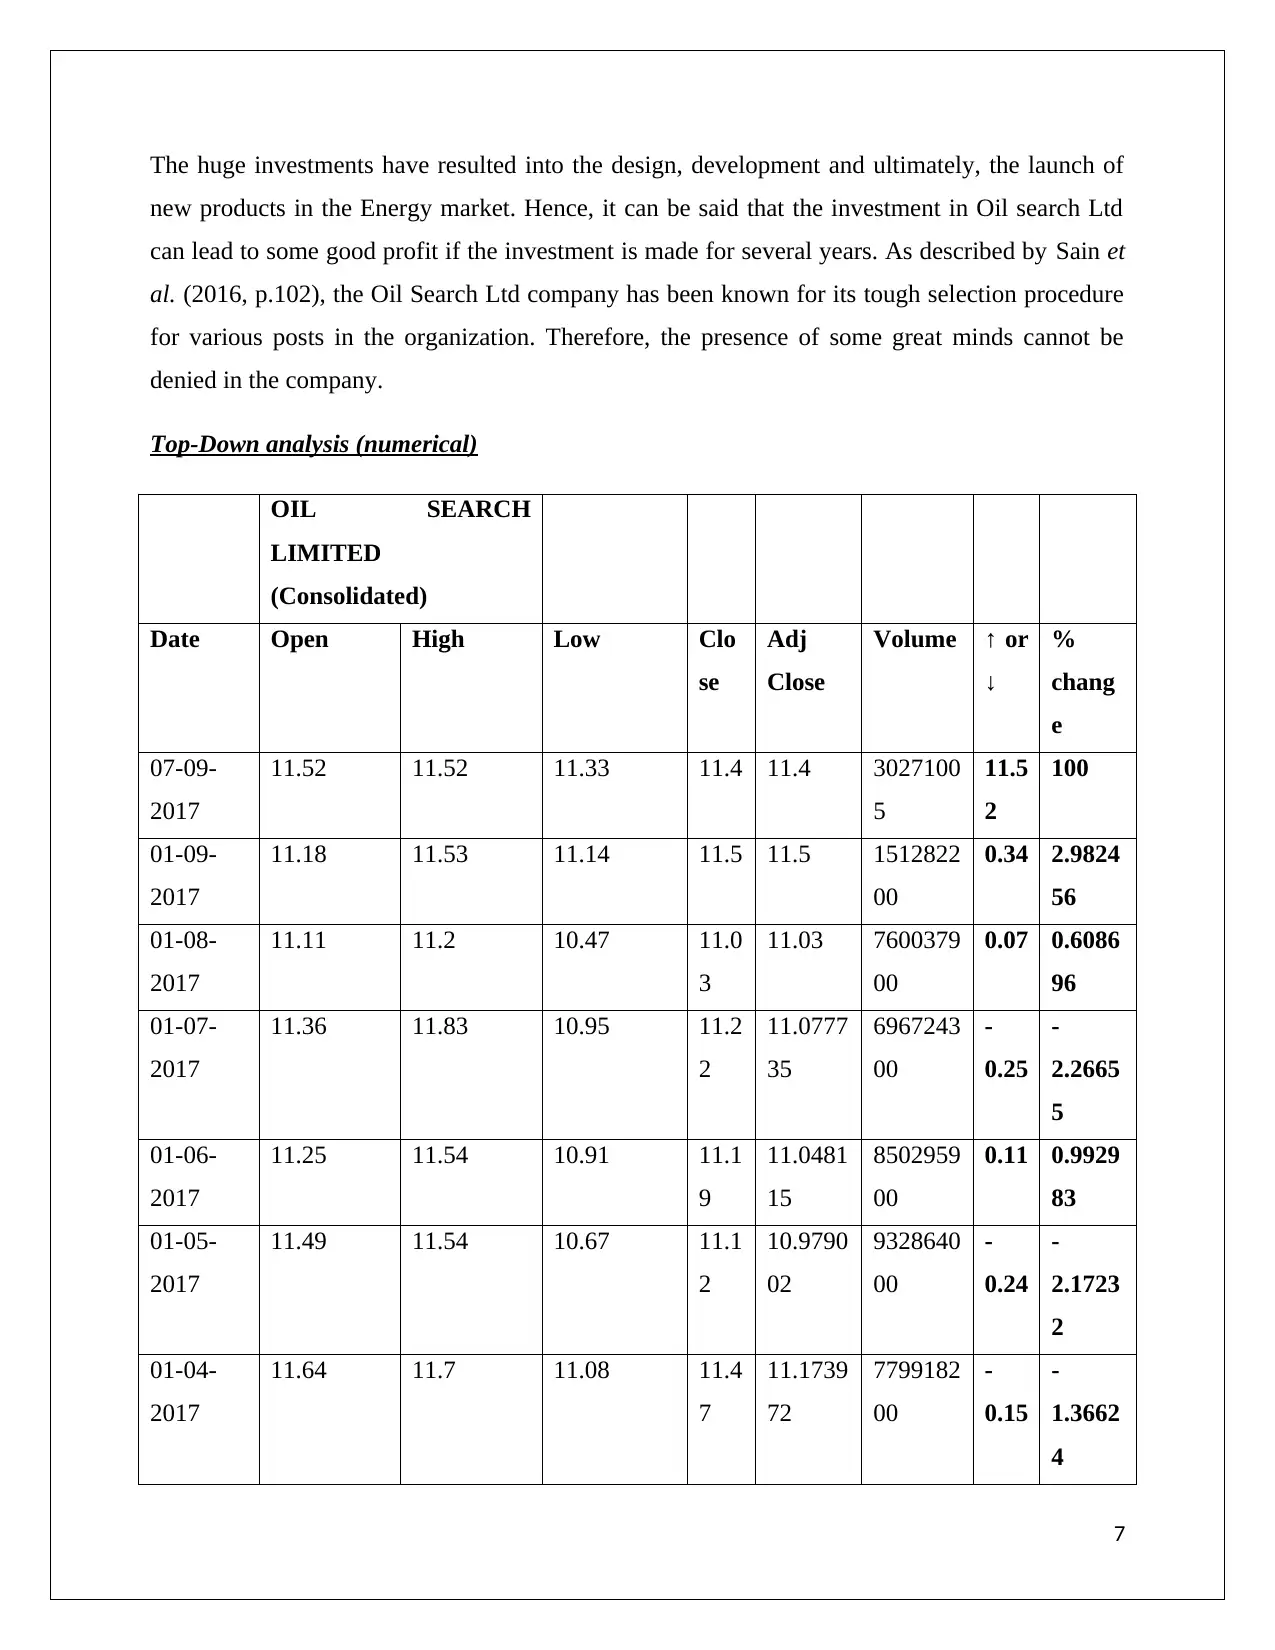
Top-Down analysis (numerical)
OIL SEARCH
LIMITED
(Consolidated)
Date Open High Low Clo
se
Adj
Close
Volume ↑ or
↓
%
chang
e
07-09-
2017
11.52 11.52 11.33 11.4 11.4 3027100
5
11.5
2
100
01-09-
2017
11.18 11.53 11.14 11.5 11.5 1512822
00
0.34 2.9824
56
01-08-
2017
11.11 11.2 10.47 11.0
3
11.03 7600379
00
0.07 0.6086
96
01-07-
2017
11.36 11.83 10.95 11.2
2
11.0777
35
6967243
00
-
0.25
-
2.2665
5
01-06-
2017
11.25 11.54 10.91 11.1
9
11.0481
15
8502959
00
0.11 0.9929
83
01-05-
2017
11.49 11.54 10.67 11.1
2
10.9790
02
9328640
00
-
0.24
-
2.1723
2
01-04-
2017
11.64 11.7 11.08 11.4
7
11.1739
72
7799182
00
-
0.15
-
1.3662
4
7
new products in the Energy market. Hence, it can be said that the investment in Oil search Ltd
can lead to some good profit if the investment is made for several years. As described by Sain et
al. (2016, p.102), the Oil Search Ltd company has been known for its tough selection procedure
for various posts in the organization. Therefore, the presence of some great minds cannot be
denied in the company.
Top-Down analysis (numerical)
OIL SEARCH
LIMITED
(Consolidated)
Date Open High Low Clo
se
Adj
Close
Volume ↑ or
↓
%
chang
e
07-09-
2017
11.52 11.52 11.33 11.4 11.4 3027100
5
11.5
2
100
01-09-
2017
11.18 11.53 11.14 11.5 11.5 1512822
00
0.34 2.9824
56
01-08-
2017
11.11 11.2 10.47 11.0
3
11.03 7600379
00
0.07 0.6086
96
01-07-
2017
11.36 11.83 10.95 11.2
2
11.0777
35
6967243
00
-
0.25
-
2.2665
5
01-06-
2017
11.25 11.54 10.91 11.1
9
11.0481
15
8502959
00
0.11 0.9929
83
01-05-
2017
11.49 11.54 10.67 11.1
2
10.9790
02
9328640
00
-
0.24
-
2.1723
2
01-04-
2017
11.64 11.7 11.08 11.4
7
11.1739
72
7799182
00
-
0.15
-
1.3662
4
7
Paraphrase This Document
Need a fresh take? Get an instant paraphrase of this document with our AI Paraphraser
01-03-
2017
12.66 12.75 11.41 11.6
4
11.3395
85
9524957
00
-
1.02
-
9.1283
6
01-02-
2017
12.45 12.77 12.22 12.5
3
12.2066
14
5861737
00
0.21 1.8519
2
01-01-
2017
12.2 13.27 12.13 12.3
6
11.8500
26
8795092
00
0.25 2.0480
7
01-12-
2016
12.23 13.2 12.08 12.1
3
11.6295
16
7091584
00
-
0.03
-
0.2531
6
01-11-
2016
11.78 12.5 11.07 11.9
6
11.4665
31
7366905
00
0.45 3.8694
65
01-10-
2016
12.06 12.53 11.6 11.7
4
11.1171
05
6576896
00
-
0.28
-
2.4418
9
01-09-
2016
null null null null null null null null
Table 1: Top-Down analysis
(Source: Created by author)
Brief History of Pan Pacific petroleum
Pan Pacific petroleum is an Australia based Energy Company that produces one of the most
preferred products by fuel movers and transporters around the world. The company was
established in 1937 in Australia and it also established its business in Australia in the same year.
Headquartered in Tokyo, Australia the company operates its business from numerous parts of the
world including Australia. Currently, there are almost 400,000 people that are working with Pan
Pacific petroleum. The company exports its fuel in about 170 countries and is known for
manufacturing some of the most efficient products in the world (Panpacpetroleum.com.au,
2017).
8
2017
12.66 12.75 11.41 11.6
4
11.3395
85
9524957
00
-
1.02
-
9.1283
6
01-02-
2017
12.45 12.77 12.22 12.5
3
12.2066
14
5861737
00
0.21 1.8519
2
01-01-
2017
12.2 13.27 12.13 12.3
6
11.8500
26
8795092
00
0.25 2.0480
7
01-12-
2016
12.23 13.2 12.08 12.1
3
11.6295
16
7091584
00
-
0.03
-
0.2531
6
01-11-
2016
11.78 12.5 11.07 11.9
6
11.4665
31
7366905
00
0.45 3.8694
65
01-10-
2016
12.06 12.53 11.6 11.7
4
11.1171
05
6576896
00
-
0.28
-
2.4418
9
01-09-
2016
null null null null null null null null
Table 1: Top-Down analysis
(Source: Created by author)
Brief History of Pan Pacific petroleum
Pan Pacific petroleum is an Australia based Energy Company that produces one of the most
preferred products by fuel movers and transporters around the world. The company was
established in 1937 in Australia and it also established its business in Australia in the same year.
Headquartered in Tokyo, Australia the company operates its business from numerous parts of the
world including Australia. Currently, there are almost 400,000 people that are working with Pan
Pacific petroleum. The company exports its fuel in about 170 countries and is known for
manufacturing some of the most efficient products in the world (Panpacpetroleum.com.au,
2017).
8
Economic Environment of Pan Pacific petroleum Australia
The economic condition of Pan Pacific petroleum was not very good in the initial days.
However, the extensive research and development that were carried out in different plants by
some very creative engineers resulted into the exponential growth of this organization all around
the world. As per Masciandaro and Quintyn (2016, p.994), more than 40 countries use Pan
Pacific petroleum delivered products for their country’s daily purposes. This is because the Pan
Pacific petroleum produces very strong and efficient oil products and biproducts that can operate
in extremely tough conditions. In addition to this, the firm is also known for mining, refining and
furnishing petroleum with some very creative and unique quality.
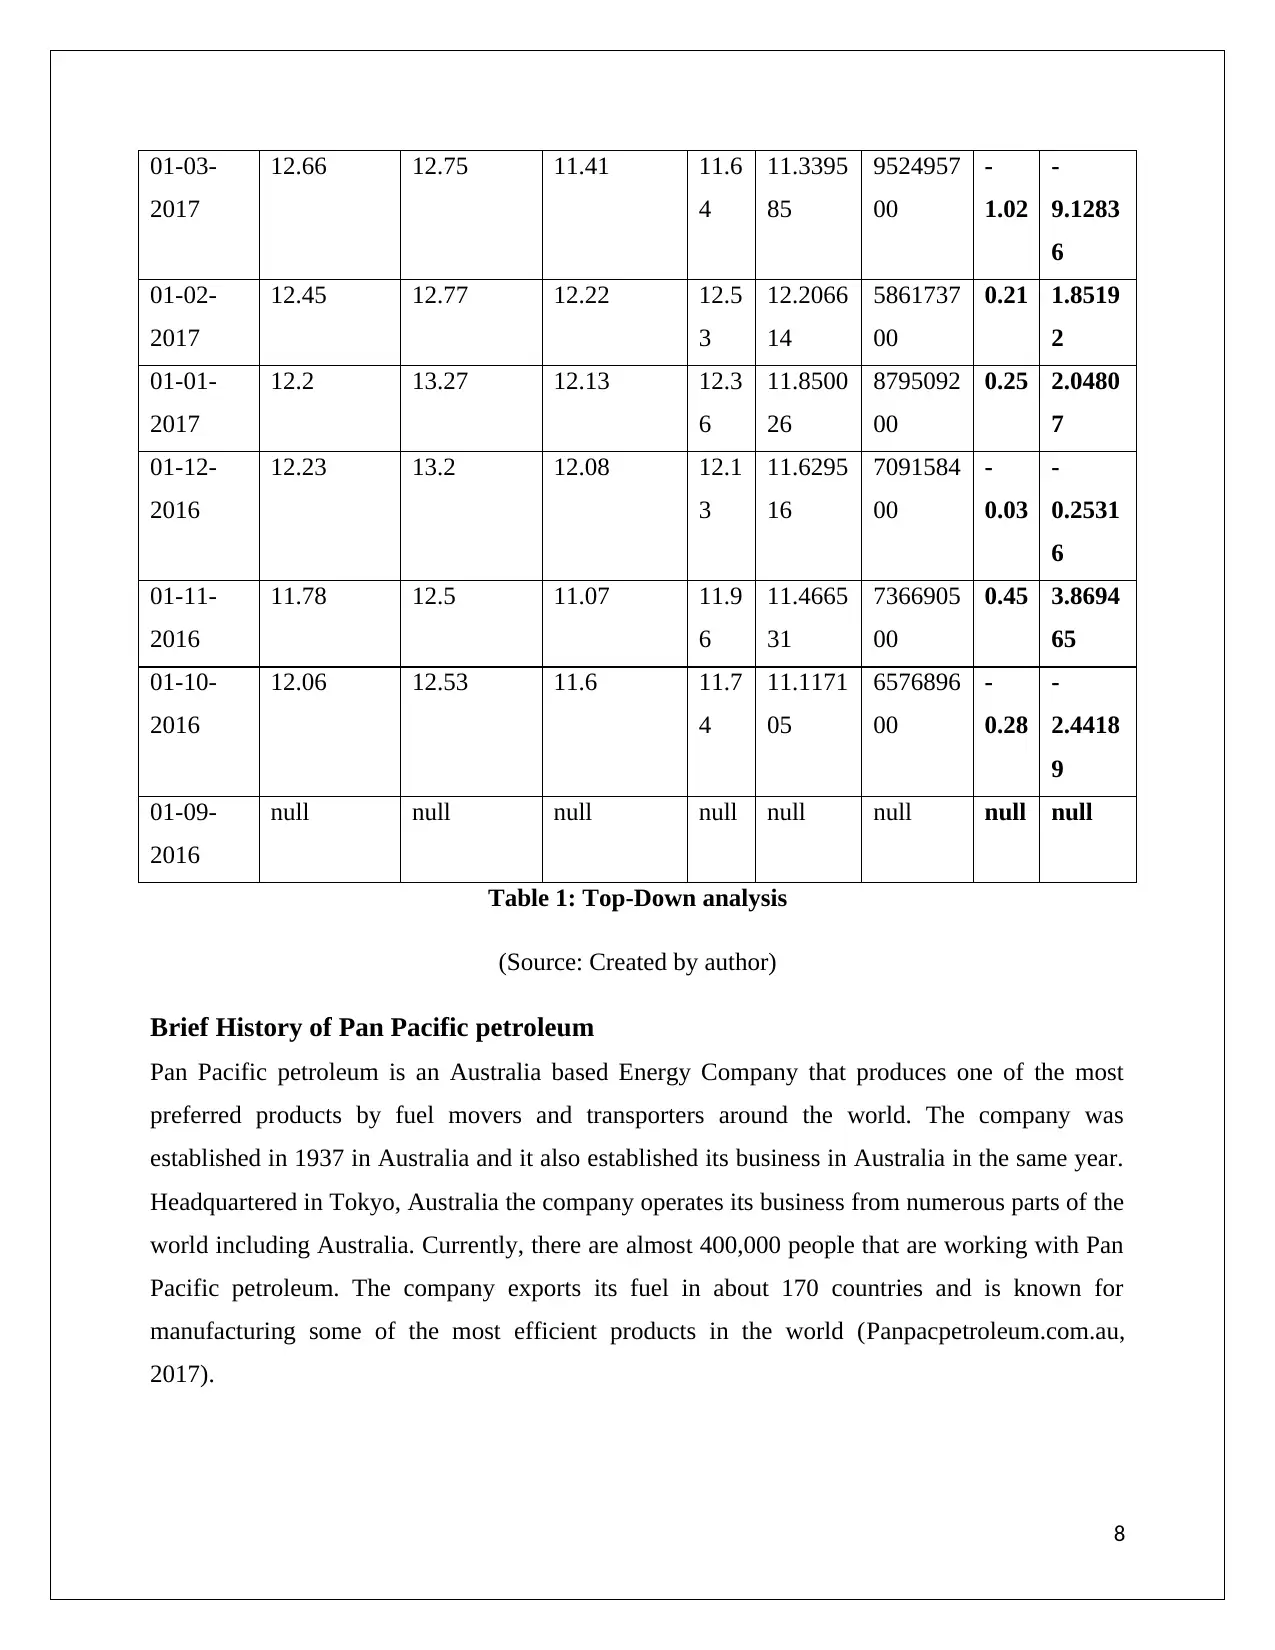
The organization has one of its biggest manufacturing plants at Altona. Cummings and Durrani
(2016, p.31) have stated about this plant in their journal saying that this plant is dedicated to
manufacture Low Lead fuel and Aurion Products of Pan Pacific. Low Lead Fuel is considered
one of the best productions of Pan Pacific petroleum by many vehicle experts around the globe.
The number of products manufactured at and exported from Altona plant in the financial year
2015-2016 were 95,204 million gallons and 64,605 million gallons respectively
(Panpacpetroleum.com.au, 2017).
Figure 2: Amount of Oil extracted at and exported from 2011 to 2016 (in million Gallons)
9
The economic condition of Pan Pacific petroleum was not very good in the initial days.
However, the extensive research and development that were carried out in different plants by
some very creative engineers resulted into the exponential growth of this organization all around
the world. As per Masciandaro and Quintyn (2016, p.994), more than 40 countries use Pan
Pacific petroleum delivered products for their country’s daily purposes. This is because the Pan
Pacific petroleum produces very strong and efficient oil products and biproducts that can operate
in extremely tough conditions. In addition to this, the firm is also known for mining, refining and
furnishing petroleum with some very creative and unique quality.
The organization has one of its biggest manufacturing plants at Altona. Cummings and Durrani
(2016, p.31) have stated about this plant in their journal saying that this plant is dedicated to
manufacture Low Lead fuel and Aurion Products of Pan Pacific. Low Lead Fuel is considered
one of the best productions of Pan Pacific petroleum by many vehicle experts around the globe.
The number of products manufactured at and exported from Altona plant in the financial year
2015-2016 were 95,204 million gallons and 64,605 million gallons respectively
(Panpacpetroleum.com.au, 2017).
Figure 2: Amount of Oil extracted at and exported from 2011 to 2016 (in million Gallons)
9
⊘ This is a preview!⊘
Do you want full access?
Subscribe today to unlock all pages.
Trusted by 1+ million students worldwide
(Source: Panpacpetroleum.com.au, 2017)
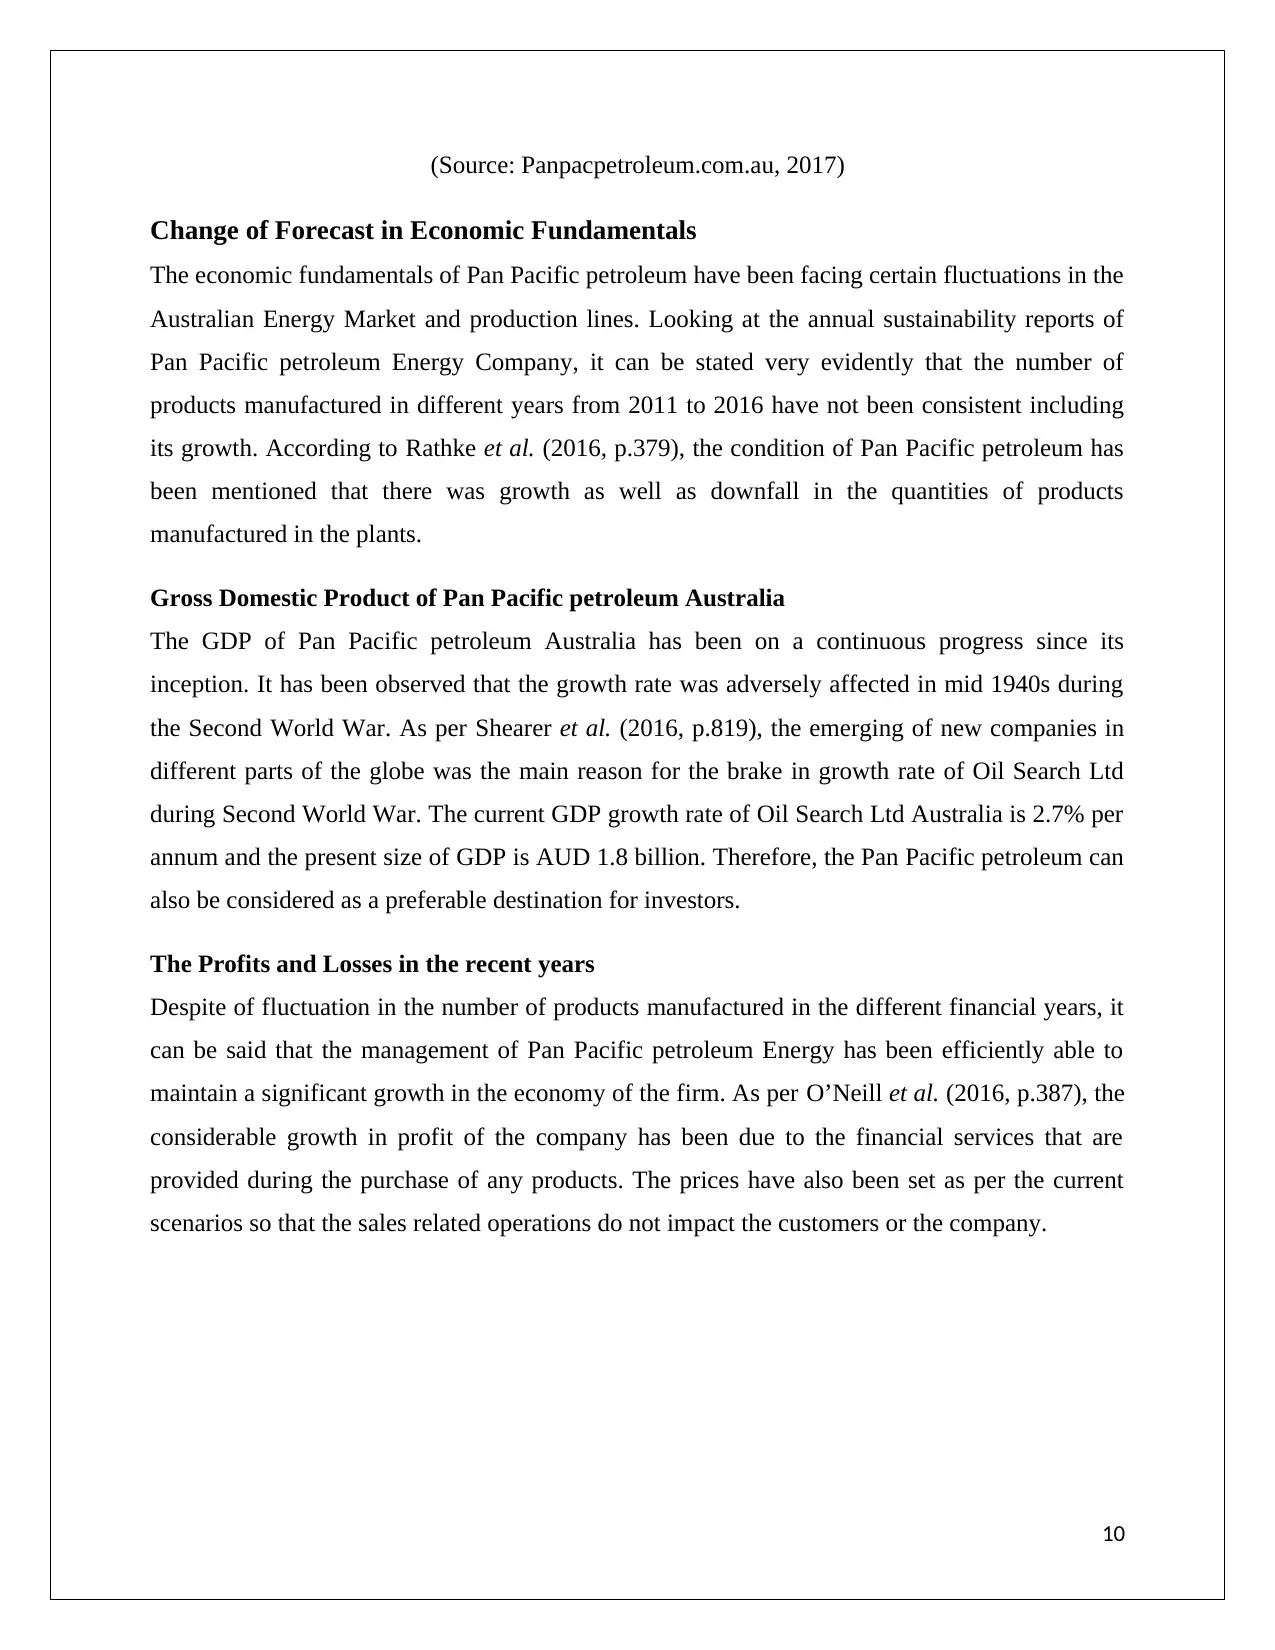
Change of Forecast in Economic Fundamentals
The economic fundamentals of Pan Pacific petroleum have been facing certain fluctuations in the
Australian Energy Market and production lines. Looking at the annual sustainability reports of
Pan Pacific petroleum Energy Company, it can be stated very evidently that the number of
products manufactured in different years from 2011 to 2016 have not been consistent including
its growth. According to Rathke et al. (2016, p.379), the condition of Pan Pacific petroleum has
been mentioned that there was growth as well as downfall in the quantities of products
manufactured in the plants.
Gross Domestic Product of Pan Pacific petroleum Australia
The GDP of Pan Pacific petroleum Australia has been on a continuous progress since its
inception. It has been observed that the growth rate was adversely affected in mid 1940s during
the Second World War. As per Shearer et al. (2016, p.819), the emerging of new companies in
different parts of the globe was the main reason for the brake in growth rate of Oil Search Ltd
during Second World War. The current GDP growth rate of Oil Search Ltd Australia is 2.7% per
annum and the present size of GDP is AUD 1.8 billion. Therefore, the Pan Pacific petroleum can
also be considered as a preferable destination for investors.
The Profits and Losses in the recent years
Despite of fluctuation in the number of products manufactured in the different financial years, it
can be said that the management of Pan Pacific petroleum Energy has been efficiently able to
maintain a significant growth in the economy of the firm. As per O’Neill et al. (2016, p.387), the
considerable growth in profit of the company has been due to the financial services that are
provided during the purchase of any products. The prices have also been set as per the current
scenarios so that the sales related operations do not impact the customers or the company.
10
Paraphrase This Document
Need a fresh take? Get an instant paraphrase of this document with our AI Paraphraser
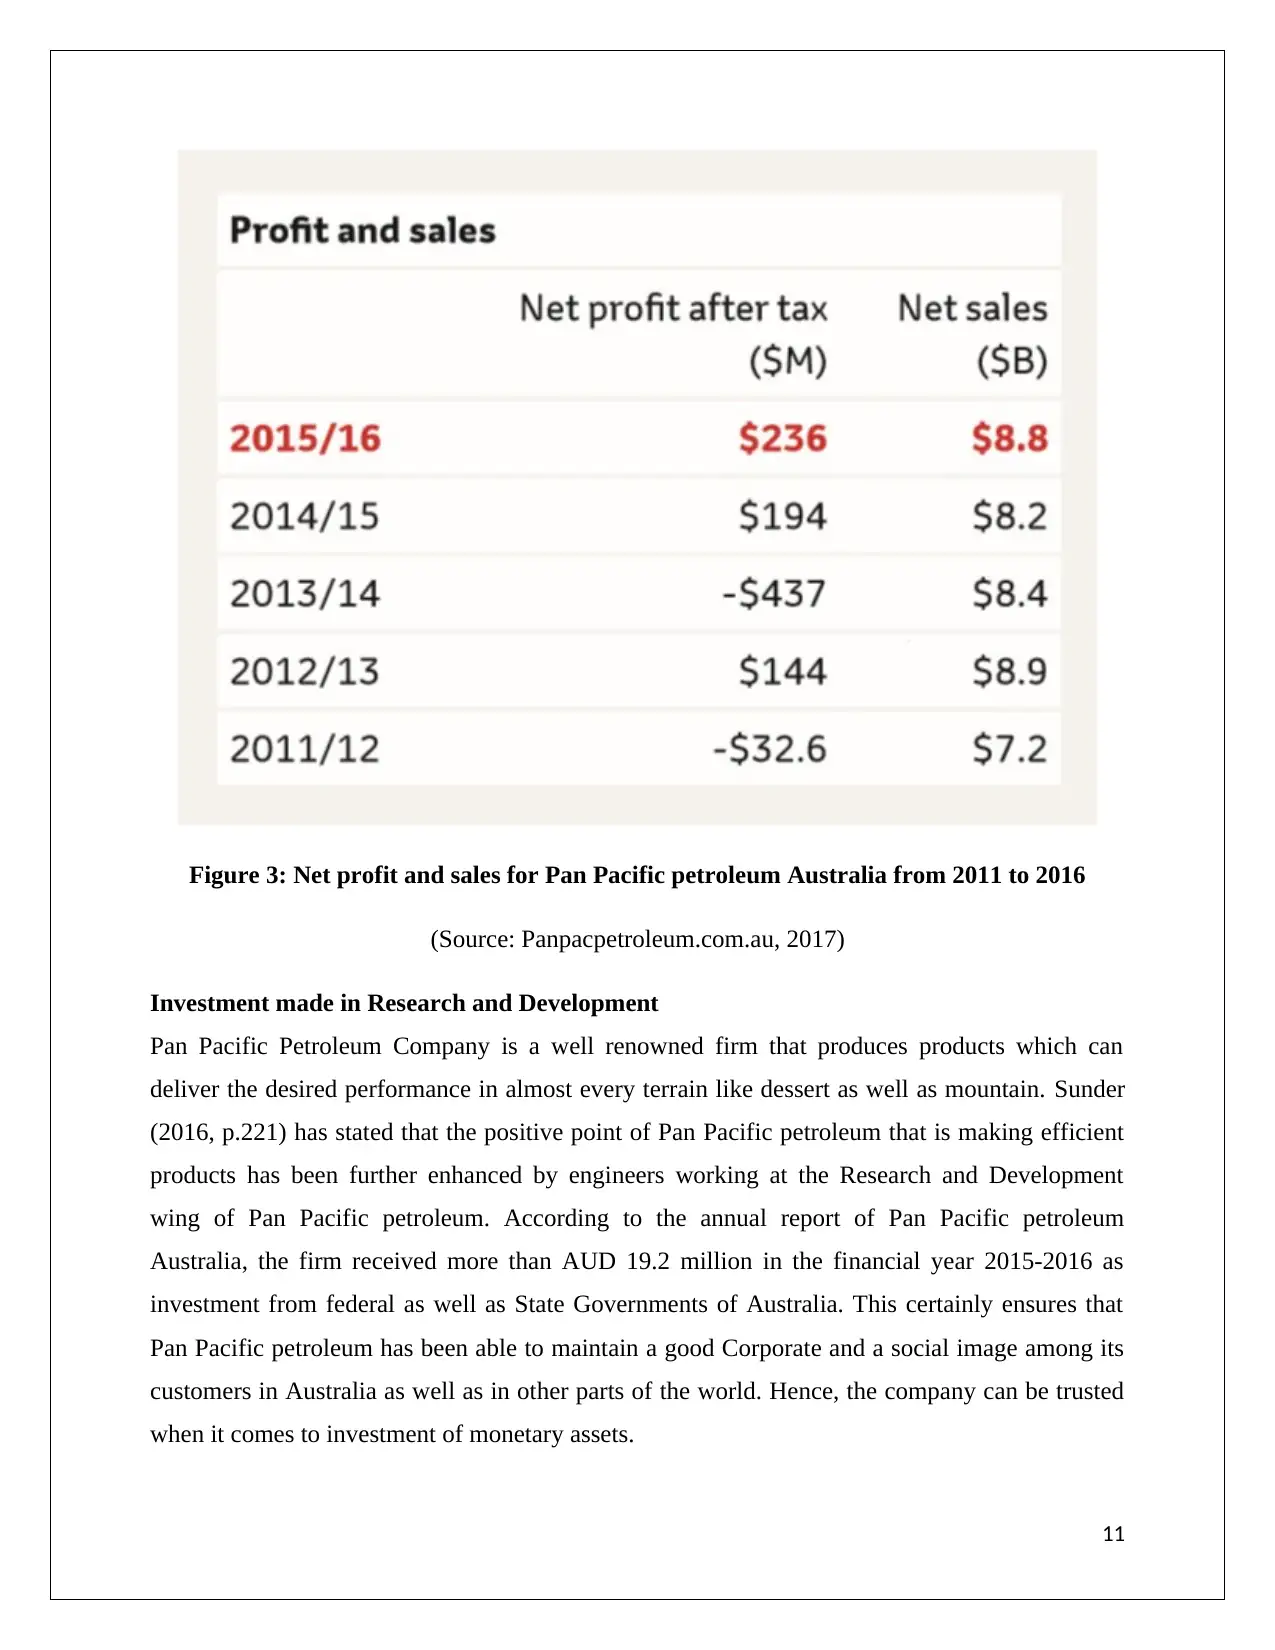
Figure 3: Net profit and sales for Pan Pacific petroleum Australia from 2011 to 2016
(Source: Panpacpetroleum.com.au, 2017)
Investment made in Research and Development
Pan Pacific Petroleum Company is a well renowned firm that produces products which can
deliver the desired performance in almost every terrain like dessert as well as mountain. Sunder
(2016, p.221) has stated that the positive point of Pan Pacific petroleum that is making efficient
products has been further enhanced by engineers working at the Research and Development
wing of Pan Pacific petroleum. According to the annual report of Pan Pacific petroleum
Australia, the firm received more than AUD 19.2 million in the financial year 2015-2016 as
investment from federal as well as State Governments of Australia. This certainly ensures that
Pan Pacific petroleum has been able to maintain a good Corporate and a social image among its
customers in Australia as well as in other parts of the world. Hence, the company can be trusted
when it comes to investment of monetary assets.
11
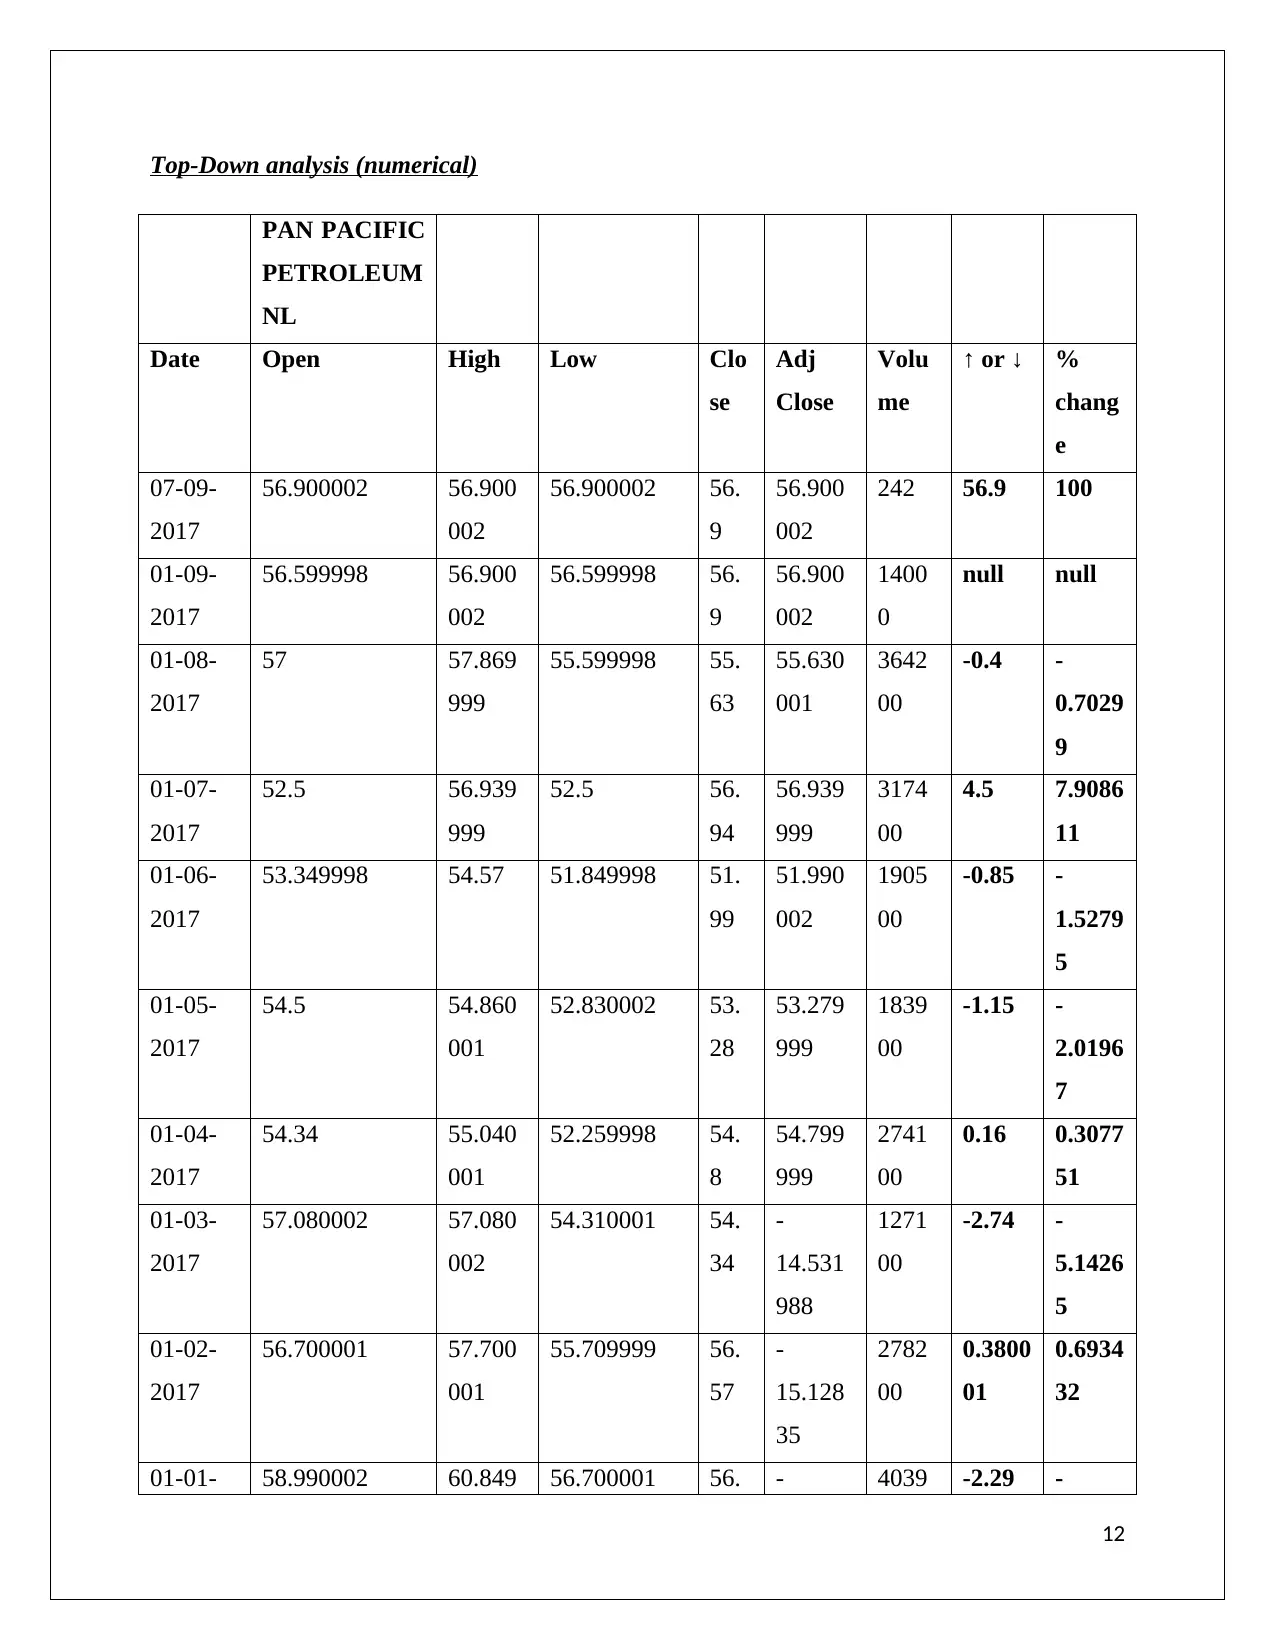
Top-Down analysis (numerical)
PAN PACIFIC
PETROLEUM
NL
Date Open High Low Clo
se
Adj
Close
Volu
me
↑ or ↓ %
chang
e
07-09-
2017
56.900002 56.900
002
56.900002 56.
9
56.900
002
242 56.9 100
01-09-
2017
56.599998 56.900
002
56.599998 56.
9
56.900
002
1400
0
null null
01-08-
2017
57 57.869
999
55.599998 55.
63
55.630
001
3642
00
-0.4 -
0.7029
9
01-07-
2017
52.5 56.939
999
52.5 56.
94
56.939
999
3174
00
4.5 7.9086
11
01-06-
2017
53.349998 54.57 51.849998 51.
99
51.990
002
1905
00
-0.85 -
1.5279
5
01-05-
2017
54.5 54.860
001
52.830002 53.
28
53.279
999
1839
00
-1.15 -
2.0196
7
01-04-
2017
54.34 55.040
001
52.259998 54.
8
54.799
999
2741
00
0.16 0.3077
51
01-03-
2017
57.080002 57.080
002
54.310001 54.
34
-
14.531
988
1271
00
-2.74 -
5.1426
5
01-02-
2017
56.700001 57.700
001
55.709999 56.
57
-
15.128
35
2782
00
0.3800
01
0.6934
32
01-01- 58.990002 60.849 56.700001 56. - 4039 -2.29 -
12
⊘ This is a preview!⊘
Do you want full access?
Subscribe today to unlock all pages.
Trusted by 1+ million students worldwide
1 out of 19
Related Documents


Your All-in-One AI-Powered Toolkit for Academic Success.
+13062052269
info@desklib.com
Available 24*7 on WhatsApp / Email
![[object Object]](/_next/static/media/star-bottom.7253800d.svg)
Unlock your academic potential
Copyright © 2020–2026 A2Z Services. All Rights Reserved. Developed and managed by ZUCOL.