Financial Analysis of Oman's Investment Market: A Detailed Report
VerifiedAdded on 2021/06/14
|15
|3694
|17
Report
AI Summary
This report provides a comprehensive fundamental analysis of Oman's investment market, focusing on the Muscat Securities Market (MSM). It begins with an introduction to fundamental analysis and its application in evaluating stock investments, followed by a description of the MSM and its MSM 30 index. The methodology section details the data collection process, including secondary data from the MSM and key economic indicators like GDP, interest rates, and exchange rates. The country analysis examines Oman's economic landscape, its reliance on oil, and government initiatives for diversification and fiscal reform. The report then delves into industry analysis, specifically the oil and gas and hospitality sectors, which are crucial to Oman's economic strategy. The report analyzes economic factors such as GDP, interest rates, and exchange rates. The study includes an analysis of the oil and gas and hospitality sectors, as well as company-specific data for several listed companies, evaluating their performance and investment viability based on financial ratios. The report aims to provide investors with insights for making informed decisions in the Omani stock market, considering both macroeconomic factors and company-specific performance.
Oman’s Investment Market 1
Oman’s Investment Market: Decision making
by Student Name
Course & Course Code
Professor
University
The City & State
Date
Oman’s Investment Market: Decision making
by Student Name
Course & Course Code
Professor
University
The City & State
Date
Paraphrase This Document
Need a fresh take? Get an instant paraphrase of this document with our AI Paraphraser
Oman’s Investment Market 2
1. Introduction:
When evaluating a long term investment decision, investors spend more time on the
fundamental factors such as analysing a company, the market and the company’s stock.
Fundamental analysis refers to the process of evaluating the intrinsic value of a security/
stock by considering all components of the market and company. Fundamental analysis
considers both the tangible assets such as land, equipment and buildings and the intangible
assets such as trademarks, branding, intellectual property, trademarks and patents in
analysing the security investment. For instance, when reviewing a stock market, fundamental
analysis considers all the economic factors and industry conditions. Fundamental analysis
helps investors compare the price assigned to a stock and its current price in the market. The
comparison helps investors to decide whether or not a stock is worth buying in because it is
under-priced or it’s worth selling because it is overpriced.
Fundamental analysis uses key ratios as tools of determine stock valuation in the market. The
fundamental analysis tools focus on stock growth, market value and earnings. Some of the
factors that fundamental analysis focuses to establish are Earnings per Share (EPS), Price to
Earnings Ratio (P/E), Projected Earnings Growth (PEG), Price to Sales Ratio (P/S), Price to
Book Ratio (P/B), Dividend Payout Ratio, Dividend Yield, and Return on Equity (ROE)
(Tracy, 2012, p. 45).
This report focuses on analysing the price and performance of stock for several companies
operating in in the Muscat Securities Market. The analysis evaluates the viability of investing
in the respective stock. Some of the companies under evaluation are Dhofar Insurance,
Global Financial Investment, National Finance, Al-Oula Company, Al Hasan Engineering,
Computer Stationery Ind., Construction Material Industry, Muscat Gases, Muscat City
Desalination, and United Power. The report is divided into three parts, namely country
Oman’s Investment Market 3
analysis, industry analysis, and company analysis. Lastly company analysis has been
evaluated using key ratios such as EPS, DPS, ROI, PE ratio and NPR.
Muscat Securities Market and its principal index, which is MSM -30
The Muscat Securities Market was founded in 21st June 1988 by the Royal Decree. The
Muscat Securities is the only market in Omani that deals with the stock exchange. It has the
responsibility to control and regulate the Omani’s market security (Muscat Securities Market,
2018). The market also collaborates with other stakeholders to develop infrastructures that
support the development of the financial sector in the country.
The Muscat Securities Market uses a MSM 30 index, which represents 30 most liquid,
profitable and capitalize companies listed on the market. The leading objectives of the MSM
30 index is to determine the price movement of stocks of the listed companies. The objective
analysis offers a guide to the investors during their investment processes and decision making
(Muscat Securities Market, 2018). To fully serve its objectives, the MSM 30 index has the
following features. First, it comprises of freely available shares only. Second, the capping is
rated at 10% to offer a wider representation of smaller companies in the market. And third,
the capping and free float of shares reviewed and revised on a quarterly basis to ensure a fair
representation (Muscat Securities Market, 2018).
2. Methodology:
a) Data Collection
Data collection is a vital part of any research or analysis. The accuracy and reliability of the
research finding highly depend on the quality of data collected. Therefore, to observe
reliability and accuracy of the results, secondary data collection method was chosen. Data
from the Muscat Securities Market was obtained from online searches and the official
website. Although, the MSM has at least thirty listed companies, only ten companies were
chosen to be studied in this report. The sampling was done randomly based on the industry/
⊘ This is a preview!⊘
Do you want full access?
Subscribe today to unlock all pages.
Trusted by 1+ million students worldwide
Oman’s Investment Market 4
business sectors that the companies operated in. The companies chosen for the study were
Dhofar Insurance, Global Financial Investment, National Finance, Al-Oula Company, Al
Hasan Engineering, Computer Stationery Ind., Construction Material Industry, Muscat Gases,
Muscat City Desalination, and United Power. It was easier to obtain data of the companies’
performance in the Oman market because they are all listed in the MSM.
For a comprehensive country analysis, data such on Oman’s GDP, Interest rates, oil prices,
Exchange rates, Consumer Price Index (CPI), and Product Price Index (PPI) was considered.
Secondary data on these economic parameters of Oman was obtained from online websites,
peer-reviewed sources and online databases.
b) Period of study
The data collected was for a period of one year between 2017/2018 years on a daily basis.
3. Application of Fundamental Analysis:
This section covers the analysis of the secondary data collected from the MSM as well as the
country’s economic parameters. The fundamental analysis has considered country analysis,
industry analysis and company analysis as the most appropriate tools to evaluate the stock
price and performance for respective companies in the MSM.
Country Analysis
Oman in the smallest member of the United Arab Emirates (UAE) based on its population.
The country is also the smallest kingdom in the region and has been ruled by Sultan Qaboos
Al-Said since 1970. Oman heavily depend on its oil resources to generate revenues;
approximately 80% of the government revenues comes from oil resources. Likewise, gas and
tourism industry also play a key component in revenue generation and diversification of the
government strategies (Arabian Business, 2018, p. 56).
Paraphrase This Document
Need a fresh take? Get an instant paraphrase of this document with our AI Paraphraser
Oman’s Investment Market 5
According to the 2018 World Trade Organization (WTO) index, which analysis the global
economic freedom for the respective countries, Oman scored 61.0 which labelled as the 93rd
economic freest country in the world. Overwhelming freedom was registered under judiciary
effectiveness and business freedom while labour freedom and fiscal health scored low. In the
Middle East and North Africa region, Oman was ranked 8th among the 14 countries based on
economic performance (Wippel, 2013, p. 112).
The country has been experiencing financial deficit since 2014 as a result of fluctuating oil
prices. The government has invested heavily in enhanced oil recovery techniques to boost the
country’s production. Likewise, the government has focused on economic diversification and
fiscal reform as a way of reducing over-reliance on oil reserves and hydrocarbon. Investors
have been complaining about unnecessary bureaucracy and unfriendly regulatory
environment which negative impact business performance (Khan, 2016, p. 96). The
government is focusing on reducing the red tape as one way of attracting foreign investors
into the economy. Since the introduction of the flexible requirement for investors, the country
has witnessed the increased number of foreign investors. The openness of the government
scored an above average index from the 2018 WTO global index (Nebel, 2016, p. 67).
Lastly, the Omani’s banking sector is still evolving, although its commercial banks registered
promising performance in 2018. The financial sector is providing credit at market rates as a
mechanism of attracting more investors. The government is also providing subsidized loans
to attract more investment hence promoting investment.
An evaluation of Omani’s performance between 2017 and 2018 was based on three economic
factors that is Gross Domestic Product (GDP), Interest Rates, and Exchange Rates.
Oman’s Investment Market 6
a) Gross Domestic Product (GDP)
GDP refers to the total value produced by a country’s population and companies in a given
fiscal year. By comparing two GDPs from two consecutive periods, one can tell whether or
not the economy is growing. Likewise the economic growth rate indicates whether the
economy is growing quickly of slowly. Economists have suggested that an ideal growth rate
for any country should be between 2% and 3% (Khan, 2016, p. 71). GDP has a direct impact
on job growth, investments and personal finance. Investors use the GDP and economic
growth rate when deciding on whether or not to invest in a country, adjust financial and asset
allocation for a given investment, and withdraw the investment opportunities in a given
country. Likewise, GDP and growth rate trends are used to estimate future investment
performance (Trading Economics, 2018).
The GDP of Oman grew by 5.1% in 2016 which was a positive growth from the -14.1% in
2015. The growth rate was followed by 3.9% in 2017. The highest growth rate to be to be
recorded in Oman was 13.1% in 2008. The government projected that the economy would
grow by 5.2% in 2018 (Trading Economics, 2018). Some of the initiatives that had been
taken by the government towards achieving the growth were economic diversification and
establishment of the Muscat airport. The airport expected to boost the hospitality and tourism
industry. Likewise, new investors would be attracted to invest in the land new the airport.
Oil production is the main contributor to the country’s GDP. The energy sector contributed to
87% of the budget revenues, 60% of total exports as well as 51% of the GDP. However, with
the shrinking of the oil reserves, the government is focused on diversifying its economy
through developing hospitality, tourisms, and gas industries. The trend shows a promising
future on the country’s economic growth (Trading Economics, 2018).
⊘ This is a preview!⊘
Do you want full access?
Subscribe today to unlock all pages.
Trusted by 1+ million students worldwide
Oman’s Investment Market 7
b) Interest Rates
Interest rate shows that ability of people and company to afford the loans in an economy. The
higher the interest rates, the higher the cost of affording loans and the less the ability of
people to acquire credit. In other words, a country’s economy can only grow when the
interest rate is low (English, 2011, p. 83). Oman has recorded an average interest rate of
1.5% between 2008 and 2018. The highest ever interest rate to be recorded was 5% in 2008
while the lowest was 1% in 2012. In 2017, the interest rate was 2.38%, while the 1st quarter
of 2018 registered an interest rate of 2.41% (Arabian Business, 2018). The trend shows that
the affordability of credit loans decreases with time. Loans and credit are becoming
expensive, which is not good for economic growth and attraction of more investors in the
economy. However, the increase in the rates were caused by fluctuating oil prices. The
interest rate is expected to drop with stabilization of the oil prices in the global market.
Likewise, compared to other countries in the UAE, Oman still enjoy low interest rate
(IECONOMICS, 2018).
c) Exchange Rates
The exchange rate is an important factor in determining a nation’s level of economic health.
Therefore, exchange rates play an important role in a nation’s level of trade in the global free
market economy. Exchange rate affects the return of the investors’ portfolio (English, 2011,
p. 76).
The higher a country’s currency, the more expensive its exports are and the cheaper the
imports in foreign markets. In other words, the higher the exchange rate, the higher the
competitive level of a given currency.
Paraphrase This Document
Need a fresh take? Get an instant paraphrase of this document with our AI Paraphraser
Oman’s Investment Market 8
The Oman currency has a higher exchange rate compared to the USD. Between 2017 and
2018 One USD traded at 0.385 OMR. The currency remained stable against the USD over the
last ten years amid the fluctuations in the oil price. The exchange rate reached its highest at
0.417 in 1971 and the lowest in 0.345 at 1985 (IECONOMICS, 2018).
Industry Analysis
This section analysis the oil industry and hospitality industry, which are the backbone of the
country’s economic diversification strategy.
a) Oil and gas industry
The Oman’s oil production grew by 7.1% in 2017 and is expected to grow further by 6.9% in
2018. The increase was registered irrespective of the reduction of the global oil production
and the decrease of the country GDP growth. The demand for Oman’s oil products is
expected to increase if the Asian region and China in particular. Other emerging markets for
the country’s oil products are Japan, Korea and Thailand (IBP Inc., 2015, p. 107).
Although the price of oil is expected to increase in the future, the country is focused on
engaging in non-oil related economic activities. The company is using funds realized from oil
activities to expand its non-oil sectors. Therefore, the stable prices of oil are expected to
continue benefiting Oman in improving its infrastructures and exports as well as economic
diversification to attract more non-oil investors (Kechichian, 1995, p. 67).
b) Hospitality industry
The Oman’s hospitality industry grew by 6.2% between 2015 and 2018 to reach USD 1
billion for the first time. The growth was as a result of 6.3% increase in the number of tourists
arriving in the country per annum and 5.3% rise in the number of hotels. The number of
tourists visiting the country is expected to double by 2014. The building of a new airport in
Oman’s Investment Market 9
Muscat besides developing tourist spots and private investments will boost the demand from
the tourism sector (Baporikar, 2012, p. 113).
However, fluctuation of the oil price and over-dependent on oil has weakened the economic
growth hindering the government’s ability to expand the hospitality market. Likewise, the
inability of the UAE governments to attract a continuous flow of tourists in the region have
an adverse impact of the growth of the hospitality market (Pablos, 2011, p. 99).
Company Analysis
This section covers the calculation of ideal ratios such as EPS, DPS, PE ratio, Profitability
ratios (NPM) on the ten selected companies listed in the MSM 30. The analysis of the ten
companies is divided into Risk-Return analysis and financial ratio analysis.
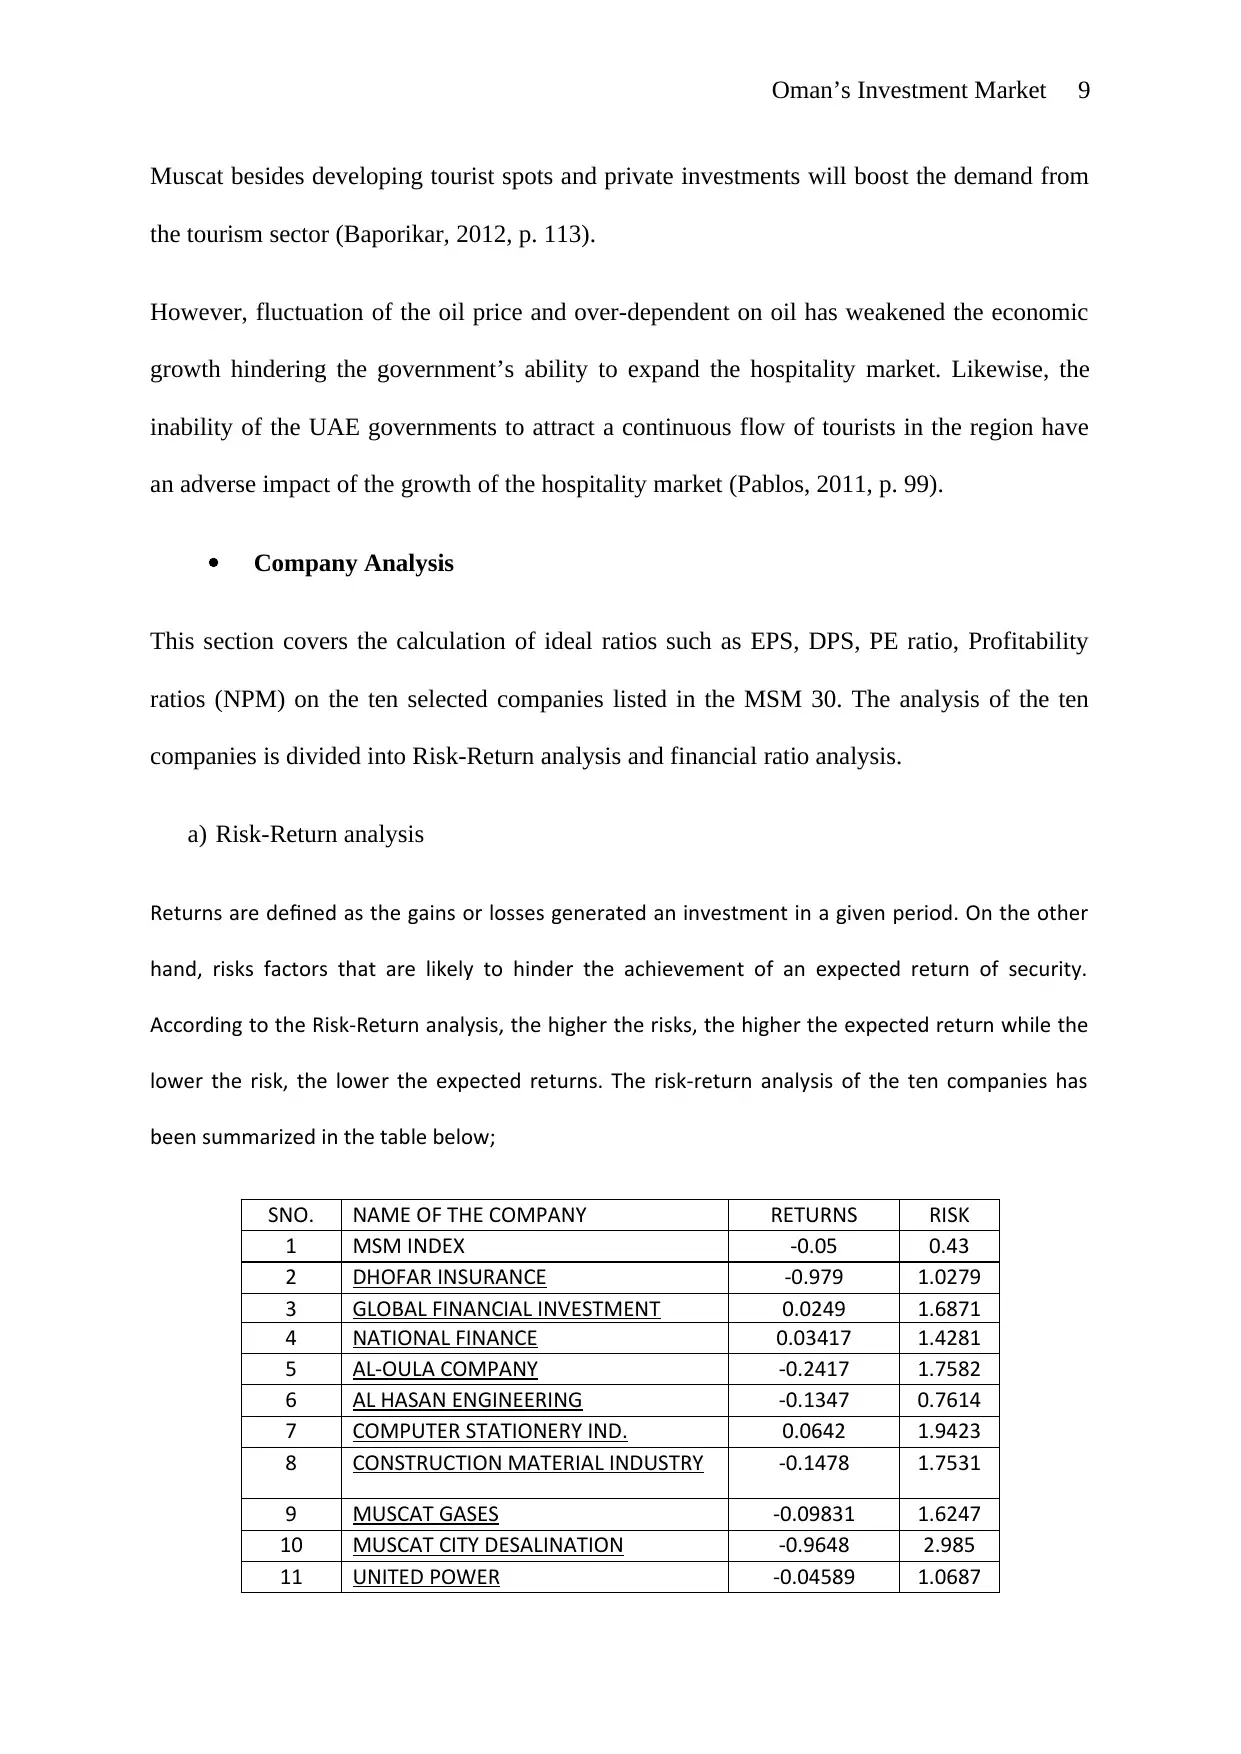
a) Risk-Return analysis
Returns are defined as the gains or losses generated an investment in a given period. On the other
hand, risks factors that are likely to hinder the achievement of an expected return of security.
According to the Risk-Return analysis, the higher the risks, the higher the expected return while the
lower the risk, the lower the expected returns. The risk-return analysis of the ten companies has
been summarized in the table below;
SNO. NAME OF THE COMPANY RETURNS RISK
1 MSM INDEX -0.05 0.43
2 DHOFAR INSURANCE -0.979 1.0279
3 GLOBAL FINANCIAL INVESTMENT 0.0249 1.6871
4 NATIONAL FINANCE 0.03417 1.4281
5 AL-OULA COMPANY -0.2417 1.7582
6 AL HASAN ENGINEERING -0.1347 0.7614
7 COMPUTER STATIONERY IND. 0.0642 1.9423
8 CONSTRUCTION MATERIAL INDUSTRY -0.1478 1.7531
9 MUSCAT GASES -0.09831 1.6247
10 MUSCAT CITY DESALINATION -0.9648 2.985
11 UNITED POWER -0.04589 1.0687
Muscat besides developing tourist spots and private investments will boost the demand from
the tourism sector (Baporikar, 2012, p. 113).
However, fluctuation of the oil price and over-dependent on oil has weakened the economic
growth hindering the government’s ability to expand the hospitality market. Likewise, the
inability of the UAE governments to attract a continuous flow of tourists in the region have
an adverse impact of the growth of the hospitality market (Pablos, 2011, p. 99).
Company Analysis
This section covers the calculation of ideal ratios such as EPS, DPS, PE ratio, Profitability
ratios (NPM) on the ten selected companies listed in the MSM 30. The analysis of the ten
companies is divided into Risk-Return analysis and financial ratio analysis.
a) Risk-Return analysis
Returns are defined as the gains or losses generated an investment in a given period. On the other
hand, risks factors that are likely to hinder the achievement of an expected return of security.
According to the Risk-Return analysis, the higher the risks, the higher the expected return while the
lower the risk, the lower the expected returns. The risk-return analysis of the ten companies has
been summarized in the table below;
SNO. NAME OF THE COMPANY RETURNS RISK
1 MSM INDEX -0.05 0.43
2 DHOFAR INSURANCE -0.979 1.0279
3 GLOBAL FINANCIAL INVESTMENT 0.0249 1.6871
4 NATIONAL FINANCE 0.03417 1.4281
5 AL-OULA COMPANY -0.2417 1.7582
6 AL HASAN ENGINEERING -0.1347 0.7614
7 COMPUTER STATIONERY IND. 0.0642 1.9423
8 CONSTRUCTION MATERIAL INDUSTRY -0.1478 1.7531
9 MUSCAT GASES -0.09831 1.6247
10 MUSCAT CITY DESALINATION -0.9648 2.985
11 UNITED POWER -0.04589 1.0687
⊘ This is a preview!⊘
Do you want full access?
Subscribe today to unlock all pages.
Trusted by 1+ million students worldwide
Oman’s Investment Market 10
On average, a single stock in the MSM Index is associated with a 0.43 % risk and -0.05%
returns. Compared to the returns, the risks associated with investing in the stock of the ten
companies were high. Only three companies had positive returns associated with their stock.
In other words, is an investor had to invest in the stocks of the ten companies, only stocks
from Global Financial Investment, National Finance, and Computer Stationery Ind. would
have generated positive returns. The Computer Stationery Ind. had the highest return of
0.0642%, while the Muscat City Desalination had the lowest return of -0.9648. Based on risk-
return analysis, the stocks of the ten companies were not worth investing in because the
returns could not match the associated risks (Tracy, 2012, p. 56).
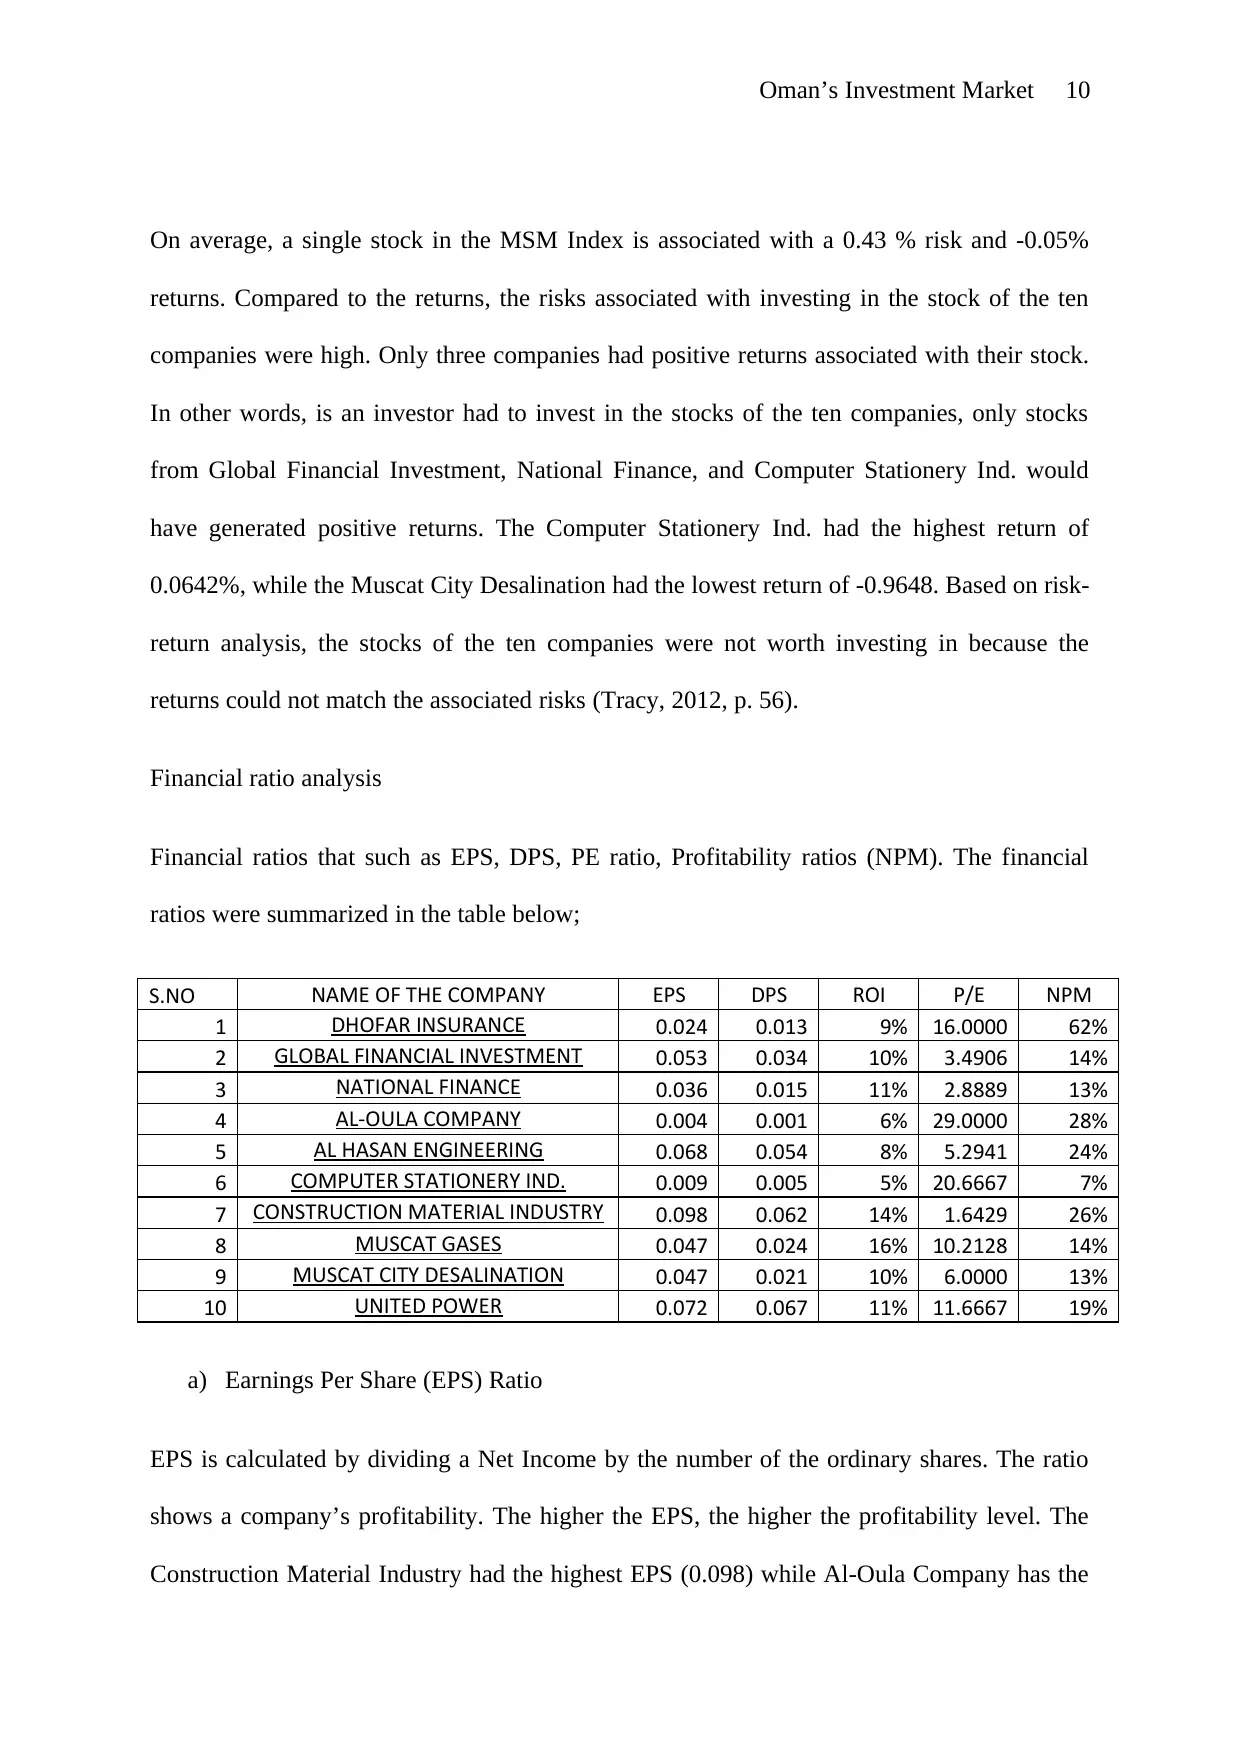
Financial ratio analysis
Financial ratios that such as EPS, DPS, PE ratio, Profitability ratios (NPM). The financial
ratios were summarized in the table below;
S.NO NAME OF THE COMPANY EPS DPS ROI P/E NPM
1 DHOFAR INSURANCE 0.024 0.013 9% 16.0000 62%
2 GLOBAL FINANCIAL INVESTMENT 0.053 0.034 10% 3.4906 14%
3 NATIONAL FINANCE 0.036 0.015 11% 2.8889 13%
4 AL-OULA COMPANY 0.004 0.001 6% 29.0000 28%
5 AL HASAN ENGINEERING 0.068 0.054 8% 5.2941 24%
6 COMPUTER STATIONERY IND. 0.009 0.005 5% 20.6667 7%
7 CONSTRUCTION MATERIAL INDUSTRY 0.098 0.062 14% 1.6429 26%
8 MUSCAT GASES 0.047 0.024 16% 10.2128 14%
9 MUSCAT CITY DESALINATION 0.047 0.021 10% 6.0000 13%
10 UNITED POWER 0.072 0.067 11% 11.6667 19%
a) Earnings Per Share (EPS) Ratio
EPS is calculated by dividing a Net Income by the number of the ordinary shares. The ratio
shows a company’s profitability. The higher the EPS, the higher the profitability level. The
Construction Material Industry had the highest EPS (0.098) while Al-Oula Company has the
On average, a single stock in the MSM Index is associated with a 0.43 % risk and -0.05%
returns. Compared to the returns, the risks associated with investing in the stock of the ten
companies were high. Only three companies had positive returns associated with their stock.
In other words, is an investor had to invest in the stocks of the ten companies, only stocks
from Global Financial Investment, National Finance, and Computer Stationery Ind. would
have generated positive returns. The Computer Stationery Ind. had the highest return of
0.0642%, while the Muscat City Desalination had the lowest return of -0.9648. Based on risk-
return analysis, the stocks of the ten companies were not worth investing in because the
returns could not match the associated risks (Tracy, 2012, p. 56).
Financial ratio analysis
Financial ratios that such as EPS, DPS, PE ratio, Profitability ratios (NPM). The financial
ratios were summarized in the table below;
S.NO NAME OF THE COMPANY EPS DPS ROI P/E NPM
1 DHOFAR INSURANCE 0.024 0.013 9% 16.0000 62%
2 GLOBAL FINANCIAL INVESTMENT 0.053 0.034 10% 3.4906 14%
3 NATIONAL FINANCE 0.036 0.015 11% 2.8889 13%
4 AL-OULA COMPANY 0.004 0.001 6% 29.0000 28%
5 AL HASAN ENGINEERING 0.068 0.054 8% 5.2941 24%
6 COMPUTER STATIONERY IND. 0.009 0.005 5% 20.6667 7%
7 CONSTRUCTION MATERIAL INDUSTRY 0.098 0.062 14% 1.6429 26%
8 MUSCAT GASES 0.047 0.024 16% 10.2128 14%
9 MUSCAT CITY DESALINATION 0.047 0.021 10% 6.0000 13%
10 UNITED POWER 0.072 0.067 11% 11.6667 19%
a) Earnings Per Share (EPS) Ratio
EPS is calculated by dividing a Net Income by the number of the ordinary shares. The ratio
shows a company’s profitability. The higher the EPS, the higher the profitability level. The
Construction Material Industry had the highest EPS (0.098) while Al-Oula Company has the
Paraphrase This Document
Need a fresh take? Get an instant paraphrase of this document with our AI Paraphraser
Oman’s Investment Market 11
lowest EPS (0.004). Therefore, Construction Material Industry had the highest profitability
while Al-Oula Company had the lowest (International Business Publications, 2009, p. 21).
b) Dividend Per Share (DPS) Ratio
The DPS also shows the profitability level of a company. The higher the DPS ratio, the
higher the profitability. The ratio calculated by dividing the total amount of declared
dividends with total number of ordinary shares (Tracy, 2012, p. 68). The United Power had
the highest DPS (0.067) while Al-Oula Company had the lowest DPS (0.001).
c) Return on Investment (ROI)
The ratio is used to determine the efficiency of an investment. It measures the amount of a
company’s return that was derived from its investments. ROI is calculated by dividing the
return from the investment from the cost of such an investment (Tracy, 2012, p. 73). The
Muscat Gases registered the highest ROI of 0.067%, while Computer Stationary IND.
Registered the lowest ROI of 5%.
d) Price/ Earnings ratio (P/E)
The P/E ratio indicates the market price of a stock based on the earnings. The ratio is
calculated by dividing the market price per share by earnings per share (Tracy, 2012, p. 74).
The Al-Oula Company had the highest P/E (29) while Construction Material Industry had the
lowest P/E (1.6429).
e) Net Profit Margin (NPM)
The NPM indicates a company’s profitability after expenses and costs have been deducted.
NPM is calculated by dividing the net income by sales (Tracy, 2012, p. 82). Dhofar Insurance
Oman’s Investment Market 12
had the highest NPM of 62%, while the Computer Stationery India. Had the lowest NPM of
7%.
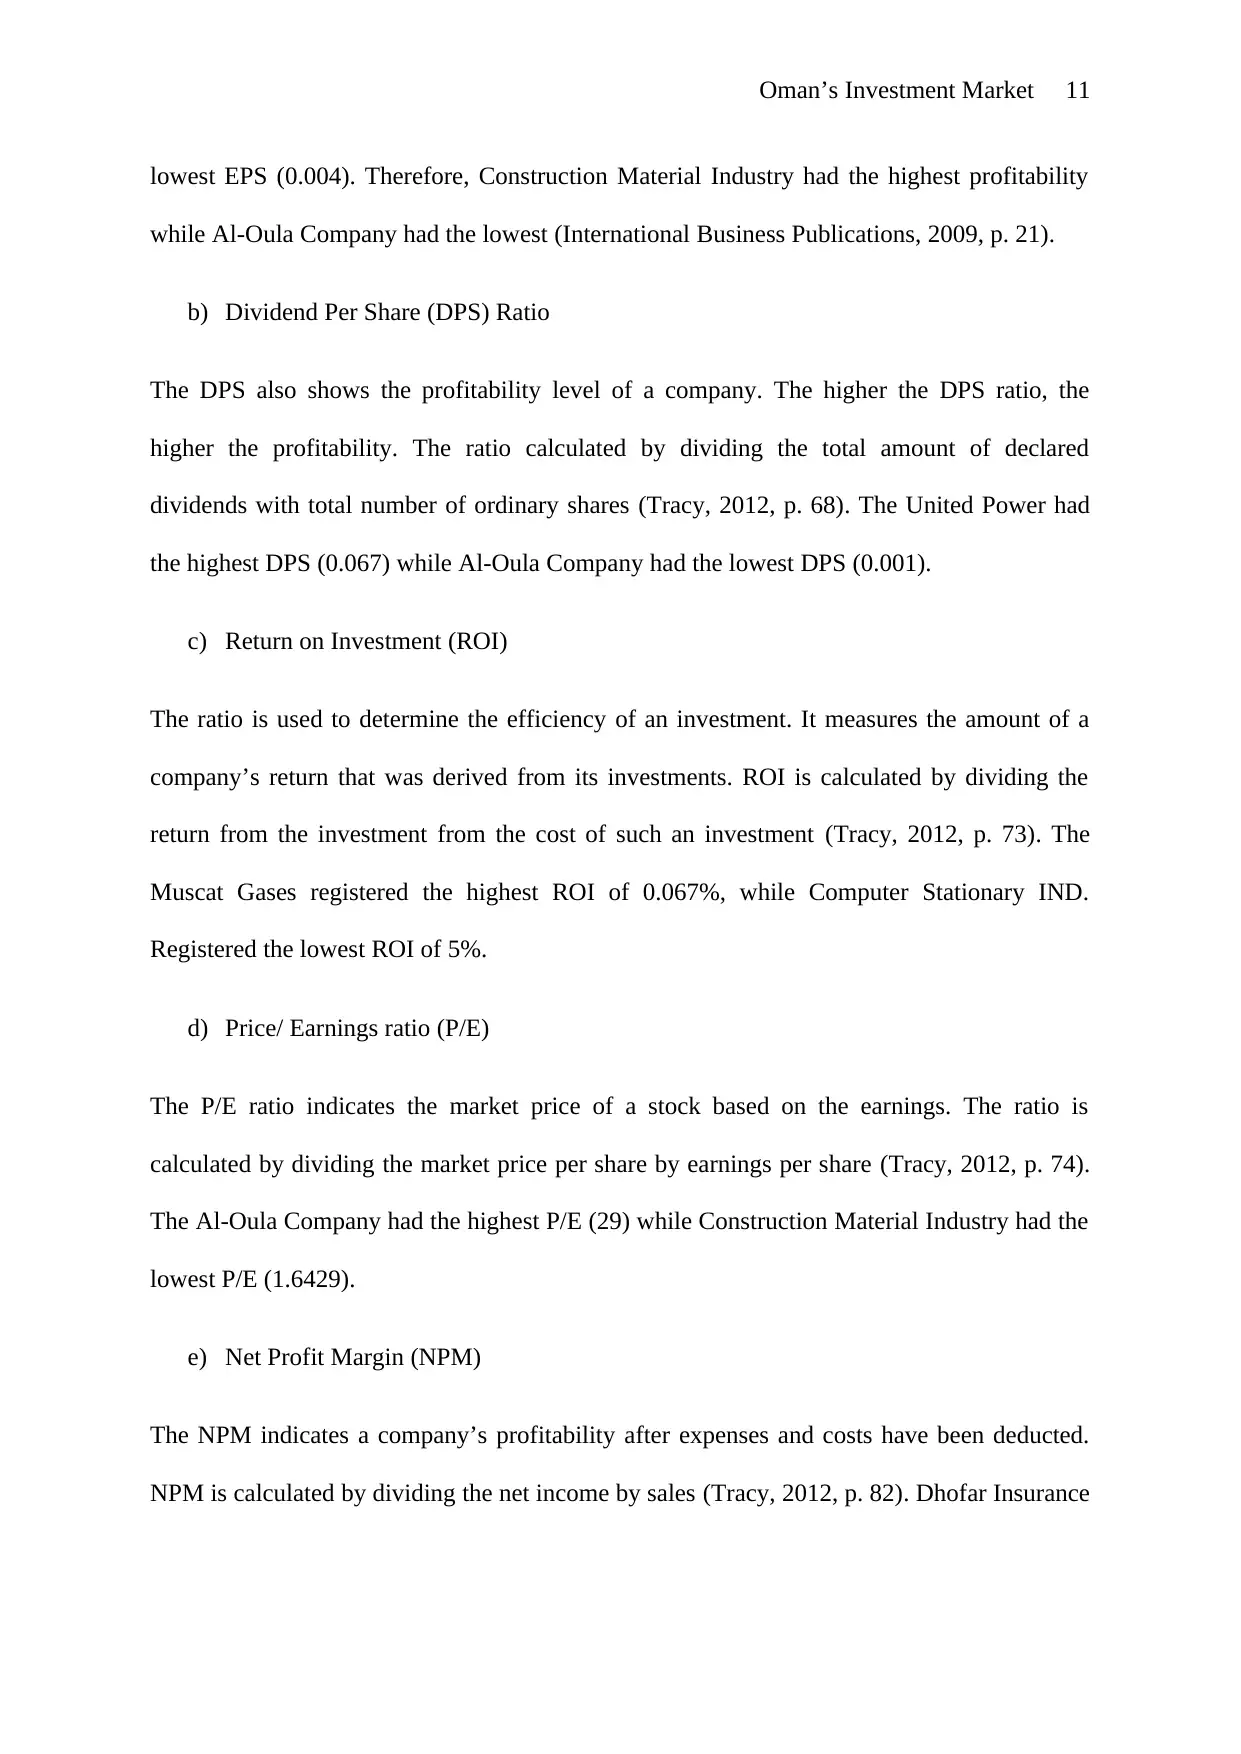
Raking of the investment choices
The ranking is based on the Net profit Margin based on three reasons. First, NPM is the
bottom line of calculating the profitability of a company and is mostly used by investors
when making investment decisions. Second, it is the basis of calculating other profitability
ratios. And three, it shows the true amount of dividend earned by a single shareholder in a
given financial year. The ranking has been summarized as shown in the table below;
S.NO NAME OF THE COMPANY RANK
1 DHOFAR INSURANCE 1
2 GLOBAL FINANCIAL INVESTMENT 6
3 NATIONAL FINANCE 8
4 AL-OULA COMPANY 2
5 AL HASAN ENGINEERING 4
6 COMPUTER STATIONERY IND. 10
7 CONSTRUCTION MATERIAL INDUSTRY 3
8 MUSCAT GASES 8
9 MUSCAT CITY DESALINATION 6
10 UNITED POWER 5
Based on the NPM, the Dhofar is ranked number One followed by Al-Oula Company while
Computer Stationery Ind. is ranked last.
4. Conclusion
This report focused on analysing the price and performance of stock for several companies
operating in in the Muscat Securities Market. The analysis evaluated the viability of investing
in the respective stock. Some of the companies under evaluation were Dhofar Insurance,
had the highest NPM of 62%, while the Computer Stationery India. Had the lowest NPM of
7%.
Raking of the investment choices
The ranking is based on the Net profit Margin based on three reasons. First, NPM is the
bottom line of calculating the profitability of a company and is mostly used by investors
when making investment decisions. Second, it is the basis of calculating other profitability
ratios. And three, it shows the true amount of dividend earned by a single shareholder in a
given financial year. The ranking has been summarized as shown in the table below;
S.NO NAME OF THE COMPANY RANK
1 DHOFAR INSURANCE 1
2 GLOBAL FINANCIAL INVESTMENT 6
3 NATIONAL FINANCE 8
4 AL-OULA COMPANY 2
5 AL HASAN ENGINEERING 4
6 COMPUTER STATIONERY IND. 10
7 CONSTRUCTION MATERIAL INDUSTRY 3
8 MUSCAT GASES 8
9 MUSCAT CITY DESALINATION 6
10 UNITED POWER 5
Based on the NPM, the Dhofar is ranked number One followed by Al-Oula Company while
Computer Stationery Ind. is ranked last.
4. Conclusion
This report focused on analysing the price and performance of stock for several companies
operating in in the Muscat Securities Market. The analysis evaluated the viability of investing
in the respective stock. Some of the companies under evaluation were Dhofar Insurance,
⊘ This is a preview!⊘
Do you want full access?
Subscribe today to unlock all pages.
Trusted by 1+ million students worldwide
1 out of 15
Related Documents


Your All-in-One AI-Powered Toolkit for Academic Success.
+13062052269
info@desklib.com
Available 24*7 on WhatsApp / Email
![[object Object]](/_next/static/media/star-bottom.7253800d.svg)
Unlock your academic potential
Copyright © 2020–2026 A2Z Services. All Rights Reserved. Developed and managed by ZUCOL.