SAPM Report: Fundamental Analysis of Oman Stock Market
VerifiedAdded on 2021/06/16
|17
|3981
|293
Report
AI Summary
This report presents a fundamental analysis of the Oman stock market, evaluating investment opportunities. It begins with an introduction to the Muscat Securities Market and the significance of fundamental analysis. The methodology section details the data collection process, focusing on secondary data from the Muscat Securities Market and company annual reports, with a study period from 2017 to 2018. The core of the report applies fundamental analysis, examining the Omani economy through GDP, interest rates, and oil prices, followed by industry analysis of the financial, industrial, and service sectors. Company analysis is performed on selected firms, including EPS, DPS, ROI, and P/E ratios. The report concludes by summarizing investment viability based on the analysis, including risk and return assessments of selected companies and the MSM Index.

Running head: SAPM
SAPM
Name of the Student:
Name of the University:
Authors Note:
SAPM
Name of the Student:
Name of the University:
Authors Note:
Paraphrase This Document
Need a fresh take? Get an instant paraphrase of this document with our AI Paraphraser
SAPM
1
Table of Contents
1. Introduction:...........................................................................................................................2
2. Methodology:.........................................................................................................................3
3. Application of Fundamental Analysis:...................................................................................4
Country Analysis:.......................................................................................................................4
Industry Analysis:......................................................................................................................7
Company Analysis:..................................................................................................................10
4. Conclusion:..........................................................................................................................14
Reference and Bibliography:....................................................................................................15
SAPM
2
1. Introduction:
The overall assessment mainly focuses on identifying the significance of fundamental
analysis and how out could allow investors to detect investment opportunity, which could
increase return from investment. In addition, the assessment structure mainly comprises of
methodology, fundamental analysis, and conclusion, which could help in detecting the overall
stock that could be used for investment. The overall date collection process and period of the
study is also depicted to identify viability of the research, which is conducted on the stock for
deriving its financial viability in the long-run. Moreover, financial performance of the
company is identified, which could help in understanding the level of returns that might be
provided from investment. Furthermore, the overall fundamental valuation also helps in
understanding the level of progress that could be generated form investment.
The main objective of the report is to identify the investment opportunity based on
fundamental analysis, which could help in understanding the level of return that could be
generated the investment. In addition, the risk and return concept of investors are also
conducted to identify investment opportunity, which could be generated from investment.
Furthermore, the investment scope detected with the help of fundamental analysis mainly
helps in understanding the level of profits that could be generated form investment.
Moreover, relevant country, company and industry analysis is conducted to identify the level
of returns, which could be generated form investment.
There is only one stock exchange market in Oman, known as the Muscat Securities
Market, which was established in 1988 for developing the financial sector of the country
(Msm.gov.om 2018). The overall security exchange market in Oman allowed the
international organisation to set up their operations in Oman and participate effectively to
strengthen the sultanate. In addition, the creation of the market allowed companies in Oman
⊘ This is a preview!⊘
Do you want full access?
Subscribe today to unlock all pages.
Trusted by 1+ million students worldwide
SAPM
3
to participate in the capital market growth, while obtaining the level of funds to conduct their
operations. The MSM-Index was relatively formed in 1992 with the 30 most highly traded
stock in the market. The combination of the stocks relevantly helped in understanding the
level of returns, which could be generated from investment in the Omani security market. The
MSM index comprises of companies who are old and are not government controlled, while
their shares are most liquid in the market. Moreover, the Muscat Securities Market has been
awarded ISO 9001:2008 certificate for trading securities and ISO 27001:2005 certificate for
information security management system.
2. Methodology:
Data Collection:
The data collection conducted for the assessment is secondary in nature, as the data is
collected from the website of Muscat Securities Market. The data was collected it the excel
sheet, which helped in completing the overall requirement of the calculation conducted on the
assessment. In addition, the data for the ratios was collected from the annual report of the
companies used in the assessment for calculation purposes. Lastly, the data used in the
assessment for analysis performance of the organisation is from the annual report of the
company, which is presented in both the website of the company and in Muscat Securities
Market welfare (Tradingeconomics.com 2018).
Period of the study:
The overall period that was taken for the calculation purposes is one year, which
could help in understanding the level of return, which could improve the investment. In
addition, the data from 2017 to 2018 is relevantly taken into consideration for completing the
assessment and analyse the performance of selected companies. Furthermore, the share price
Paraphrase This Document
Need a fresh take? Get an instant paraphrase of this document with our AI Paraphraser
SAPM
4
movement of the companies are also taken from historical price movement between April
2017 to April 2018. This helped in detecting the level of returns, which could be generated
from investment (Tradingeconomics.com 2018).
3. Application of Fundamental Analysis:
Country Analysis:
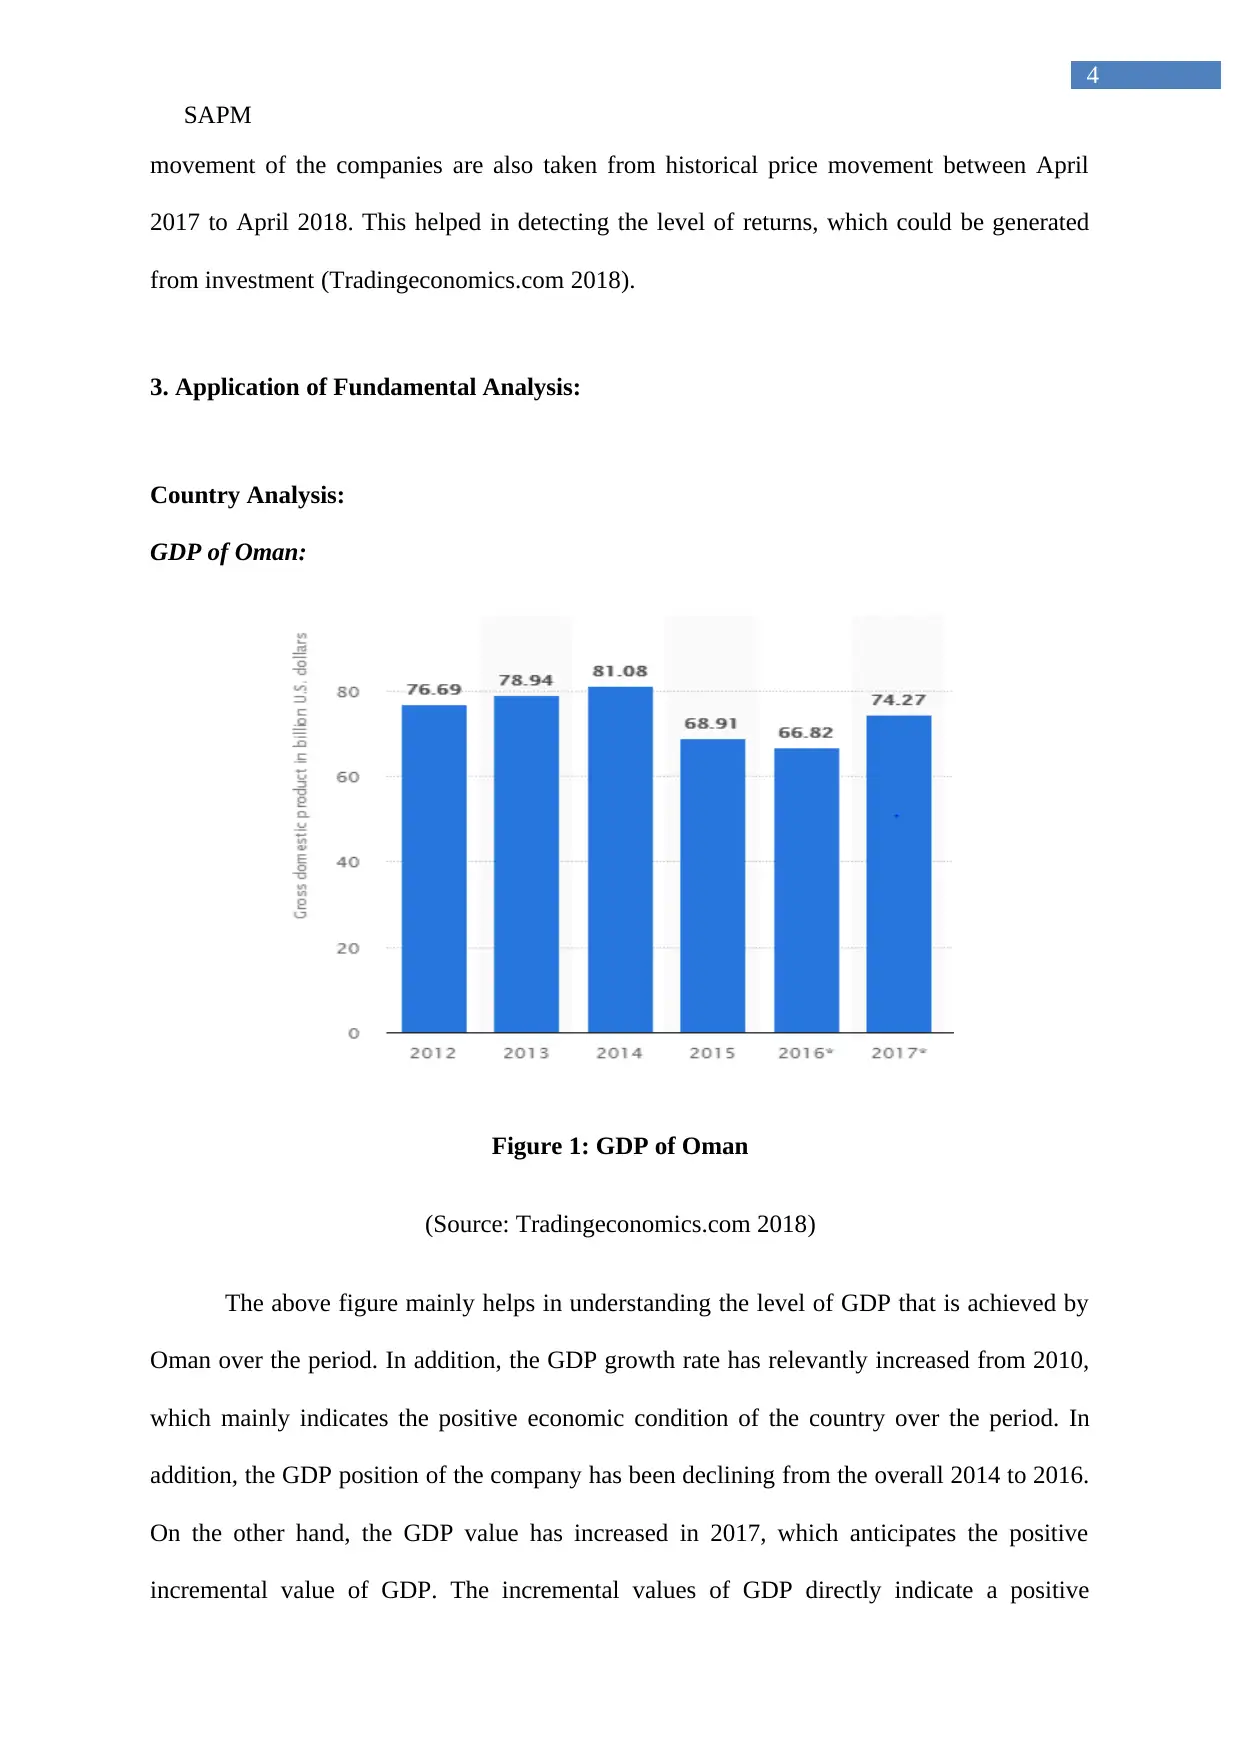
GDP of Oman:
Figure 1: GDP of Oman
(Source: Tradingeconomics.com 2018)
The above figure mainly helps in understanding the level of GDP that is achieved by
Oman over the period. In addition, the GDP growth rate has relevantly increased from 2010,
which mainly indicates the positive economic condition of the country over the period. In
addition, the GDP position of the company has been declining from the overall 2014 to 2016.
On the other hand, the GDP value has increased in 2017, which anticipates the positive
incremental value of GDP. The incremental values of GDP directly indicate a positive
4
movement of the companies are also taken from historical price movement between April
2017 to April 2018. This helped in detecting the level of returns, which could be generated
from investment (Tradingeconomics.com 2018).
3. Application of Fundamental Analysis:
Country Analysis:
GDP of Oman:
Figure 1: GDP of Oman
(Source: Tradingeconomics.com 2018)
The above figure mainly helps in understanding the level of GDP that is achieved by
Oman over the period. In addition, the GDP growth rate has relevantly increased from 2010,
which mainly indicates the positive economic condition of the country over the period. In
addition, the GDP position of the company has been declining from the overall 2014 to 2016.
On the other hand, the GDP value has increased in 2017, which anticipates the positive
incremental value of GDP. The incremental values of GDP directly indicate a positive
SAPM
5
attribute of the Omani economic condition, which could be feasible for the investor to
generate high rate of returns from investment. The GDP directly states the positive increment
in the overall economic position of the country and the incremental value of Omani GDP
indicates the high probability of positive economic position of the country. In this context,
Akimova, Stein and Prokhorova (2015) stated that with the measurement of GDP the
investment opportunity in the country is anticipated by the investors.
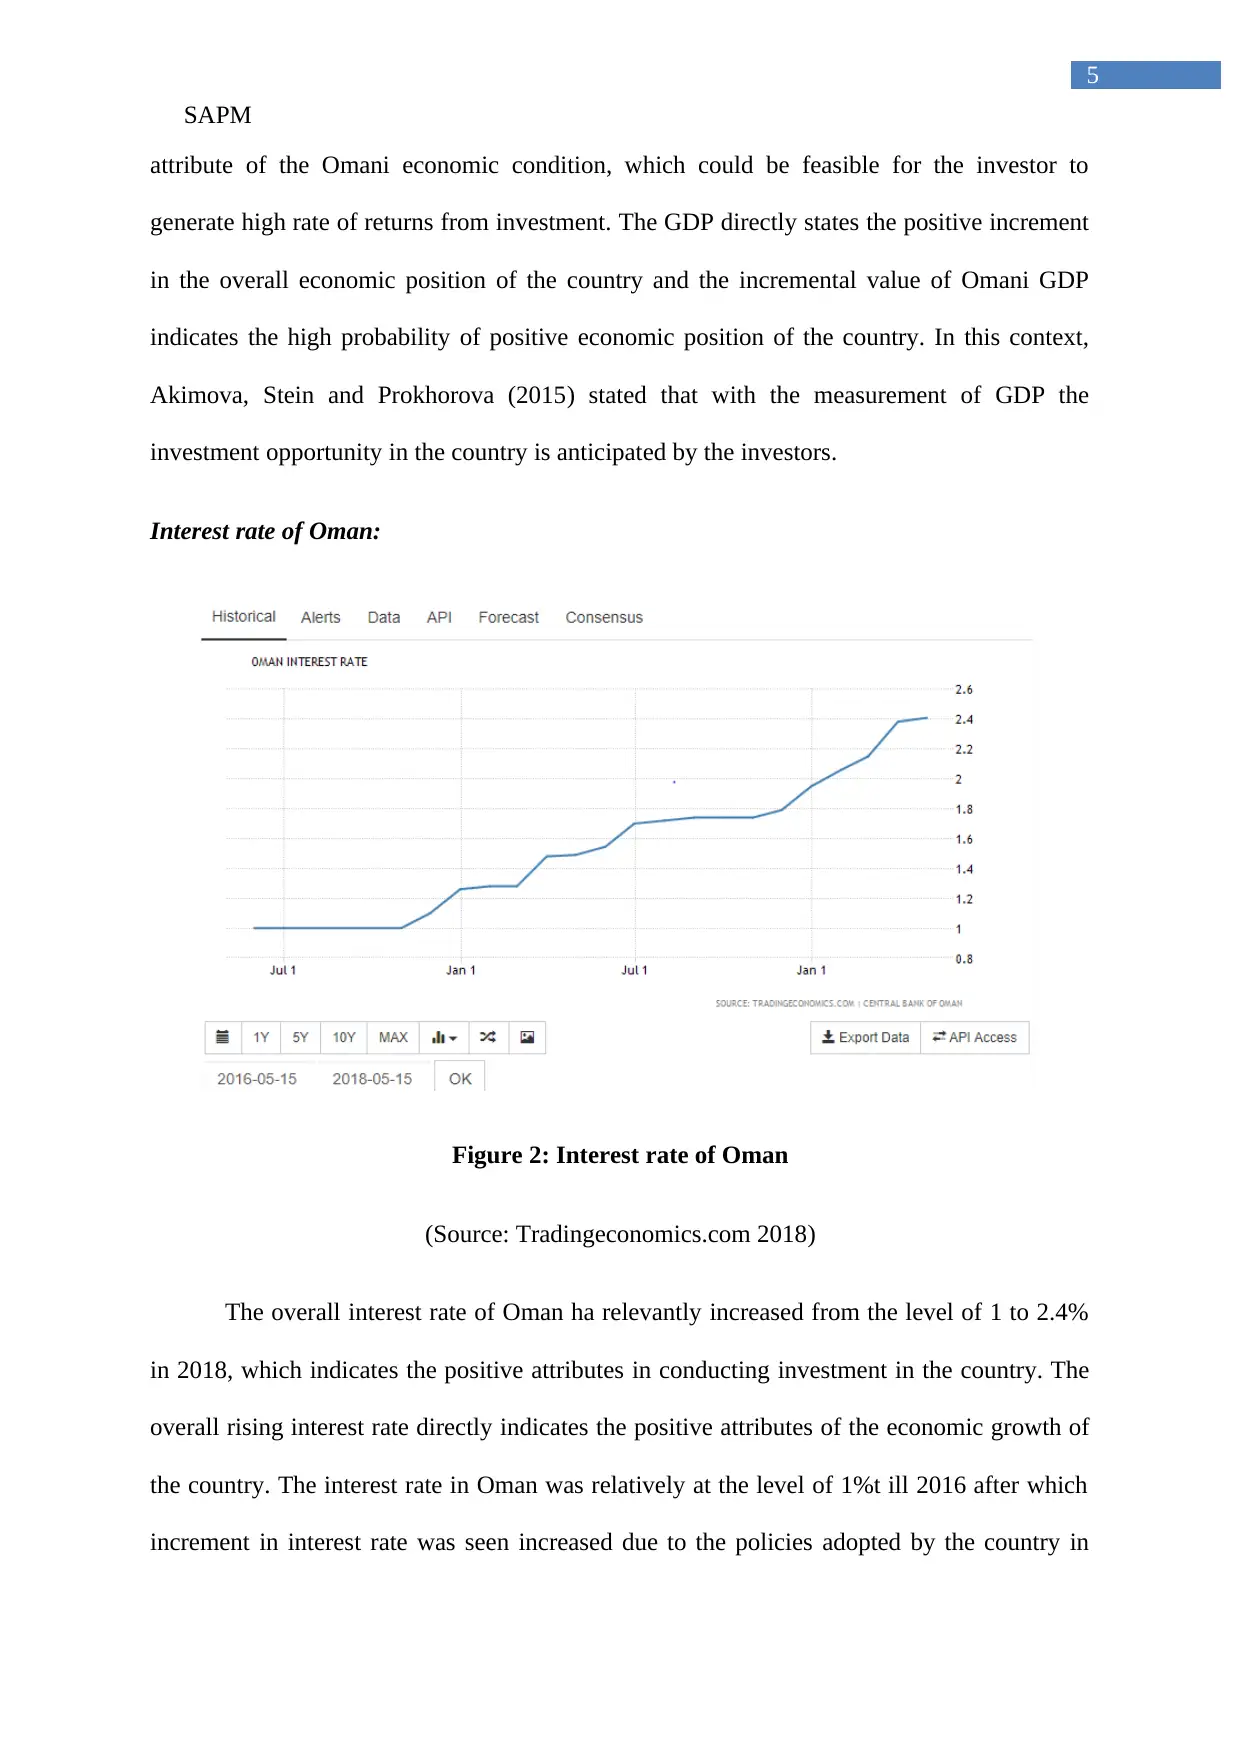
Interest rate of Oman:
Figure 2: Interest rate of Oman
(Source: Tradingeconomics.com 2018)
The overall interest rate of Oman ha relevantly increased from the level of 1 to 2.4%
in 2018, which indicates the positive attributes in conducting investment in the country. The
overall rising interest rate directly indicates the positive attributes of the economic growth of
the country. The interest rate in Oman was relatively at the level of 1%t ill 2016 after which
increment in interest rate was seen increased due to the policies adopted by the country in
5
attribute of the Omani economic condition, which could be feasible for the investor to
generate high rate of returns from investment. The GDP directly states the positive increment
in the overall economic position of the country and the incremental value of Omani GDP
indicates the high probability of positive economic position of the country. In this context,
Akimova, Stein and Prokhorova (2015) stated that with the measurement of GDP the
investment opportunity in the country is anticipated by the investors.
Interest rate of Oman:
Figure 2: Interest rate of Oman
(Source: Tradingeconomics.com 2018)
The overall interest rate of Oman ha relevantly increased from the level of 1 to 2.4%
in 2018, which indicates the positive attributes in conducting investment in the country. The
overall rising interest rate directly indicates the positive attributes of the economic growth of
the country. The interest rate in Oman was relatively at the level of 1%t ill 2016 after which
increment in interest rate was seen increased due to the policies adopted by the country in
⊘ This is a preview!⊘
Do you want full access?
Subscribe today to unlock all pages.
Trusted by 1+ million students worldwide
SAPM
6
easing their currency and creating demand for their product in the intentional market. In this
context, Krupa (2016) stated that with the investment in overall interest rates citizens are
interested in depositing more into the bank, which is used for other economy development
process by the government. However, the condition of financial sector will deteriorate, as
more interest payment will be provided to the depositors reducing their interest income.
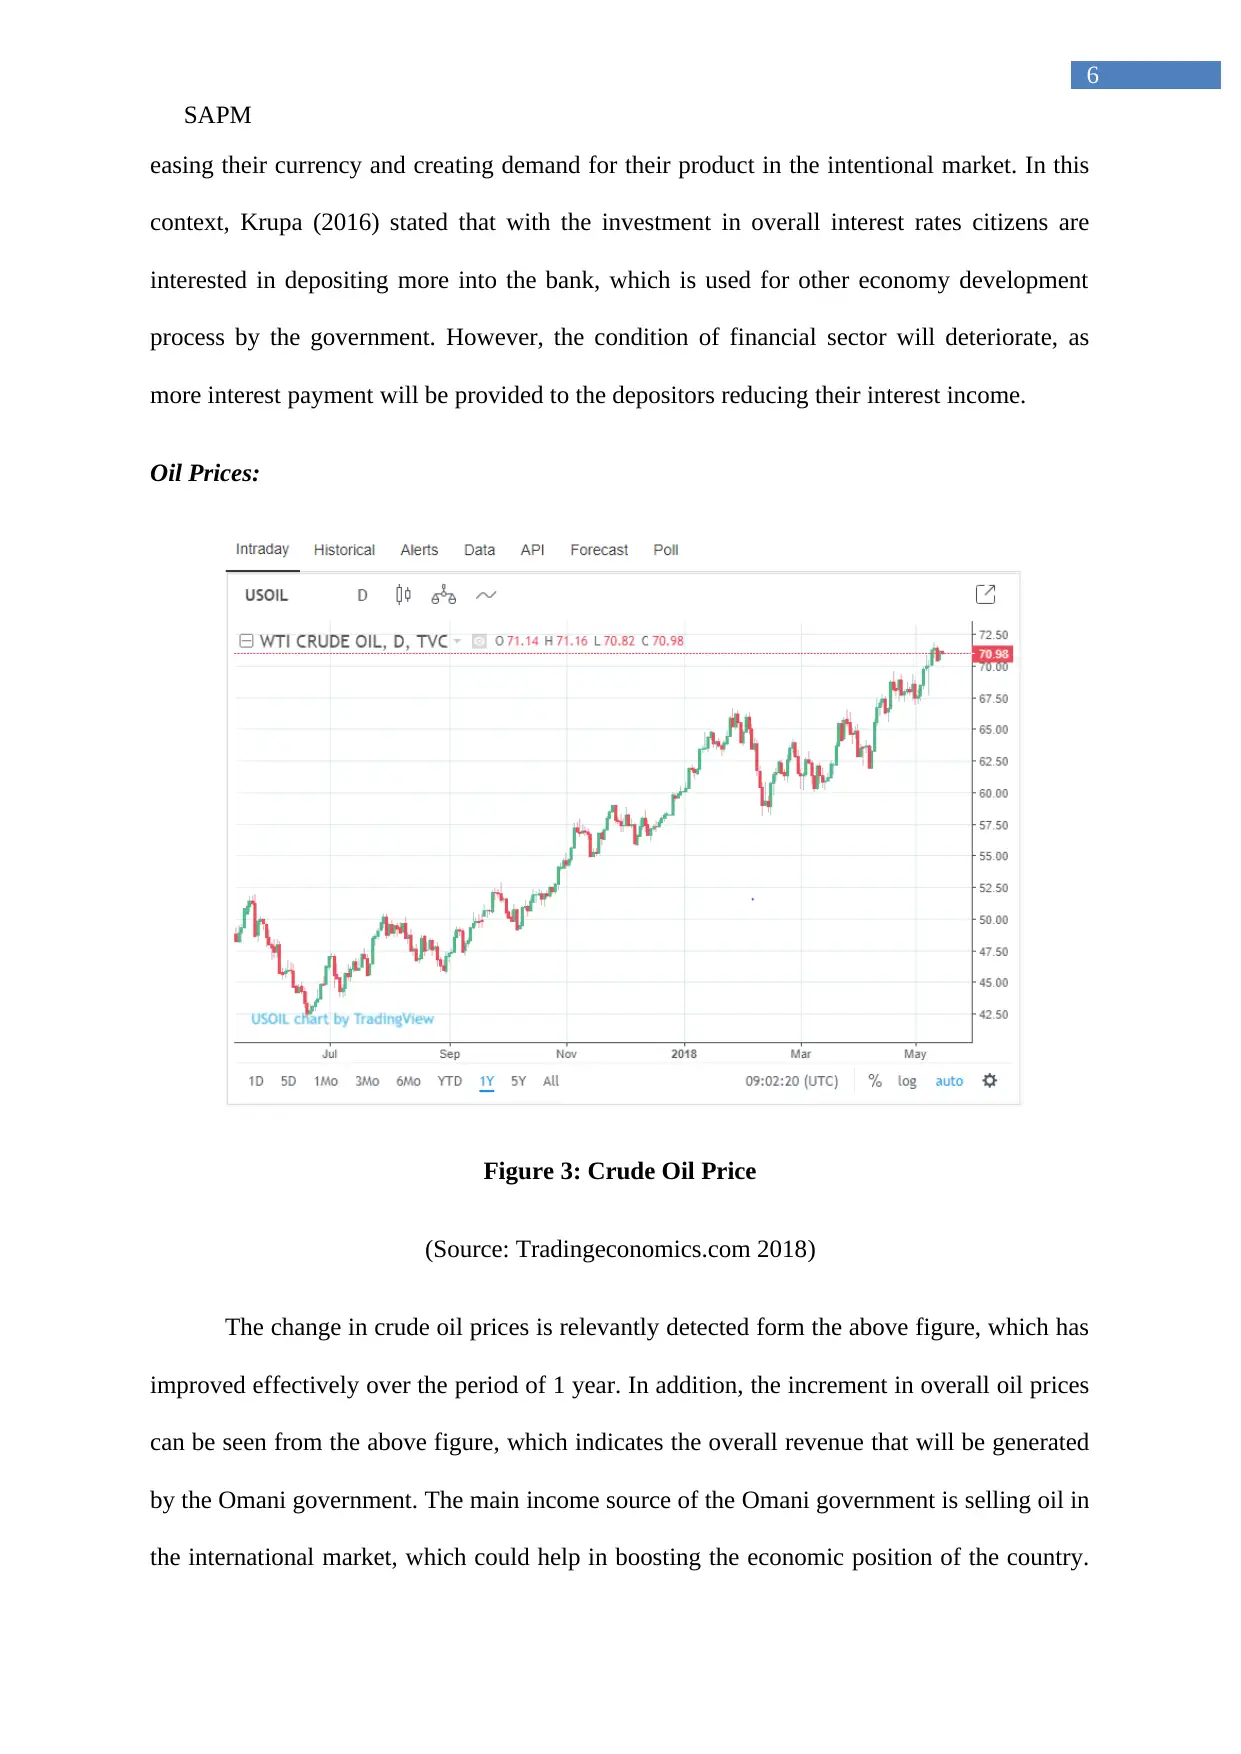
Oil Prices:
Figure 3: Crude Oil Price
(Source: Tradingeconomics.com 2018)
The change in crude oil prices is relevantly detected form the above figure, which has
improved effectively over the period of 1 year. In addition, the increment in overall oil prices
can be seen from the above figure, which indicates the overall revenue that will be generated
by the Omani government. The main income source of the Omani government is selling oil in
the international market, which could help in boosting the economic position of the country.
6
easing their currency and creating demand for their product in the intentional market. In this
context, Krupa (2016) stated that with the investment in overall interest rates citizens are
interested in depositing more into the bank, which is used for other economy development
process by the government. However, the condition of financial sector will deteriorate, as
more interest payment will be provided to the depositors reducing their interest income.
Oil Prices:
Figure 3: Crude Oil Price
(Source: Tradingeconomics.com 2018)
The change in crude oil prices is relevantly detected form the above figure, which has
improved effectively over the period of 1 year. In addition, the increment in overall oil prices
can be seen from the above figure, which indicates the overall revenue that will be generated
by the Omani government. The main income source of the Omani government is selling oil in
the international market, which could help in boosting the economic position of the country.
Paraphrase This Document
Need a fresh take? Get an instant paraphrase of this document with our AI Paraphraser
SAPM
7
The crude oil price in the international market has relevantly increased over time, which
indicates the high level of income generated by the government. This could be used in
infrastructure and capital expenditure, which is being conducted by the country. This positive
trend in the oil market relevantly indicates the uptrend in the oil market, which could allow
the Omani government to maximise their profit from operations. Therefore, the positive
attributes of the Omani economy can be anticipated from the overall evaluation of the oil
prices, interest rates and GDP of the country (Sullivan and Mackenzie 2017).
Industry Analysis:
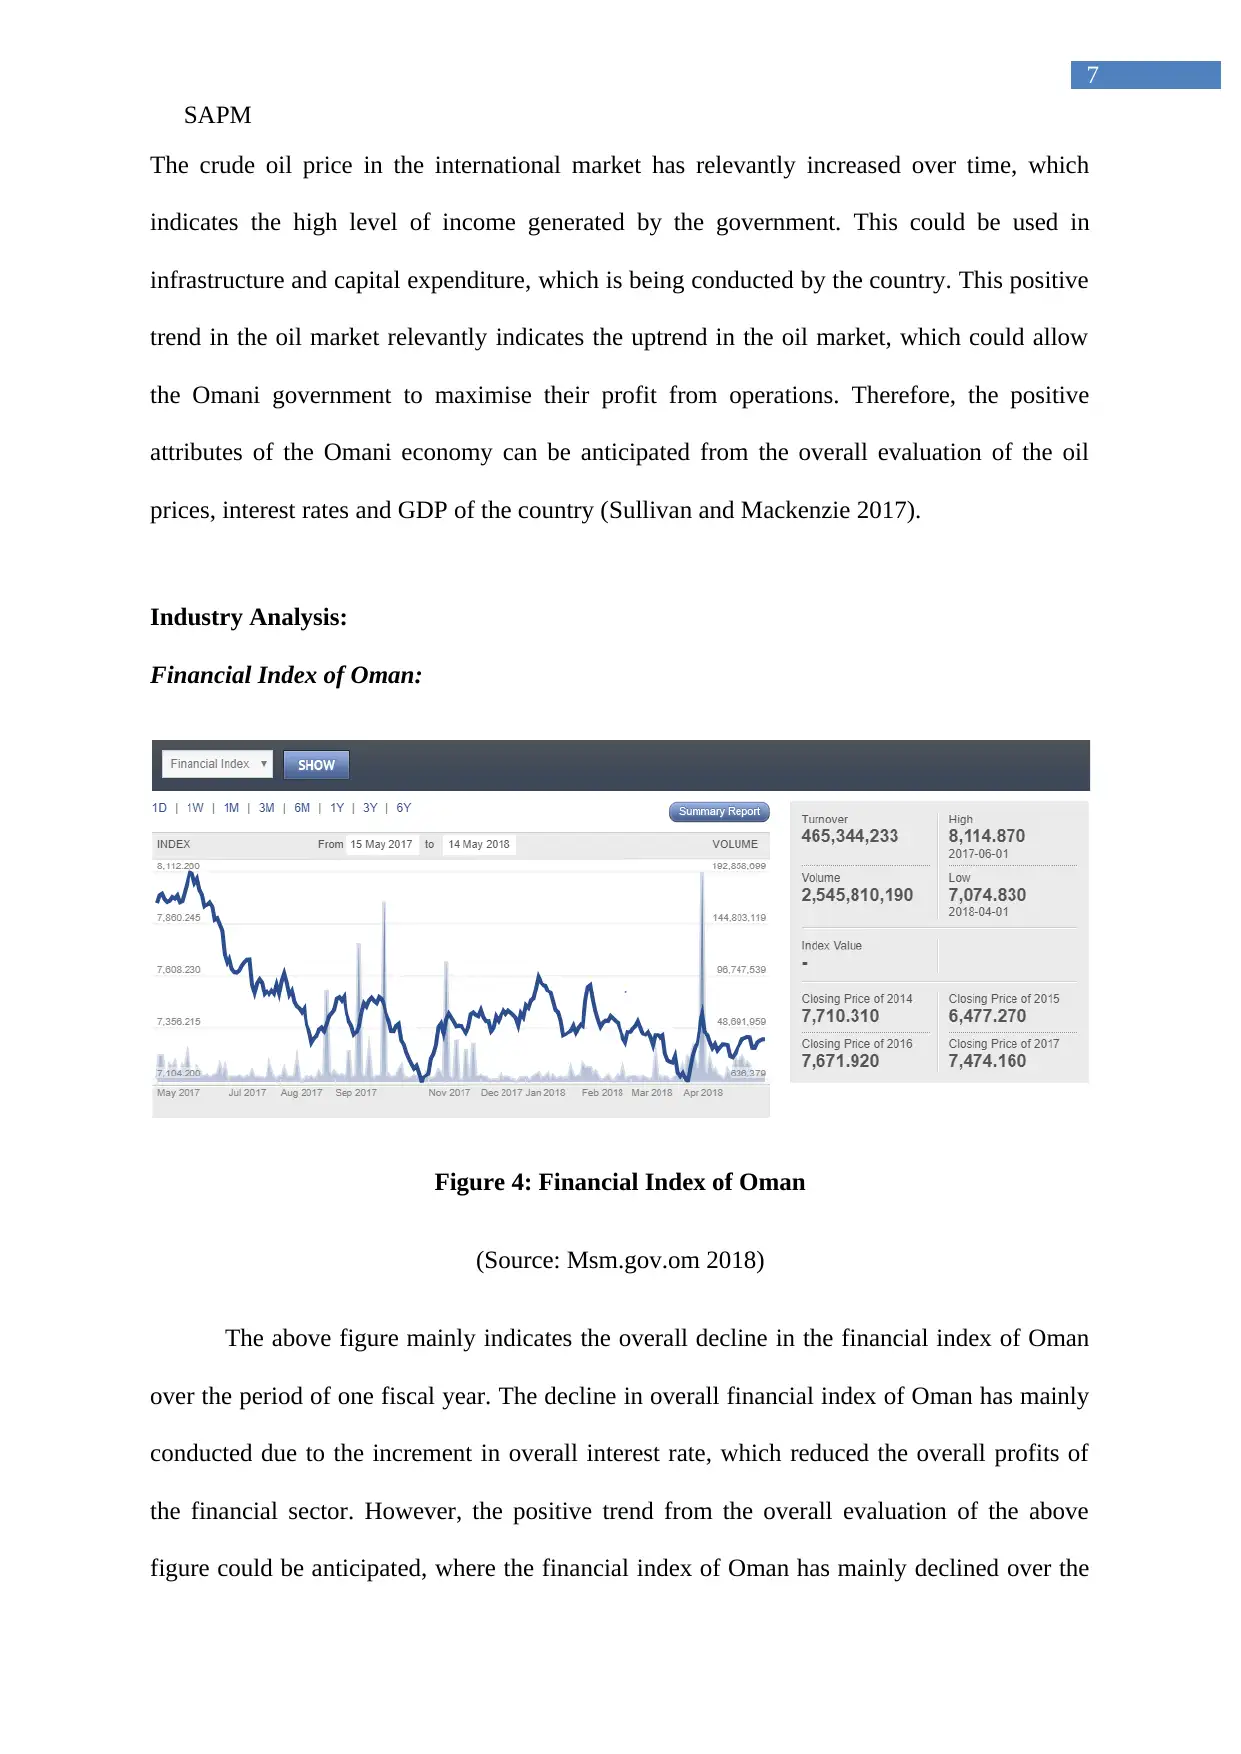
Financial Index of Oman:
Figure 4: Financial Index of Oman
(Source: Msm.gov.om 2018)
The above figure mainly indicates the overall decline in the financial index of Oman
over the period of one fiscal year. The decline in overall financial index of Oman has mainly
conducted due to the increment in overall interest rate, which reduced the overall profits of
the financial sector. However, the positive trend from the overall evaluation of the above
figure could be anticipated, where the financial index of Oman has mainly declined over the
7
The crude oil price in the international market has relevantly increased over time, which
indicates the high level of income generated by the government. This could be used in
infrastructure and capital expenditure, which is being conducted by the country. This positive
trend in the oil market relevantly indicates the uptrend in the oil market, which could allow
the Omani government to maximise their profit from operations. Therefore, the positive
attributes of the Omani economy can be anticipated from the overall evaluation of the oil
prices, interest rates and GDP of the country (Sullivan and Mackenzie 2017).
Industry Analysis:
Financial Index of Oman:
Figure 4: Financial Index of Oman
(Source: Msm.gov.om 2018)
The above figure mainly indicates the overall decline in the financial index of Oman
over the period of one fiscal year. The decline in overall financial index of Oman has mainly
conducted due to the increment in overall interest rate, which reduced the overall profits of
the financial sector. However, the positive trend from the overall evaluation of the above
figure could be anticipated, where the financial index of Oman has mainly declined over the
SAPM
8
period. Koo (2017) stated the continuous decline in share price of the organisation mainly
indicates a downtrend in the market, which will have negative impact on financial revenue
generation capability of the investors. Moreover, the financial sector index of the country has
directly shown the possibility of stagnation in the market, while no further decline in prices is
seen. This indicates the positive attribute of the financial sector, which could allow investor
in maximining profits from investment.
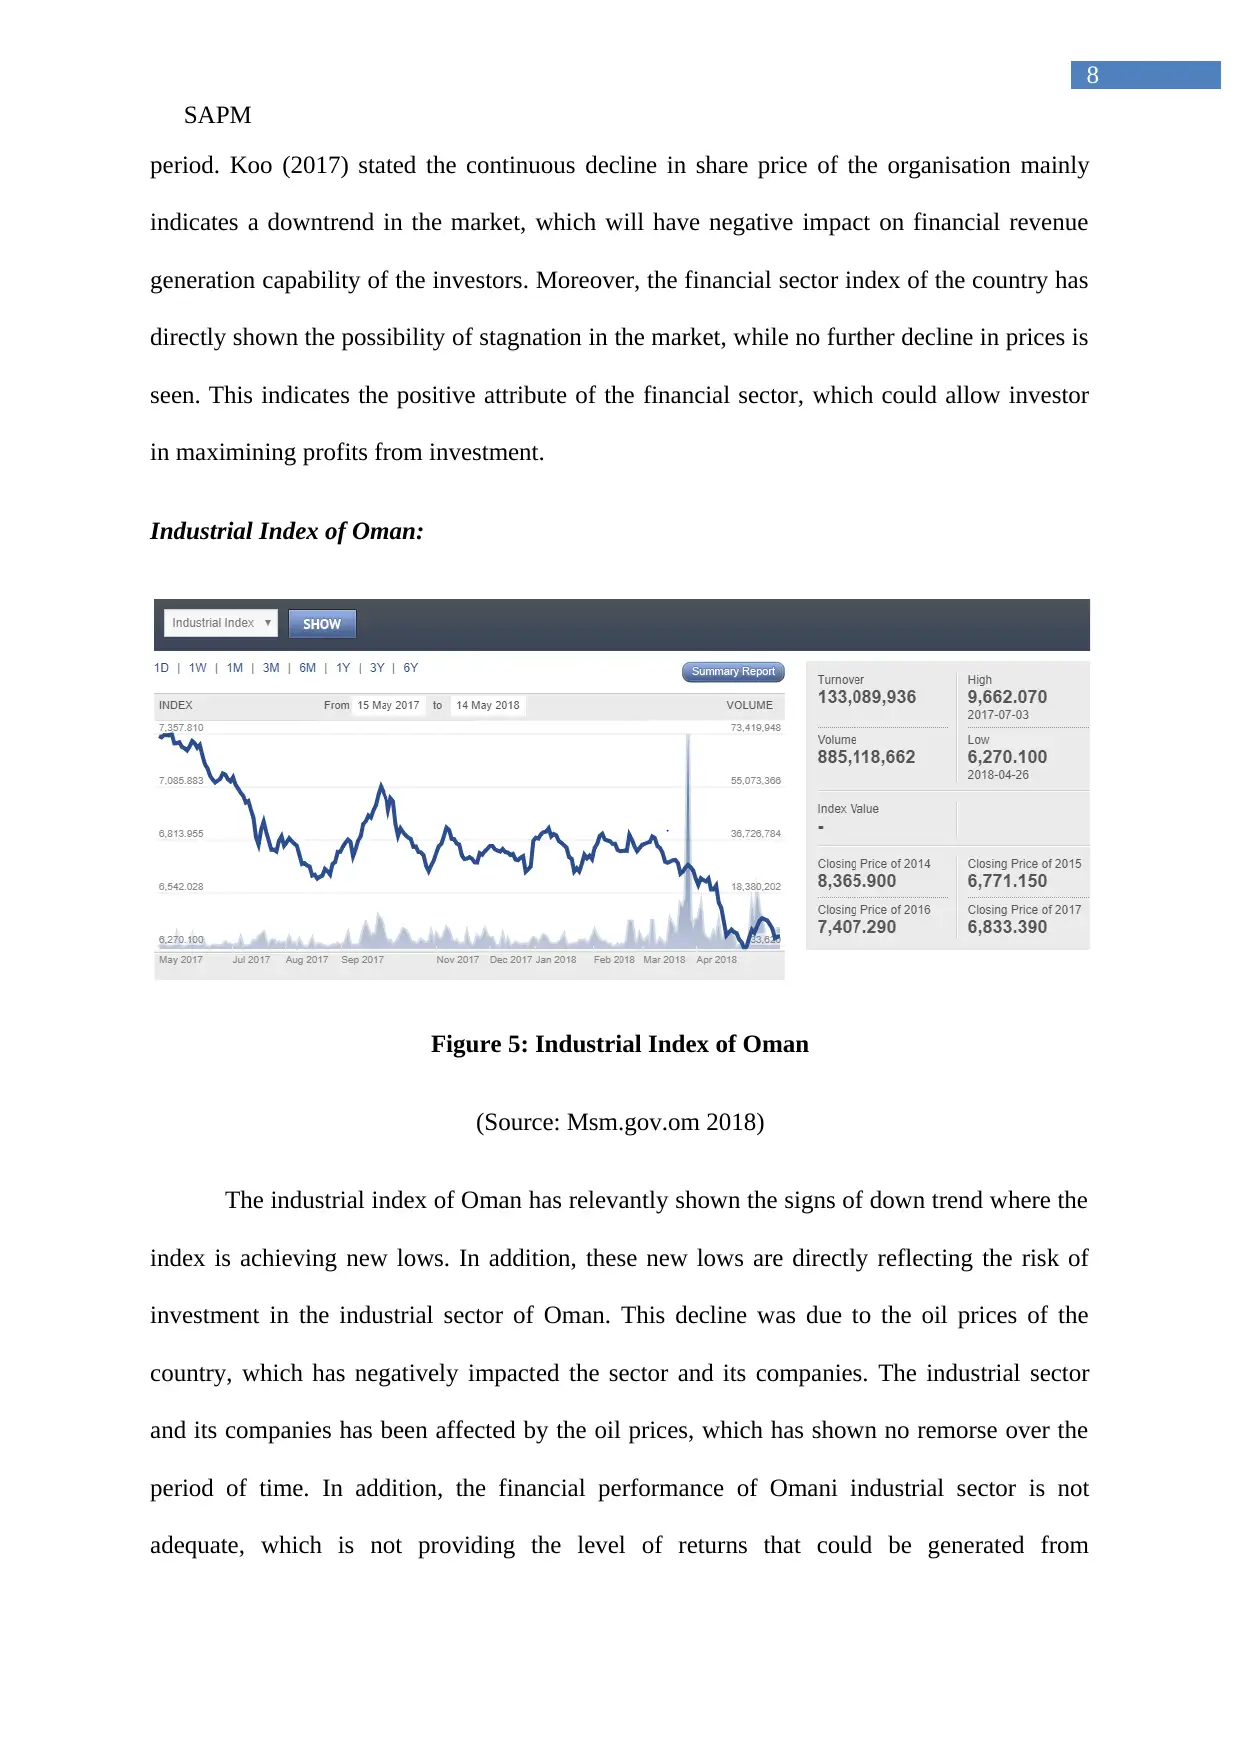
Industrial Index of Oman:
Figure 5: Industrial Index of Oman
(Source: Msm.gov.om 2018)
The industrial index of Oman has relevantly shown the signs of down trend where the
index is achieving new lows. In addition, these new lows are directly reflecting the risk of
investment in the industrial sector of Oman. This decline was due to the oil prices of the
country, which has negatively impacted the sector and its companies. The industrial sector
and its companies has been affected by the oil prices, which has shown no remorse over the
period of time. In addition, the financial performance of Omani industrial sector is not
adequate, which is not providing the level of returns that could be generated from
8
period. Koo (2017) stated the continuous decline in share price of the organisation mainly
indicates a downtrend in the market, which will have negative impact on financial revenue
generation capability of the investors. Moreover, the financial sector index of the country has
directly shown the possibility of stagnation in the market, while no further decline in prices is
seen. This indicates the positive attribute of the financial sector, which could allow investor
in maximining profits from investment.
Industrial Index of Oman:
Figure 5: Industrial Index of Oman
(Source: Msm.gov.om 2018)
The industrial index of Oman has relevantly shown the signs of down trend where the
index is achieving new lows. In addition, these new lows are directly reflecting the risk of
investment in the industrial sector of Oman. This decline was due to the oil prices of the
country, which has negatively impacted the sector and its companies. The industrial sector
and its companies has been affected by the oil prices, which has shown no remorse over the
period of time. In addition, the financial performance of Omani industrial sector is not
adequate, which is not providing the level of returns that could be generated from
⊘ This is a preview!⊘
Do you want full access?
Subscribe today to unlock all pages.
Trusted by 1+ million students worldwide
SAPM
9
investments, due to the continuous decline in the share price. Therefore, the investors should
ignore the investment scope in companies that are listed in the industrial sector of Oman.
Altuntas and Dereli (2015) stated that investor by using trend analysis is able to identify the
viability of the sector and estimate its overall progress in future.
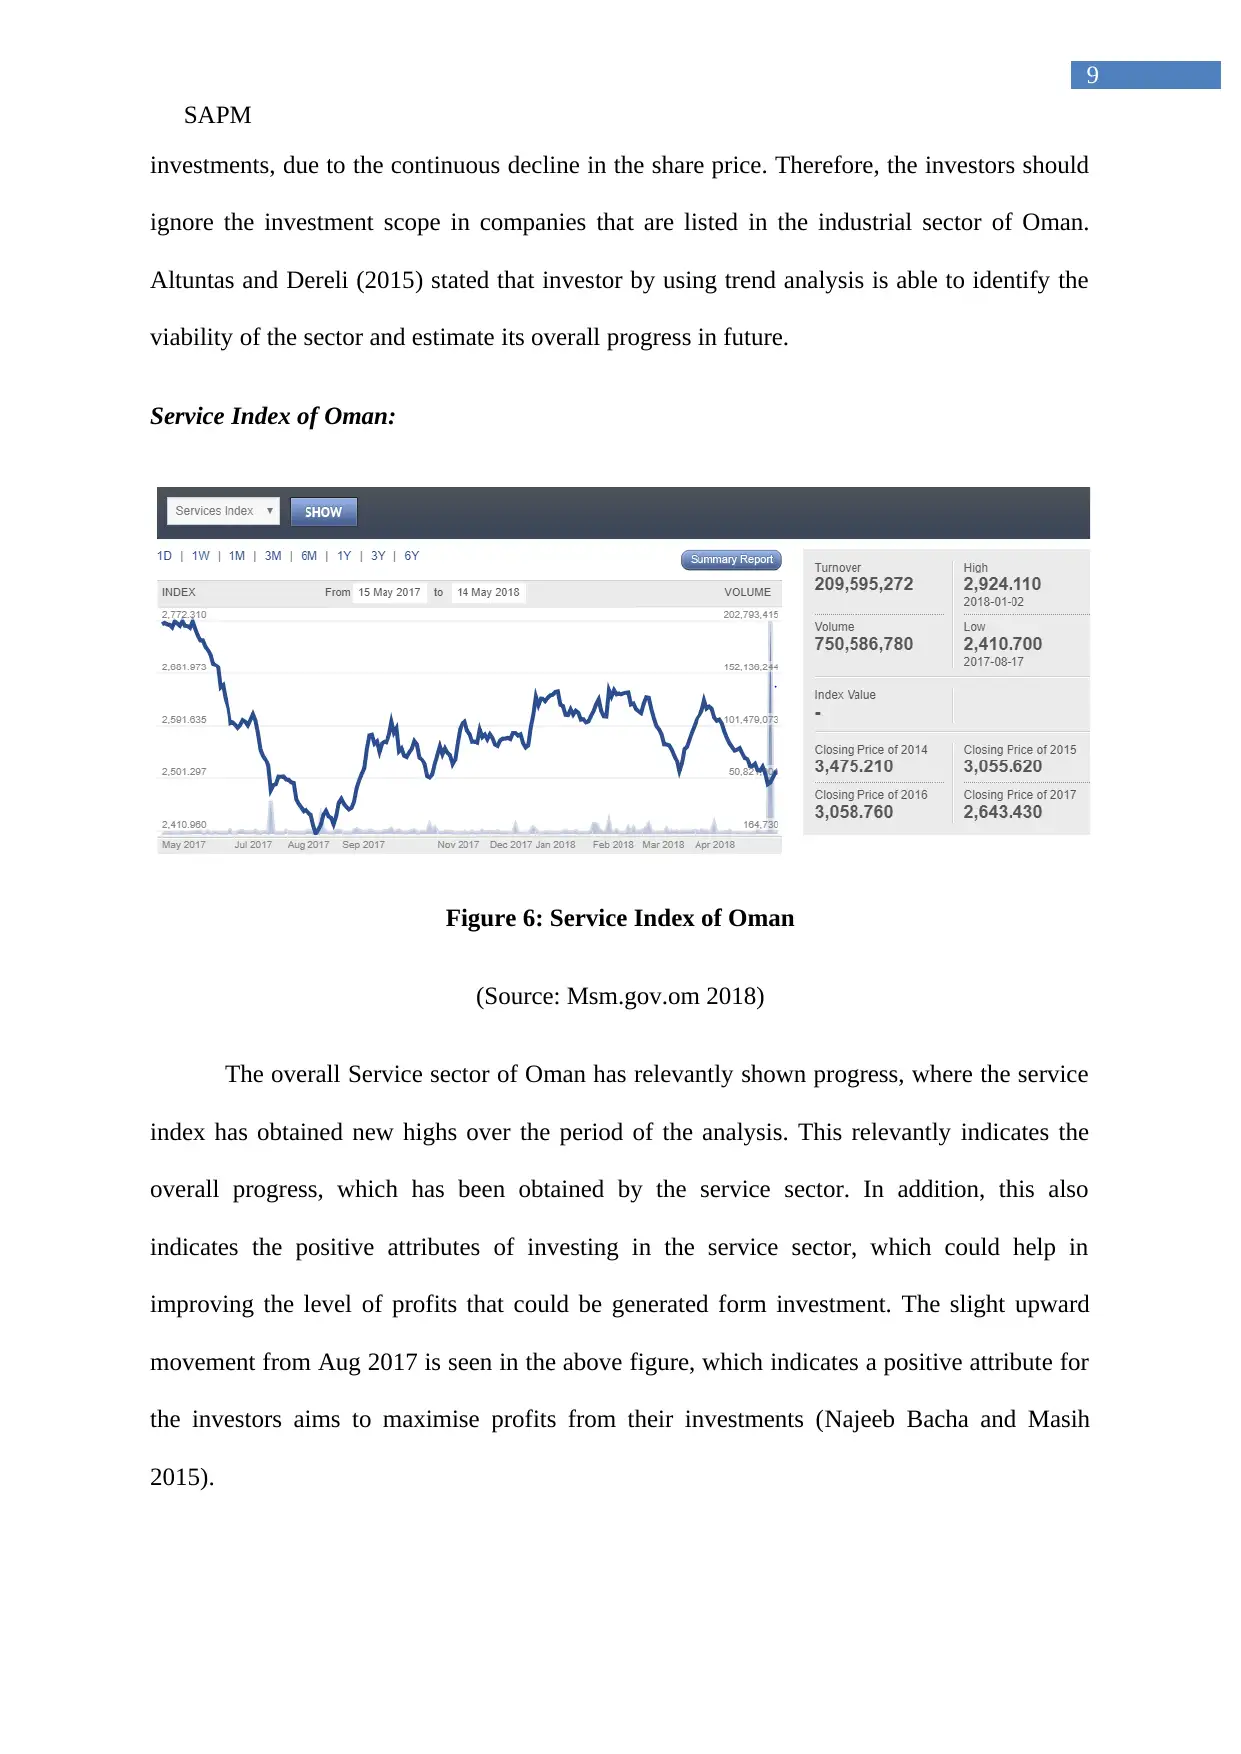
Service Index of Oman:
Figure 6: Service Index of Oman
(Source: Msm.gov.om 2018)
The overall Service sector of Oman has relevantly shown progress, where the service
index has obtained new highs over the period of the analysis. This relevantly indicates the
overall progress, which has been obtained by the service sector. In addition, this also
indicates the positive attributes of investing in the service sector, which could help in
improving the level of profits that could be generated form investment. The slight upward
movement from Aug 2017 is seen in the above figure, which indicates a positive attribute for
the investors aims to maximise profits from their investments (Najeeb Bacha and Masih
2015).
9
investments, due to the continuous decline in the share price. Therefore, the investors should
ignore the investment scope in companies that are listed in the industrial sector of Oman.
Altuntas and Dereli (2015) stated that investor by using trend analysis is able to identify the
viability of the sector and estimate its overall progress in future.
Service Index of Oman:
Figure 6: Service Index of Oman
(Source: Msm.gov.om 2018)
The overall Service sector of Oman has relevantly shown progress, where the service
index has obtained new highs over the period of the analysis. This relevantly indicates the
overall progress, which has been obtained by the service sector. In addition, this also
indicates the positive attributes of investing in the service sector, which could help in
improving the level of profits that could be generated form investment. The slight upward
movement from Aug 2017 is seen in the above figure, which indicates a positive attribute for
the investors aims to maximise profits from their investments (Najeeb Bacha and Masih
2015).
Paraphrase This Document
Need a fresh take? Get an instant paraphrase of this document with our AI Paraphraser
SAPM
10
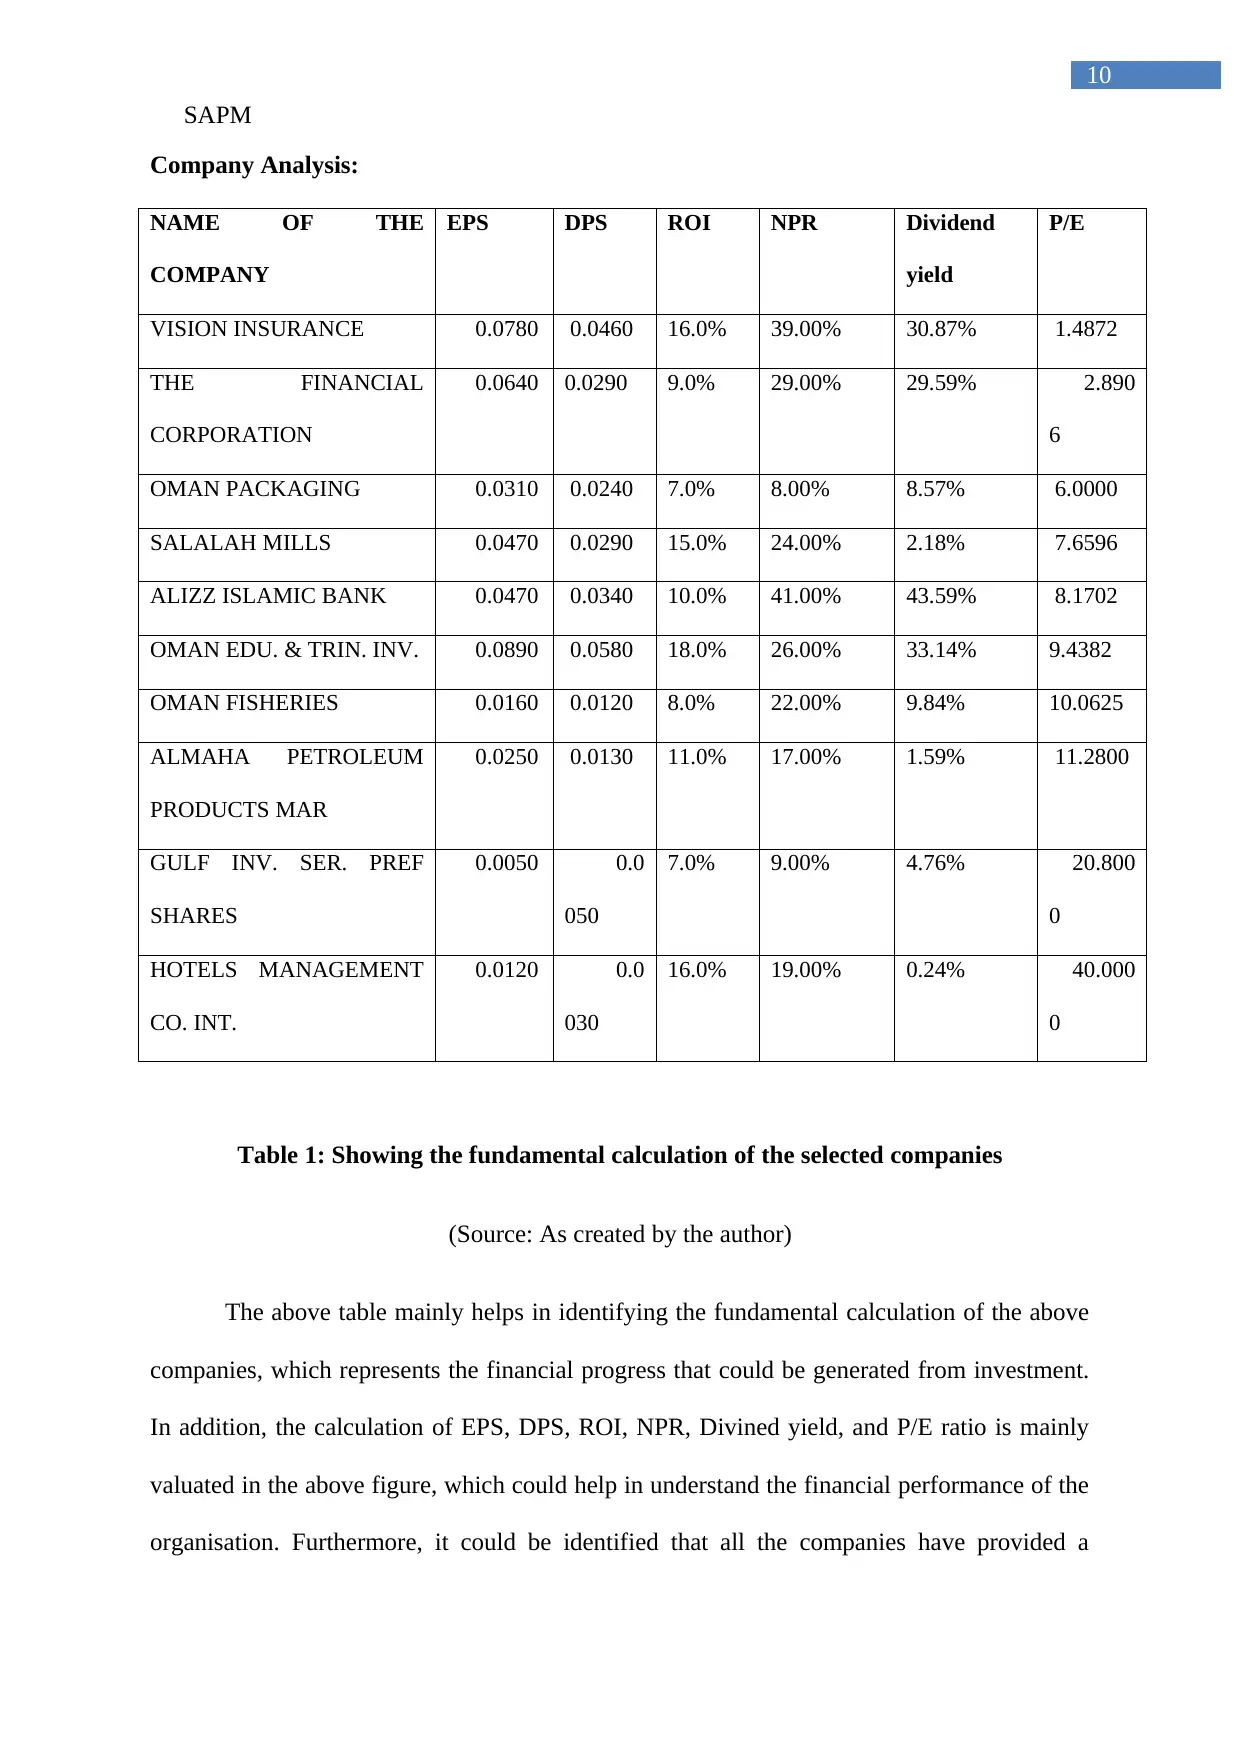
Company Analysis:
NAME OF THE
COMPANY
EPS DPS ROI NPR Dividend
yield
P/E
VISION INSURANCE 0.0780 0.0460 16.0% 39.00% 30.87% 1.4872
THE FINANCIAL
CORPORATION
0.0640 0.0290 9.0% 29.00% 29.59% 2.890
6
OMAN PACKAGING 0.0310 0.0240 7.0% 8.00% 8.57% 6.0000
SALALAH MILLS 0.0470 0.0290 15.0% 24.00% 2.18% 7.6596
ALIZZ ISLAMIC BANK 0.0470 0.0340 10.0% 41.00% 43.59% 8.1702
OMAN EDU. & TRIN. INV. 0.0890 0.0580 18.0% 26.00% 33.14% 9.4382
OMAN FISHERIES 0.0160 0.0120 8.0% 22.00% 9.84% 10.0625
ALMAHA PETROLEUM
PRODUCTS MAR
0.0250 0.0130 11.0% 17.00% 1.59% 11.2800
GULF INV. SER. PREF
SHARES
0.0050 0.0
050
7.0% 9.00% 4.76% 20.800
0
HOTELS MANAGEMENT
CO. INT.
0.0120 0.0
030
16.0% 19.00% 0.24% 40.000
0
Table 1: Showing the fundamental calculation of the selected companies
(Source: As created by the author)
The above table mainly helps in identifying the fundamental calculation of the above
companies, which represents the financial progress that could be generated from investment.
In addition, the calculation of EPS, DPS, ROI, NPR, Divined yield, and P/E ratio is mainly
valuated in the above figure, which could help in understand the financial performance of the
organisation. Furthermore, it could be identified that all the companies have provided a
10
Company Analysis:
NAME OF THE
COMPANY
EPS DPS ROI NPR Dividend
yield
P/E
VISION INSURANCE 0.0780 0.0460 16.0% 39.00% 30.87% 1.4872
THE FINANCIAL
CORPORATION
0.0640 0.0290 9.0% 29.00% 29.59% 2.890
6
OMAN PACKAGING 0.0310 0.0240 7.0% 8.00% 8.57% 6.0000
SALALAH MILLS 0.0470 0.0290 15.0% 24.00% 2.18% 7.6596
ALIZZ ISLAMIC BANK 0.0470 0.0340 10.0% 41.00% 43.59% 8.1702
OMAN EDU. & TRIN. INV. 0.0890 0.0580 18.0% 26.00% 33.14% 9.4382
OMAN FISHERIES 0.0160 0.0120 8.0% 22.00% 9.84% 10.0625
ALMAHA PETROLEUM
PRODUCTS MAR
0.0250 0.0130 11.0% 17.00% 1.59% 11.2800
GULF INV. SER. PREF
SHARES
0.0050 0.0
050
7.0% 9.00% 4.76% 20.800
0
HOTELS MANAGEMENT
CO. INT.
0.0120 0.0
030
16.0% 19.00% 0.24% 40.000
0
Table 1: Showing the fundamental calculation of the selected companies
(Source: As created by the author)
The above table mainly helps in identifying the fundamental calculation of the above
companies, which represents the financial progress that could be generated from investment.
In addition, the calculation of EPS, DPS, ROI, NPR, Divined yield, and P/E ratio is mainly
valuated in the above figure, which could help in understand the financial performance of the
organisation. Furthermore, it could be identified that all the companies have provided a
SAPM
11
positive dividend yield, NPR, and ROI, which could help in generating high level of returns.
This relevantly indicates the positive attributes of the companies chosen for investing in
Oman, which could help in generating high level of returns from investment. In this context,
Boyd, Epanchin-Niell and Siikamaki (2015) stated that investors using fundamental analysis
are able to identify the investment opportunity, which could help in generating high level of
returns from investment. On the other hand, Al-Smadi (2018) criticise that fundamental
analysis is not able to comprehend the short-term trend of the stock, while raising the level of
risk from investment. Therefore, from the overall evaluation financial viability of the
investment could be identified.
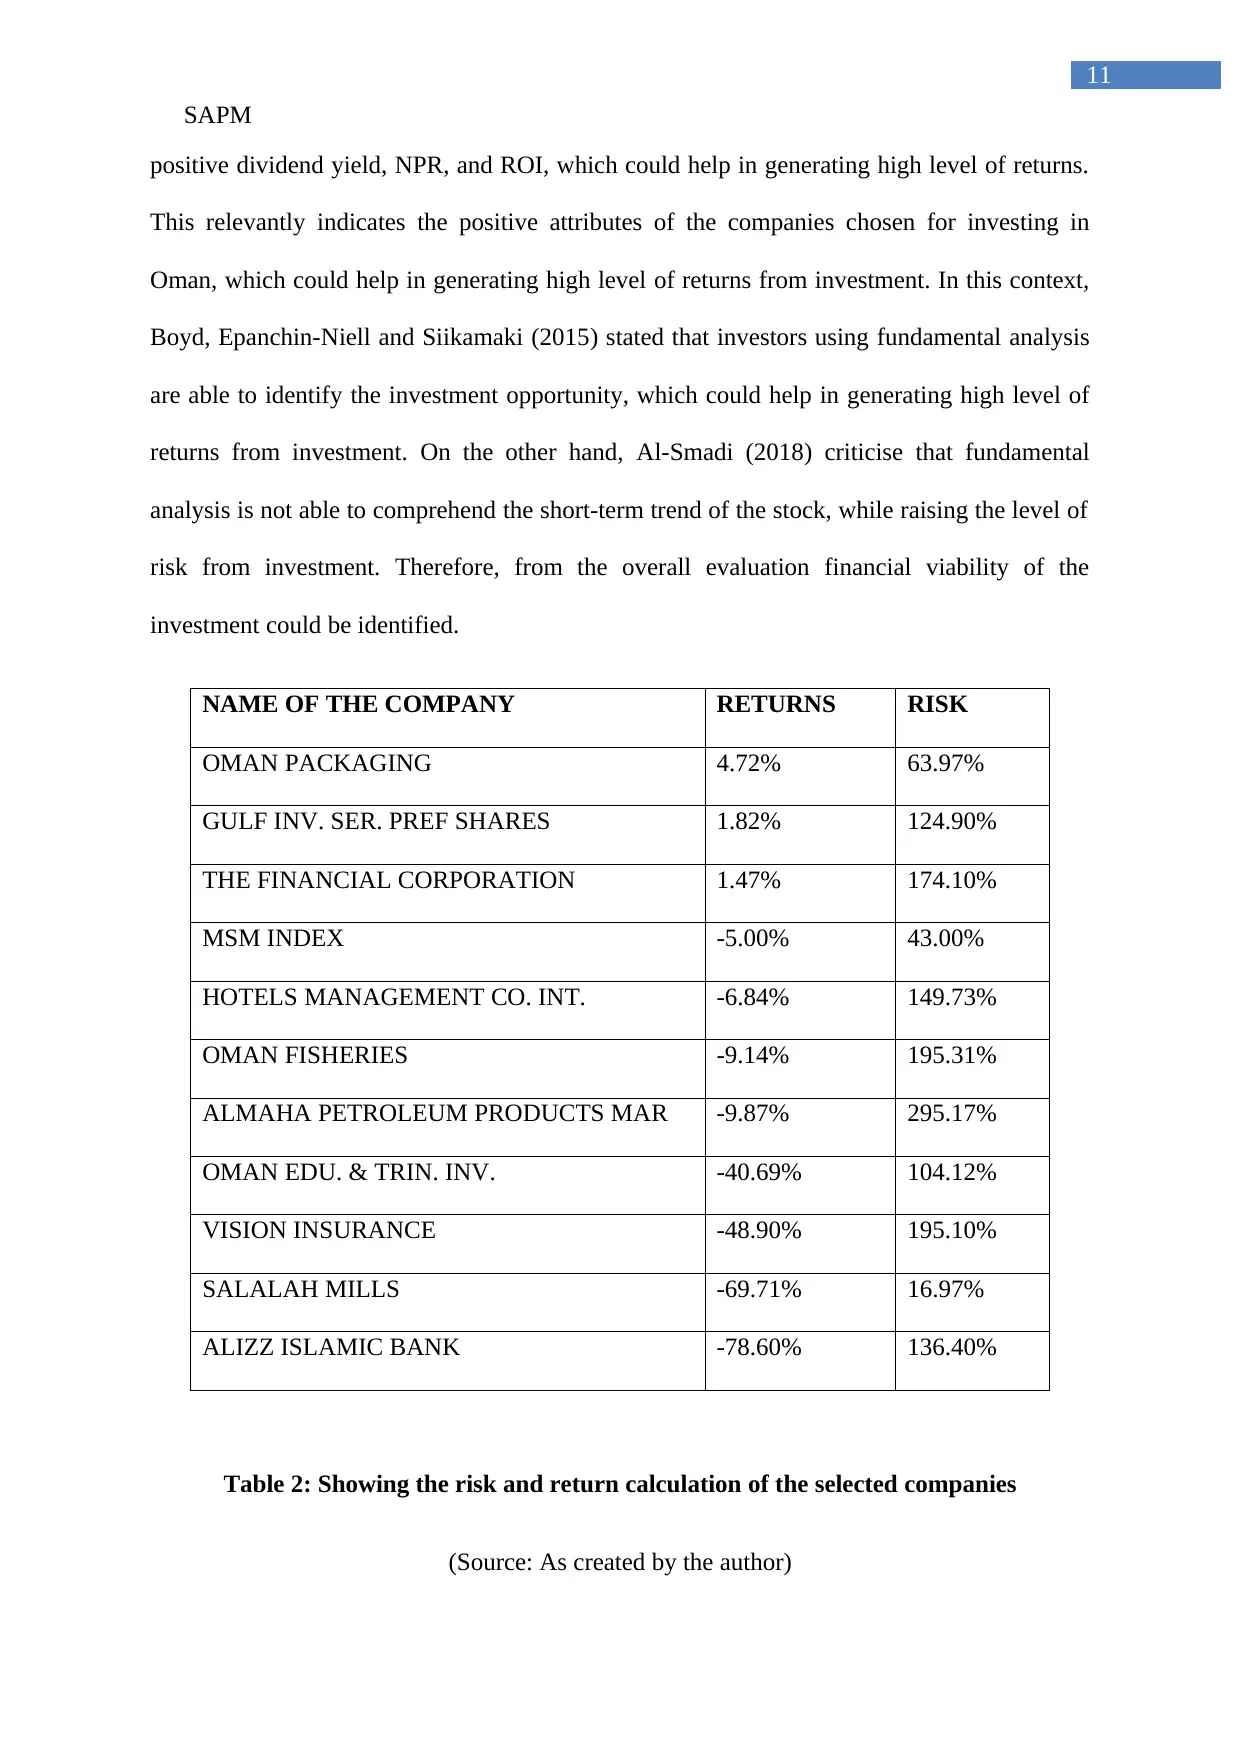
NAME OF THE COMPANY RETURNS RISK
OMAN PACKAGING 4.72% 63.97%
GULF INV. SER. PREF SHARES 1.82% 124.90%
THE FINANCIAL CORPORATION 1.47% 174.10%
MSM INDEX -5.00% 43.00%
HOTELS MANAGEMENT CO. INT. -6.84% 149.73%
OMAN FISHERIES -9.14% 195.31%
ALMAHA PETROLEUM PRODUCTS MAR -9.87% 295.17%
OMAN EDU. & TRIN. INV. -40.69% 104.12%
VISION INSURANCE -48.90% 195.10%
SALALAH MILLS -69.71% 16.97%
ALIZZ ISLAMIC BANK -78.60% 136.40%
Table 2: Showing the risk and return calculation of the selected companies
(Source: As created by the author)
11
positive dividend yield, NPR, and ROI, which could help in generating high level of returns.
This relevantly indicates the positive attributes of the companies chosen for investing in
Oman, which could help in generating high level of returns from investment. In this context,
Boyd, Epanchin-Niell and Siikamaki (2015) stated that investors using fundamental analysis
are able to identify the investment opportunity, which could help in generating high level of
returns from investment. On the other hand, Al-Smadi (2018) criticise that fundamental
analysis is not able to comprehend the short-term trend of the stock, while raising the level of
risk from investment. Therefore, from the overall evaluation financial viability of the
investment could be identified.
NAME OF THE COMPANY RETURNS RISK
OMAN PACKAGING 4.72% 63.97%
GULF INV. SER. PREF SHARES 1.82% 124.90%
THE FINANCIAL CORPORATION 1.47% 174.10%
MSM INDEX -5.00% 43.00%
HOTELS MANAGEMENT CO. INT. -6.84% 149.73%
OMAN FISHERIES -9.14% 195.31%
ALMAHA PETROLEUM PRODUCTS MAR -9.87% 295.17%
OMAN EDU. & TRIN. INV. -40.69% 104.12%
VISION INSURANCE -48.90% 195.10%
SALALAH MILLS -69.71% 16.97%
ALIZZ ISLAMIC BANK -78.60% 136.40%
Table 2: Showing the risk and return calculation of the selected companies
(Source: As created by the author)
⊘ This is a preview!⊘
Do you want full access?
Subscribe today to unlock all pages.
Trusted by 1+ million students worldwide
1 out of 17
Related Documents


Your All-in-One AI-Powered Toolkit for Academic Success.
+13062052269
info@desklib.com
Available 24*7 on WhatsApp / Email
![[object Object]](/_next/static/media/star-bottom.7253800d.svg)
Unlock your academic potential
Copyright © 2020–2026 A2Z Services. All Rights Reserved. Developed and managed by ZUCOL.