Economics Report: Regression Analysis of Online University Data
VerifiedAdded on  2023/04/22
|8
|1702
|269
Report
AI Summary
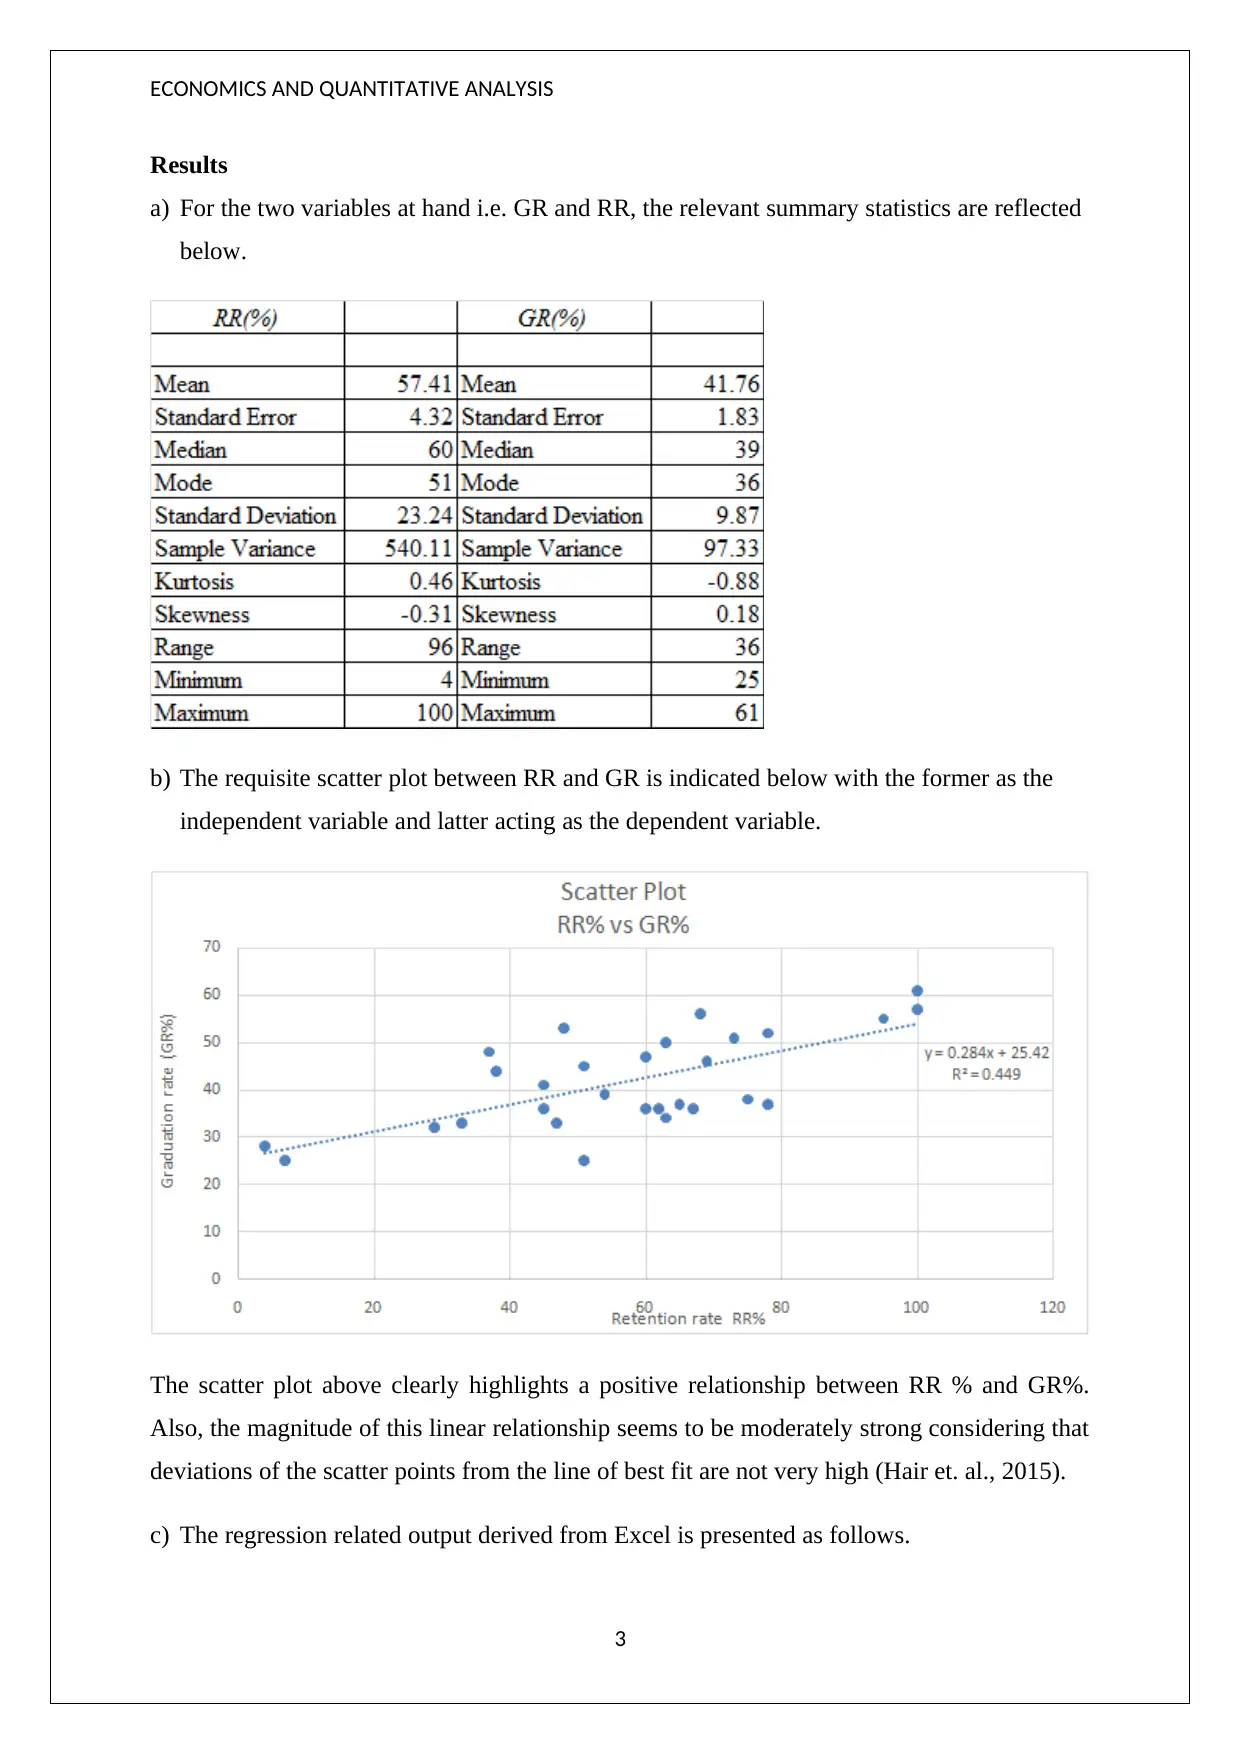
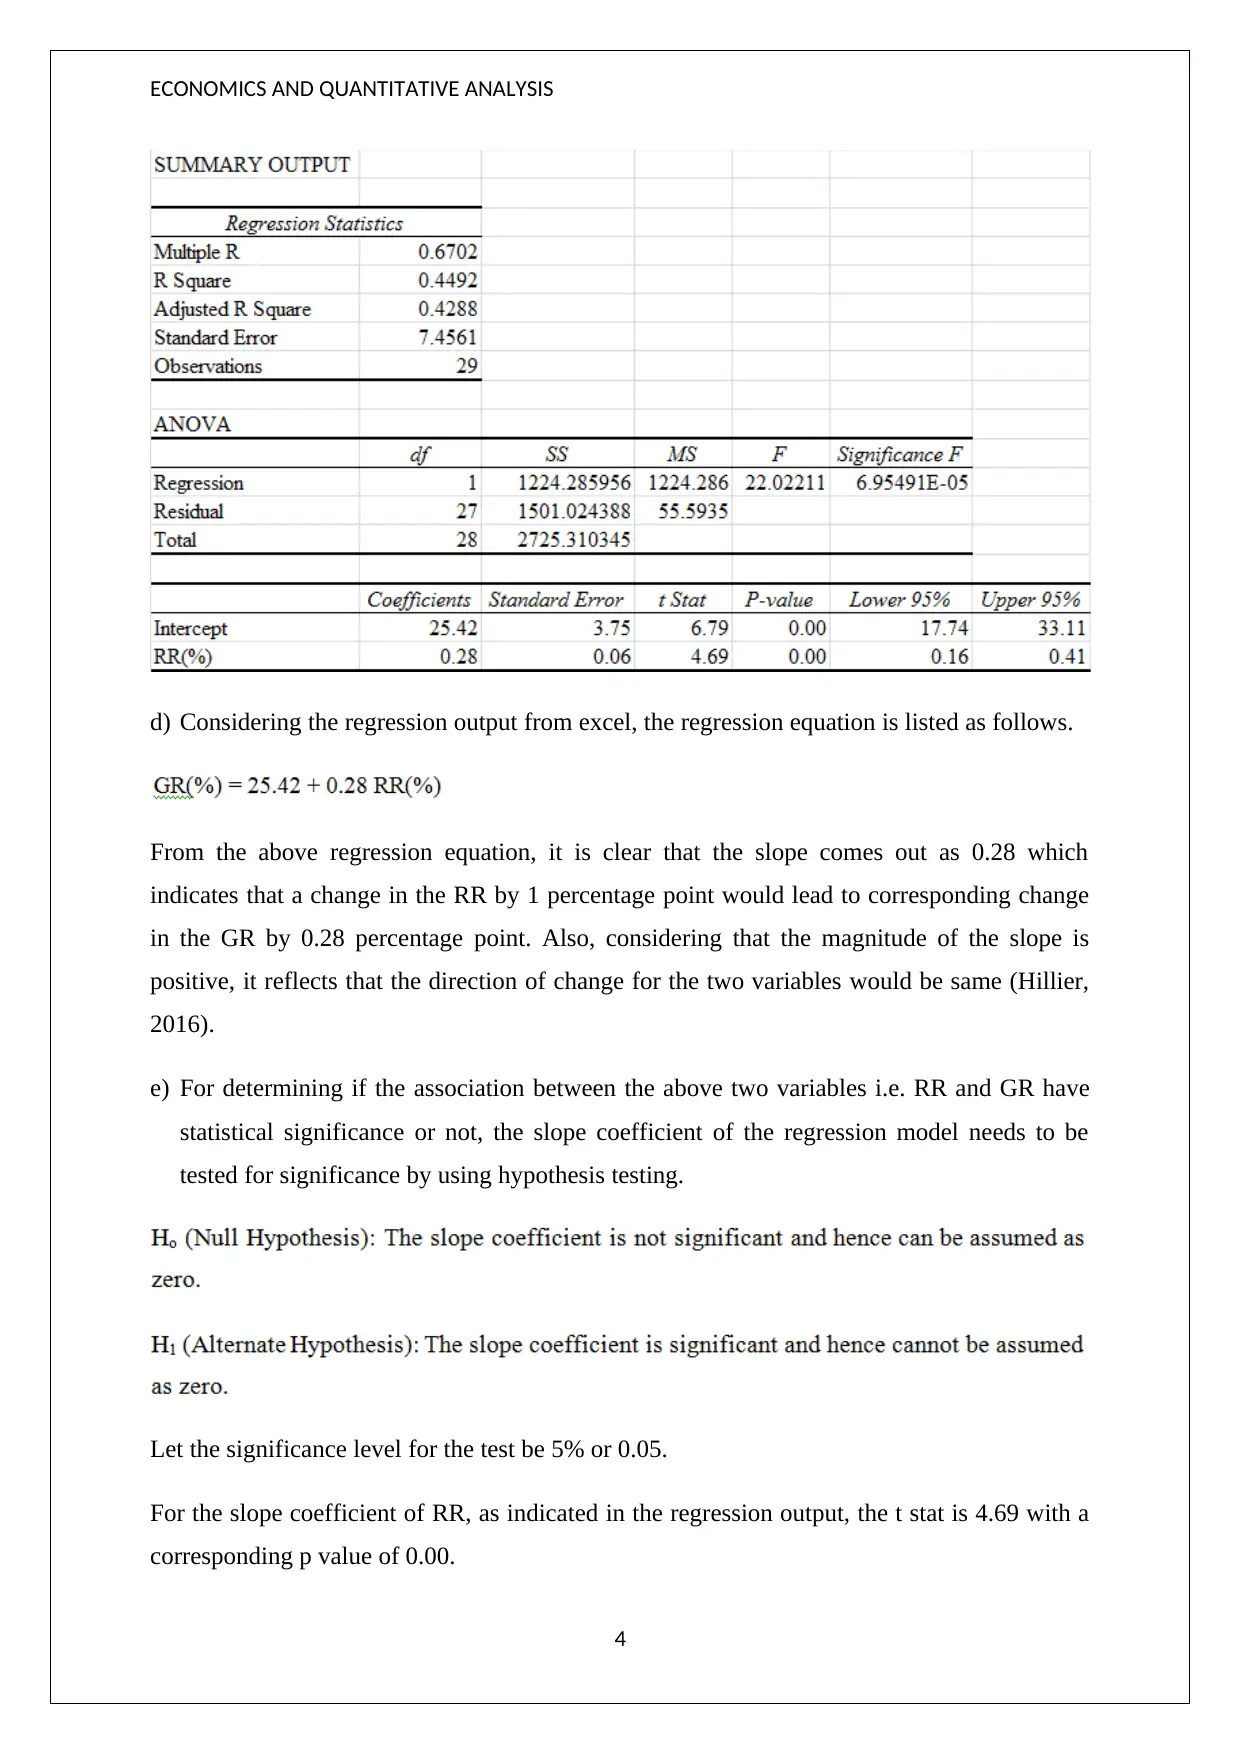
This report presents a quantitative analysis of US online universities, focusing on the relationship between retention rate (RR) and graduation rate (GR). Using data from 29 online colleges, the analysis employs statistical techniques, including summary statistics, scatter plots, and linear regression modeling, to assess the association between RR and GR. The results indicate a positive and moderately strong linear relationship, with a regression equation showing that a 1% change in RR corresponds to a 0.28% change in GR. Hypothesis testing confirms the statistical significance of this relationship. The report also discusses the implications for individual universities, such as South University and University of Phoenix, and offers recommendations for improving retention and graduation rates, including measures to enhance student engagement, implement entrance criteria, and offer relevant courses. The analysis highlights the importance of addressing issues affecting student retention and graduation to improve the overall quality and relevance of online education.

ECONOMICS AND QUANTITATIVE ANALYSIS
Regression Analysis
Student ID:
[Pick the date]
Regression Analysis
Student ID:
[Pick the date]
Paraphrase This Document
Need a fresh take? Get an instant paraphrase of this document with our AI Paraphraser

ECONOMICS AND QUANTITATIVE ANALYSIS
Table of Contents
Purpose.......................................................................................................................................2
Background................................................................................................................................2
Method.......................................................................................................................................2
Results........................................................................................................................................3
Discussion..................................................................................................................................5
Recommendations......................................................................................................................6
References..................................................................................................................................7
1

ECONOMICS AND QUANTITATIVE ANALYSIS
Purpose
In wake of the growing trend of online university education in US, the given report aims to
carry out a quantitative analysis based on the data provided so as to present findings in
relation to these universities performance. Two key variables that have been used for
performance analysis are Retention Rate (RR) and Graduation Rate (GR). The underlying
relationship between these two variables would also be analysis. Based on this analysis,
prudent recommendations can be offered in order to improve the US online university
education so that this can contribute to the economic growth in a significant manner.
Background
In the backdrop of technological revolution leading to developments of communication aids
which are internet based, the delivery of product and services has seen a fundamental change.
With regards to education, this has resulted in growing popularity of online courses. These
courses tend to be flexible and offer a large degree of convenience to the students when
compared to the classroom based education system. Also, owing to assess over the internet,
the cost of these courses is comparatively a fraction of the offline courses (Craig, 2015). But
online courses do have their concerns particularly in the context of dedication of the students
which is apparent in higher dropouts of online courses as compared of offline courses (Hill,
2015). As a result, the objective of the given report is to highlight the underlying relationship
between RR and GR for US based online universities so that inference can be made with
regards to their relevance to the overall education system.
Method
Taking into consideration the sample data of 29 US based online colleges, the underlying
analysis is based on applying relevant statistical techniques. The summary statistic for the
given variables has been outlined so that an overall picture of the industry (online education)
can be gauged from the sample provided. In order to highlight the underlying relationship
between RR and GR, scatter plot has been drawn with the former being the independent
variable and latter being the dependent variable. Also, a linear regression model has been
worked out based on the sample data so as to obtain estimates of GR based on the different
values of RR across online colleges across US. The regression analysis is used for providing
the colleges with useful recommendations in order to boost their overall performance and
improve service quality.
2
⊘ This is a preview!⊘
Do you want full access?
Subscribe today to unlock all pages.

Trusted by 1+ million students worldwide

ECONOMICS AND QUANTITATIVE ANALYSIS
Results
a) For the two variables at hand i.e. GR and RR, the relevant summary statistics are reflected
below.
b) The requisite scatter plot between RR and GR is indicated below with the former as the
independent variable and latter acting as the dependent variable.
The scatter plot above clearly highlights a positive relationship between RR % and GR%.
Also, the magnitude of this linear relationship seems to be moderately strong considering that
deviations of the scatter points from the line of best fit are not very high (Hair et. al., 2015).
c) The regression related output derived from Excel is presented as follows.
3
Paraphrase This Document
Need a fresh take? Get an instant paraphrase of this document with our AI Paraphraser

ECONOMICS AND QUANTITATIVE ANALYSIS
d) Considering the regression output from excel, the regression equation is listed as follows.
From the above regression equation, it is clear that the slope comes out as 0.28 which
indicates that a change in the RR by 1 percentage point would lead to corresponding change
in the GR by 0.28 percentage point. Also, considering that the magnitude of the slope is
positive, it reflects that the direction of change for the two variables would be same (Hillier,
2016).
e) For determining if the association between the above two variables i.e. RR and GR have
statistical significance or not, the slope coefficient of the regression model needs to be
tested for significance by using hypothesis testing.
Let the significance level for the test be 5% or 0.05.
For the slope coefficient of RR, as indicated in the regression output, the t stat is 4.69 with a
corresponding p value of 0.00.
4

ECONOMICS AND QUANTITATIVE ANALYSIS
As the computed p value for the slope coefficient (i.e. 0.00) is lower that the level of
significance, hence, it would be correct to conclude that the available evidence warrants
rejection of null hypothesis and acceptance of alternate hypothesis (Flick, 2015). As a result,
it is fair to conclude that the significance of slope coefficient is proven which also implies
that RR and GR have a significant linear relationship.
f) The R2 value (also called coefficient of determination) for the regression model under
review has been derived as 0.4492 which is moderate since 44.92 of the variation in the
dependent variable is explained on the basis of independent variable. Also, the
significance of the slope coefficient has been established which implies model is a good fit
(Hastie, Tibshirani and Friedman, 2014).
g) If I am the president of South University, I would be concerned as despite having an RR of
51%, the GR is only 25%. By putting the value of RR in the regression equation obtained,
the GR should have come out as about 40%. Considering that actual GR% is significantly
lower than the estimated GR%, hence the reasons responsible for this need to be found and
rectified.
h) If I am the president of University of Pheonix, I would be concerned about the abysmal
RR% at 4% which is the lowest amongst the given sample data. However, a positive
aspects is that despite the RR% being lowest, the GR is 28% which exceeds the estiamte
made through regression analysis. Also, the GR% for University of Pheonix is superior in
comparison to South University which has retention rate of 51%.
Discussion
The results highlight that average RR% is about 55% while the average GR% is about 41%
which seems reasonable. A higher dispersion is noticed in the RR% considering the wide
range for this variable. The scatter plot highlights a positive and strong linear relationship
between RR% and GR%. Further, the regression model highlights that 1% change in RR%
would change GR% by 0.28% in the same direction. Also, the slope coefficient is found to be
significant and the model a good fit (Hair et. al.,2015). Further, low GR% is a matter of
concern for South University while low RR% is the concern for University of Phoenix.
A key strength of the analysis is that it is based on statistical analysis which lends credibility
and enhances objective analysis. A limitation is that there is no information with regards to
the sampling technique deployed to select the 29 colleges and also the market share in online
5
⊘ This is a preview!⊘
Do you want full access?
Subscribe today to unlock all pages.

Trusted by 1+ million students worldwide

ECONOMICS AND QUANTITATIVE ANALYSIS
education represented by these. However, the results obtained in the results section are
supported from similar studies which enhances the relevance of the results. The results do
have policy implications with regards to regulation of content and other measures that tend to
have an impact on the quality of these online courses.
Recommendations
Considering the analysis carried out below, following recommendations may be offered to
the online colleges in USA.
1) Measures need to be taken to improve the retention rate by conducting surveys and
feedback from the students. The respective colleges should resolve various issues that the
students face to the extent feasible.
2) Additionally, considering the issues with regards to the seriousness of the students
enrolling for these courses, it makes sense to have some kind of entrance test or minimum
academic grades to enrol which would ensure that only the serious candidates are able to
enrol.
3) Besides, it make sense for these online colleges and universities to offer courses that are
relevant considering the changing job dynamics and the demand supply mismatch. This
would result in enhanced relevance for these courses which potentially would address the
issues of low RR% and GR%.
6
Paraphrase This Document
Need a fresh take? Get an instant paraphrase of this document with our AI Paraphraser

ECONOMICS AND QUANTITATIVE ANALYSIS
References
Craig, R.(2015),A Brief History (And Future) Of Online Degrees, [Online] Available at
http://www.forbes.com/sites/ryancraig/2015/06/23/a-brief-history-and-future-of-online-
degrees/#5be1eb3a7e37 [Accessed January 26, 2019]
Flick, U.(2015), Introducing research methodology: A beginner's guide to doing a research
project, New York: Sage Publications, pp. 67-71
Hair, J. F., Wolfinbarger, M., Money, A. H., Samouel, P., & Page, M. J. (2015). Essentials of
business research methods, New York: Routledge, pp. 103-106
Hastie, T., Tibshirani, R. and Friedman, J.(2014), The Elements of Statistical Learning, New
York: Springer Publications, pp. 89-93
Hill, P. (2015),No Discernible Growth in US Higher Ed Online Learning, [Online] Available
athttp://mfeldstein.com/no-discernible-growth-us-higher-ed-online-learning/ [Accessed
January 26, 2019]
Hillier, F. (2016), Introduction to Operations Research, New York: McGraw Hill
Publications, pp. 143-147
7
1 out of 8
Related Documents
Your All-in-One AI-Powered Toolkit for Academic Success.
 +13062052269
info@desklib.com
Available 24*7 on WhatsApp / Email
Unlock your academic potential
Copyright © 2020–2026 A2Z Services. All Rights Reserved. Developed and managed by ZUCOL.


