An Investigation into Online Student Retention and Graduation Rates

Verified

Added on  2023/04/20

|11
|1937
|360
Report
AI Summary
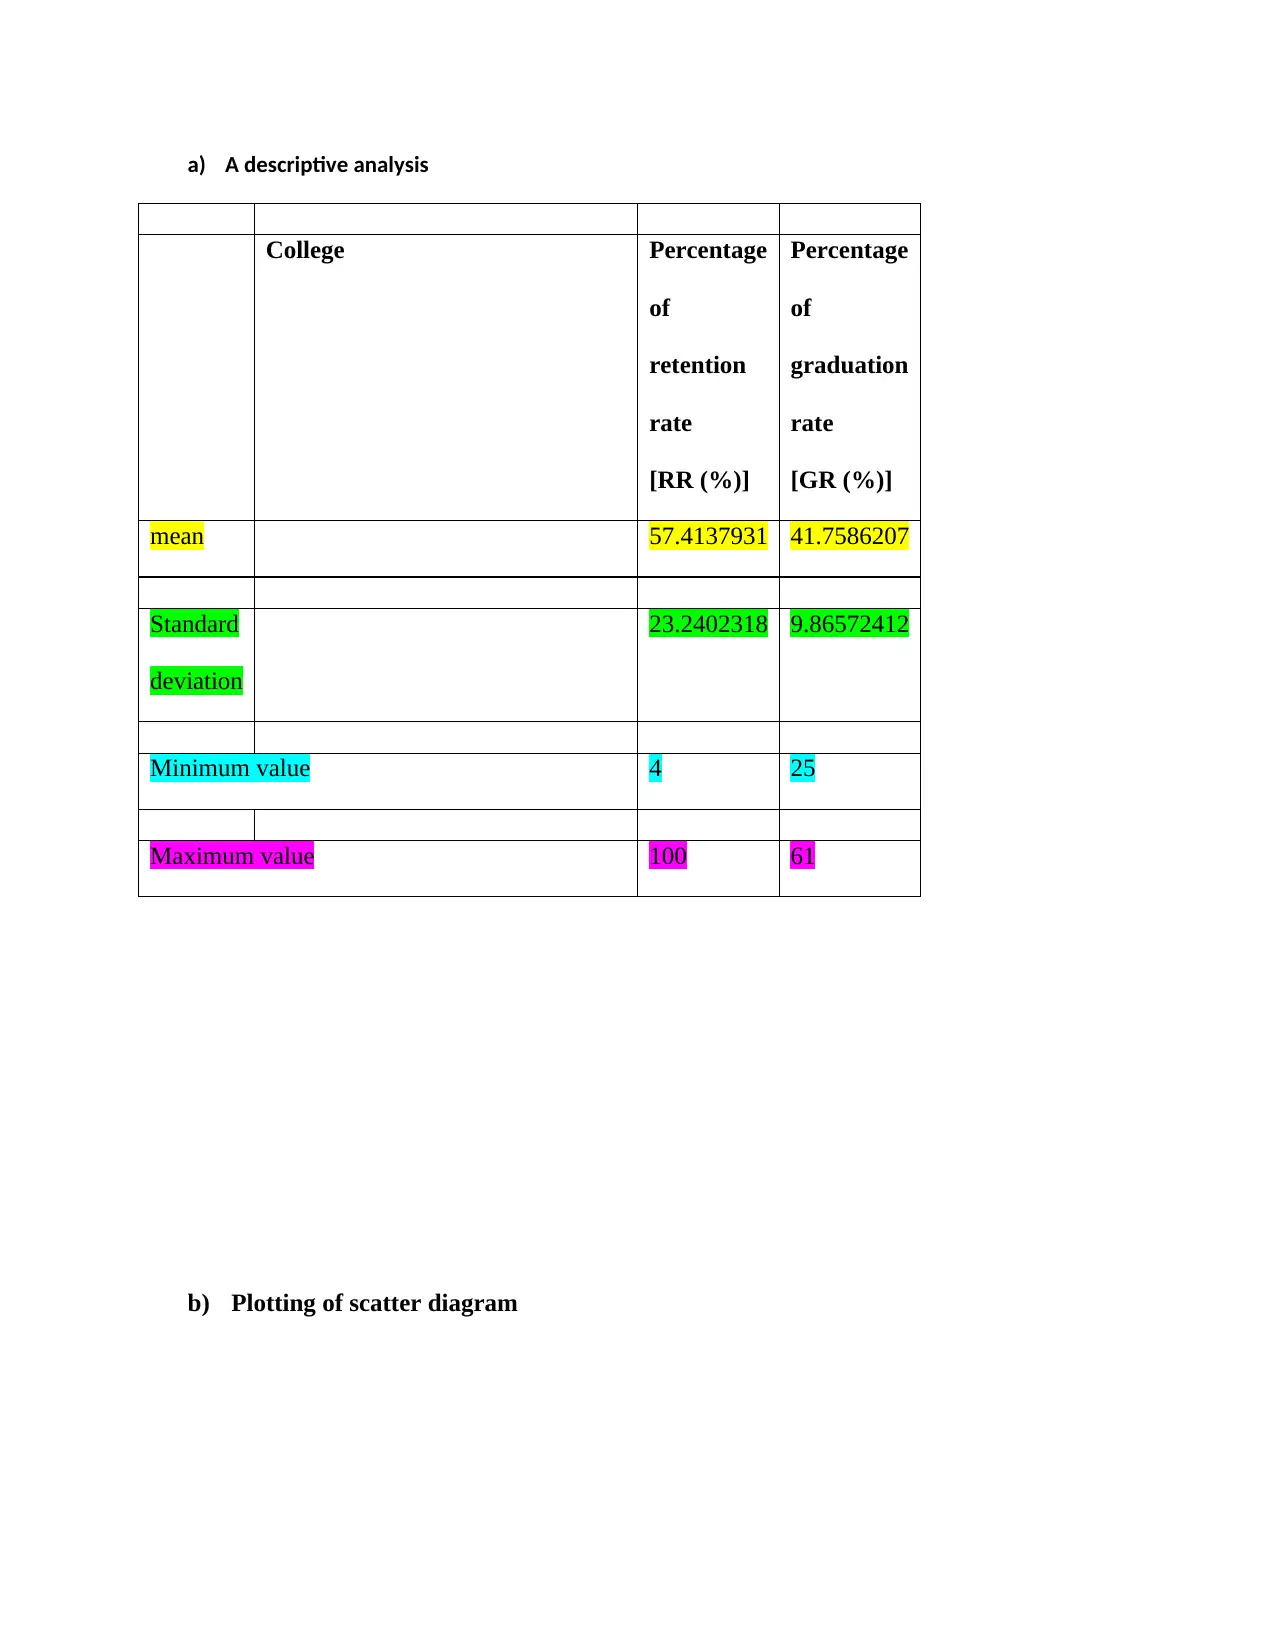
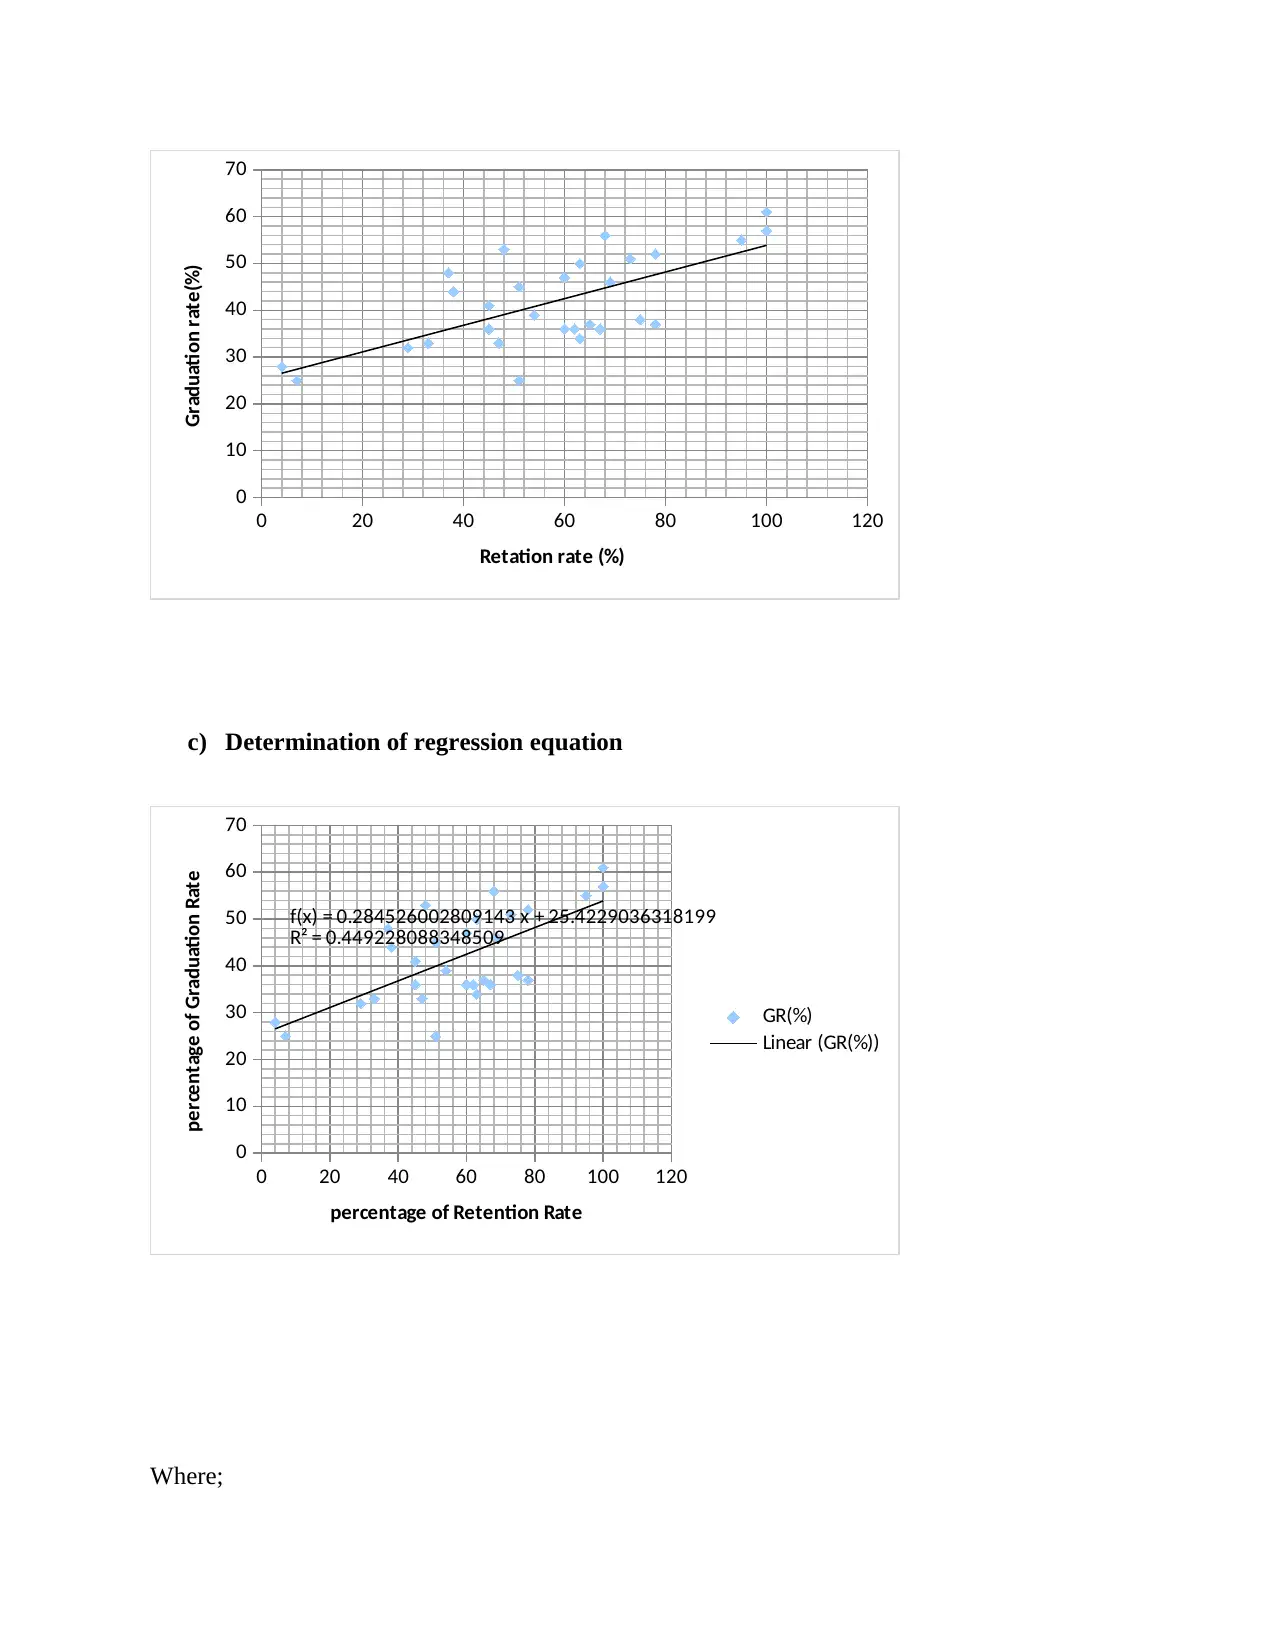
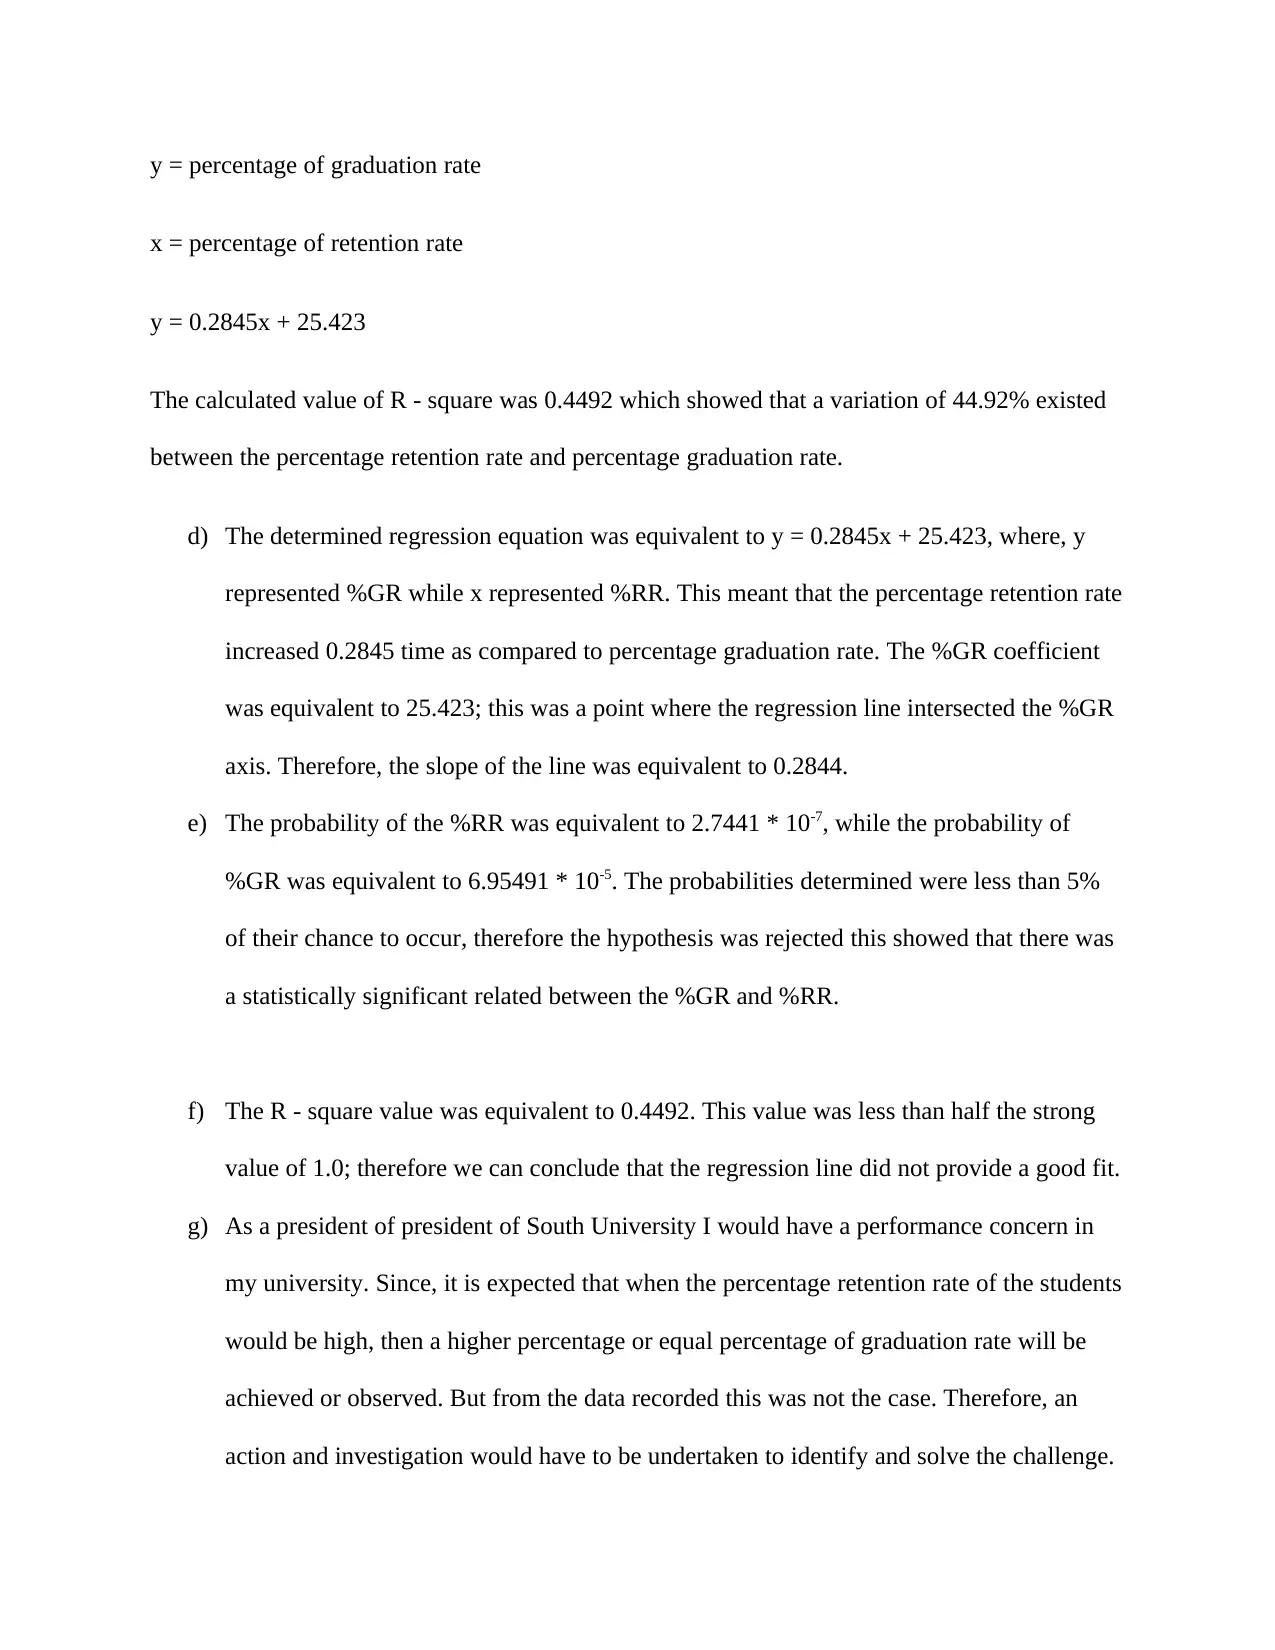
This report investigates the relationship between online student retention rates and graduation rates across twenty-nine higher learning institutions. The study utilizes data analysis, including descriptive statistics and regression analysis, to examine the correlation between these two variables. The report explores the historical development of online learning, tracing its evolution through different generations of technology and pedagogical approaches. The findings reveal a statistically significant relationship between retention and graduation rates, although the regression model's fit is not strong. The analysis includes a discussion of the results, comparing the performance of different universities and offering recommendations for improving online learning outcomes. The report concludes by emphasizing the importance of technological advancements and effective online learning strategies to enhance student success.
Document Page
Introduction
Graduation rate for courses offered online in universities and colleges has a status of being lower
than graduation rate. Investigation carried out in academic institutions showed that online
retention rate was low. A literature review presented a deficiency research regarding online
retention support problem (Bolliger and Wasilik, 2009). In addition, previous investigations
conducted prior to evolvement of distance learning included internet technologies and online
instructions boosted the design of the current platform to conduct distance learning.
The main investigations carried out by researchers have been entitled to recommend on the
reasons as to why students enrolled on different courses would drop out from their online
programs (Dray et al., 2011). Furthermore, to model out ways to advance persistence, retention
and attrition to maximize the graduation rate on different higher academic institutions (Angelino
and Natvig, 2009). The results of this analysis showed the reason for the low percentage
retention rate in different institutions which included; the status of student preparation or
previous student development, age of the student and different demographics that exist between
physical face to face learning and online learning (Meyer, Bruwelheide and Poulin, 2009;
Patterson and McFadden, 2009).
Purpose of the Study
The general objective of this investigation was to make a comparison between online students’
retention rate and graduations rate on the selected twenty-nine higher learning institutions. The
specific objective of this study was to improve and develop best approaches to increase both
retention rates and graduation rates.
tabler-icon-diamond-filled.svg

Paraphrase This Document

Need a fresh take? Get an instant paraphrase of this document with our AI Paraphraser
Document Page
Background
The current online learning outlines were traced from historical roots which were first reviewed
and then followed by learning system management. The first generation of online learning
developed from distant learning started in Great Britain in 1840s with communication courses
where information was delivered through mail (Roberts, 2009).
The second generation began on 1920s and included courses being taught through broadcasting
television and radios. The third generation of distance learning started in 1960s integrated several
media programs, which included broadcasts, printing media, telephone conferences, and audio
recording and library sources. The Open University developed by Great Britain’s emphasized on
learner’s support by offering counseling and tutoring (Roberts, 2009). The fourth generation
started on 1970s by integration of teleconferencing, this enabled students to synchronously
communicate just like students who were sited on a physical class. This was enhanced by
satellite technology which allowed students’ instructors to transmit collaborative video
conferences. The fifth generation incorporated internet and computer classes to provide lessons
to distance students. In 1990s universities started offering program and courses which dealt with
web. Web 2.0 technologies applied on independent courses included networking to build up
virtual classrooms (den Exter et al., 2012). The technology lead to formation of discussion
forum, blogs, Wikis and were implemented through system of learning management.
Document Page
Methodology
Data Analysis
The data analysis was conducted using Microsoft excel in collecting, transforming and compiling
data. The excel was used to calculate regression equation, determine R-square value, plotting
scatter diagram, determining significance level, probability and calculation of central tendency.
Regression analysis
Regression method was used to investigate variation of dependent variables on the sample data
provided. Percentage of retention rate data was assigned independent variable while percentage
graduation rate was assign independent variable.
The regression model used helped to determined correlation coefficient, probability and
indication of the coefficient that proved the outcome was either statistically significant or
statistically insignificant. The strength of the likelihood percentage of graduation rate (dependent
variable) to change as a result of increasing the percentage retention rate (independent variable)
by one unit was determined by the regression coefficient.
Results
Results from excel
Document Page
a) A descriptive analysis
College Percentage
of
retention
rate
[RR (%)]
Percentage
of
graduation
rate
[GR (%)]
mean 57.4137931 41.7586207
Standard
deviation
23.2402318 9.86572412
Minimum value 4 25
Maximum value 100 61
b) Plotting of scatter diagram
tabler-icon-diamond-filled.svg

Paraphrase This Document

Need a fresh take? Get an instant paraphrase of this document with our AI Paraphraser
Document Page
0 20 40 60 80 100 120
0
10
20
30
40
50
60
70
Retation rate (%)
Graduation rate(%)
c) Determination of regression equation
0 20 40 60 80 100 120
0
10
20
30
40
50
60
70
f(x) = 0.284526002809143 x + 25.4229036318199
R² = 0.449228088348509
GR(%)
Linear (GR(%))
percentage of Retention Rate
percentage of Graduation Rate
Where;
Document Page
y = percentage of graduation rate
x = percentage of retention rate
y = 0.2845x + 25.423
The calculated value of R - square was 0.4492 which showed that a variation of 44.92% existed
between the percentage retention rate and percentage graduation rate.
d) The determined regression equation was equivalent to y = 0.2845x + 25.423, where, y
represented %GR while x represented %RR. This meant that the percentage retention rate
increased 0.2845 time as compared to percentage graduation rate. The %GR coefficient
was equivalent to 25.423; this was a point where the regression line intersected the %GR
axis. Therefore, the slope of the line was equivalent to 0.2844.
e) The probability of the %RR was equivalent to 2.7441 * 10-7, while the probability of
%GR was equivalent to 6.95491 * 10-5. The probabilities determined were less than 5%
of their chance to occur, therefore the hypothesis was rejected this showed that there was
a statistically significant related between the %GR and %RR.
f) The R - square value was equivalent to 0.4492. This value was less than half the strong
value of 1.0; therefore we can conclude that the regression line did not provide a good fit.
g) As a president of president of South University I would have a performance concern in
my university. Since, it is expected that when the percentage retention rate of the students
would be high, then a higher percentage or equal percentage of graduation rate will be
achieved or observed. But from the data recorded this was not the case. Therefore, an
action and investigation would have to be undertaken to identify and solve the challenge.
Document Page
h) As a president of president University of Phoenix I would not have that eagerness on
performance concern in my university. Since, it is expected that when the percentage
retention rate of the students would be low, then a lower percentage or equal percentage
of graduation rate will be achieved or observed. But from the data recorded this was not
the case since the percentage of graduation rate is higher.
Discussion
The aim of this analysis was to compare online students’ percentage rate of retention and their
percentage graduations rate on the selected twenty-nine higher learning institutions. From the
calculations the following were determined;
tabler-icon-diamond-filled.svg

Paraphrase This Document

Need a fresh take? Get an instant paraphrase of this document with our AI Paraphraser
Document Page
1. The calculated value of R - square was 0.4492 which showed that a variation of 44.92%
existed between the percentage retention rate and percentage graduation rate.
2. The regression equation was equivalent to y = 0.2845x + 25.423, where, y represented
%GR while x represented %RR. This meant that the %RR increased 0.2845 time as
compared to %GR. The %GR coefficient was equivalent to 25.423; this was a point
where the regression line intersected the %GR rate axis. Therefore, the slope of the line
was equivalent to 0.2844.
3. The probability determined on excel for the %RR was equivalent to equivalent to 2.7441
* 10-7, while the probability for %GR determined was equivalent to 6.95491 * 10-5. The
probabilities determined were less than 5% of their chance to occur, therefore the
hypothesis was rejected this showed that there was a statistically significant associated
between the %RR and %GR
4. The R - square value was equivalent to 0.4492. This value was less than half the strong
value of 1.0; therefore we can conclude that the regression line did not provide a good fit.
Conclusion
Document Page
The value of R – square determined showed the percentage variation of the dependent variables
that were projected by the model. The R – square value was equivalent to 0.4492 which showed
that the model would explain 44.92% of the data.
The probability of the %RR was equivalent to 2.7441 * 10-7, while the probability of the %GR
was equivalent to 6.95491 * 10-5.
The regression equation was equivalent to y = 0.2845x + 25.423, where, y represented
percentage of graduation rate while x represented percentage of retention rate.
The slope of the regression line was equivalent to 0.2844.
Recommendation
Higher academic learning stakeholders should consider improving the online learning by
ensuring that they implement the latest technology, which is capable of making the online
Document Page
interface between the instructors and the student faster, easier to interact and moderate in term of
costs.
References
Angelino, L.M. and Natvig, D., 2009. A conceptual model for engagement of the online
learner. Journal of Educators Online, 6(1), pp.1-19.
tabler-icon-diamond-filled.svg

Paraphrase This Document

Need a fresh take? Get an instant paraphrase of this document with our AI Paraphraser
Document Page
Bolliger, D.U. and Wasilik, O., 2009. Factors influencing faculty satisfaction with online
teaching and learning in higher education. Distance Education, 30(1), pp.103-116.
Burrus, J., Elliott, D., Brenneman, M., Markle, R., Carney, L., Moore, G., Betancourt, A.,
Jackson, T., Robbins, S., Kyllonen, P. and Roberts, R.D., 2013. Putting and keeping students on
track: Toward a comprehensive model of college persistence and goal attainment. ETS Research
Report Series, 2013(1), pp.i-61.
Dray, B.J., Lowenthal, P.R., Miszkiewicz, M.J., Ruiz‐Primo, M.A. and Marczynski, K., 2011.
Developing an instrument to assess student readiness for online learning: A validation
study. Distance Education, 32(1), pp.29-47.
Den Exter, K., Rowe, S., Boyd, W. and Lloyd, D., 2012. Using Web 2.0 technologies for
collaborative learning in distance education—Case studies from an Australian university. Future
Internet, 4(1), pp.216-237.
Meyer, K.A., Bruwelheide, J. and Poulin, R., 2009. Why they stayed: Near-perfect retention in
an online certification program in library media. Journal of Asynchronous Learning
Networks, 13(3), pp.129-145.
Patterson, B. and McFadden, C., 2009. Attrition in online and campus degree programs. Online
Journal of Distance Learning Administration, 12(2), pp.1-8.
Roberts, R., 2009. Video conferencing in distance learning: A New Zealand schools’
perspective. Journal of Open, Flexible, and Distance Learning, 13(1), pp.91-107.
chevron_up_icon
1 out of 11
circle_padding
hide_on_mobile
zoom_out_icon
[object Object]