Online University Retention and Graduation Rate Analysis

Verified

Added on  2022/12/09

|10
|1945
|456
Report
AI Summary
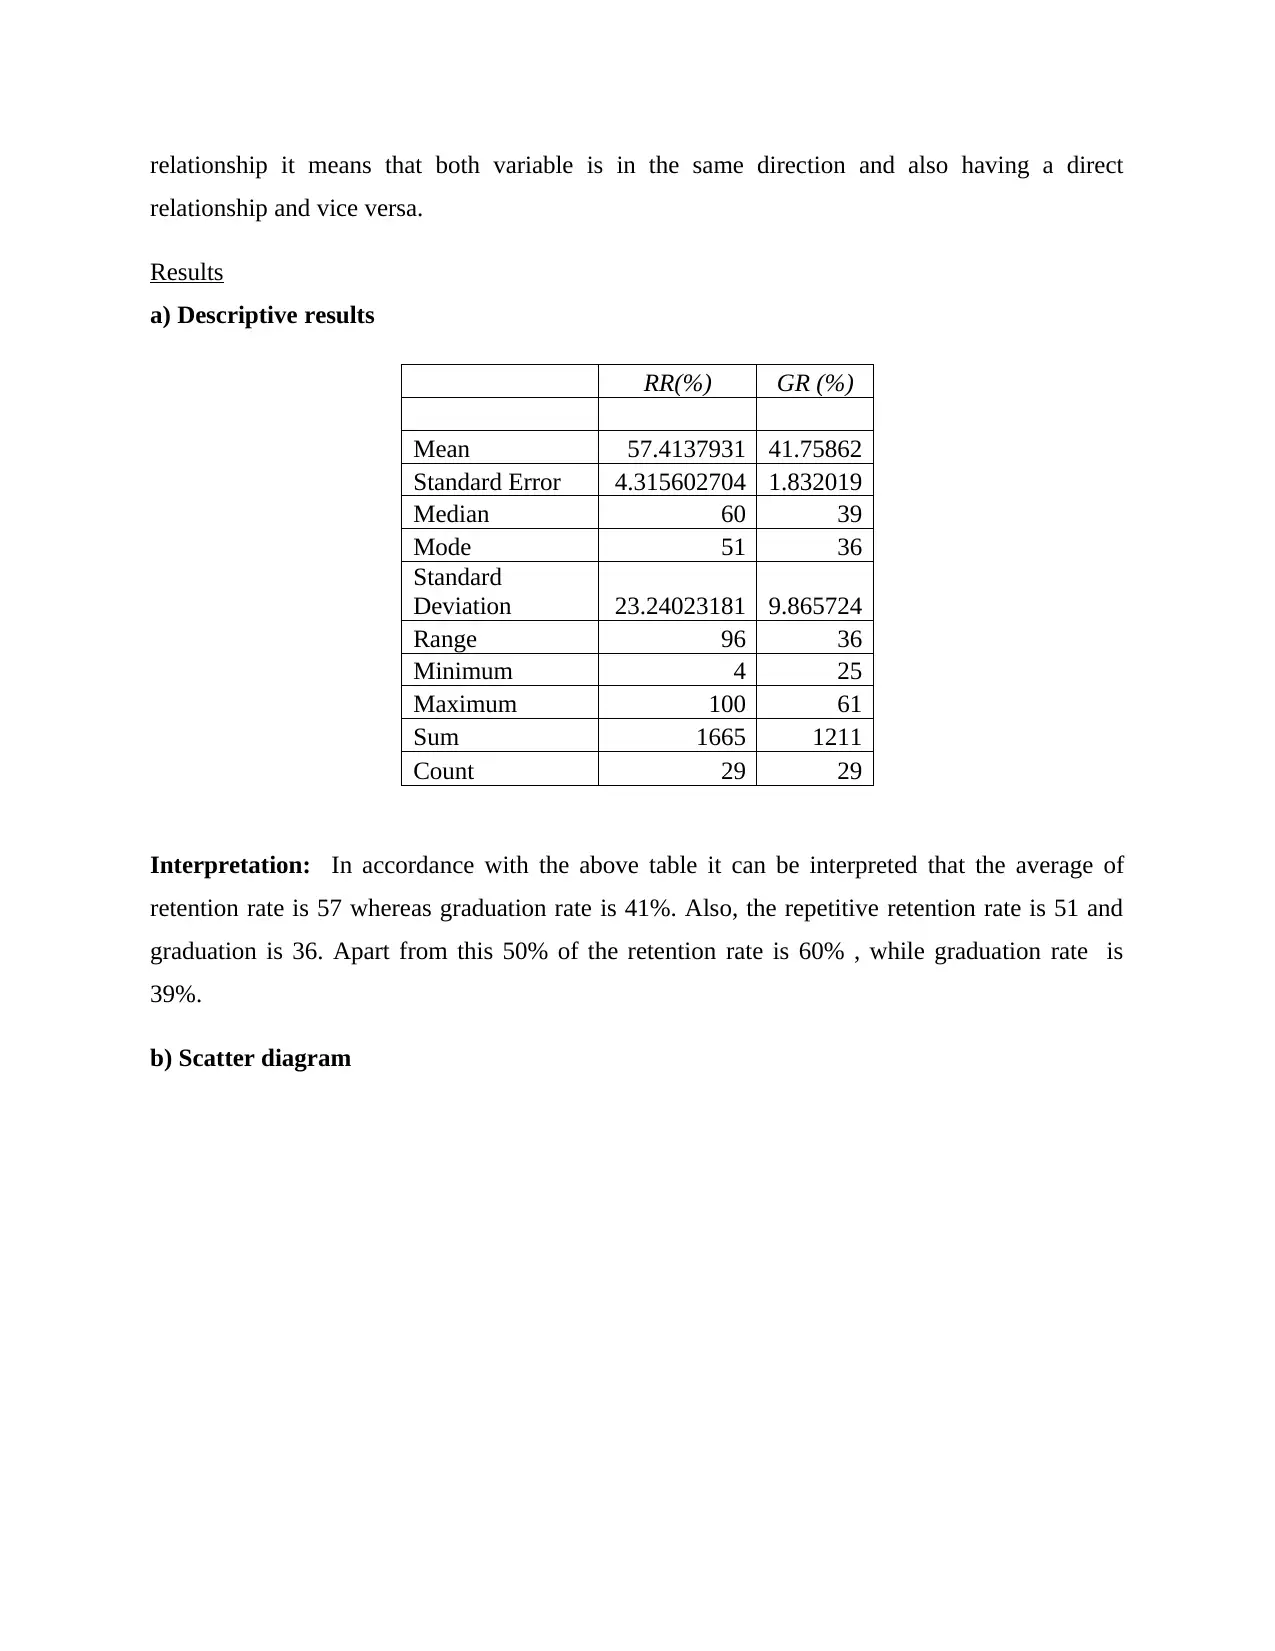
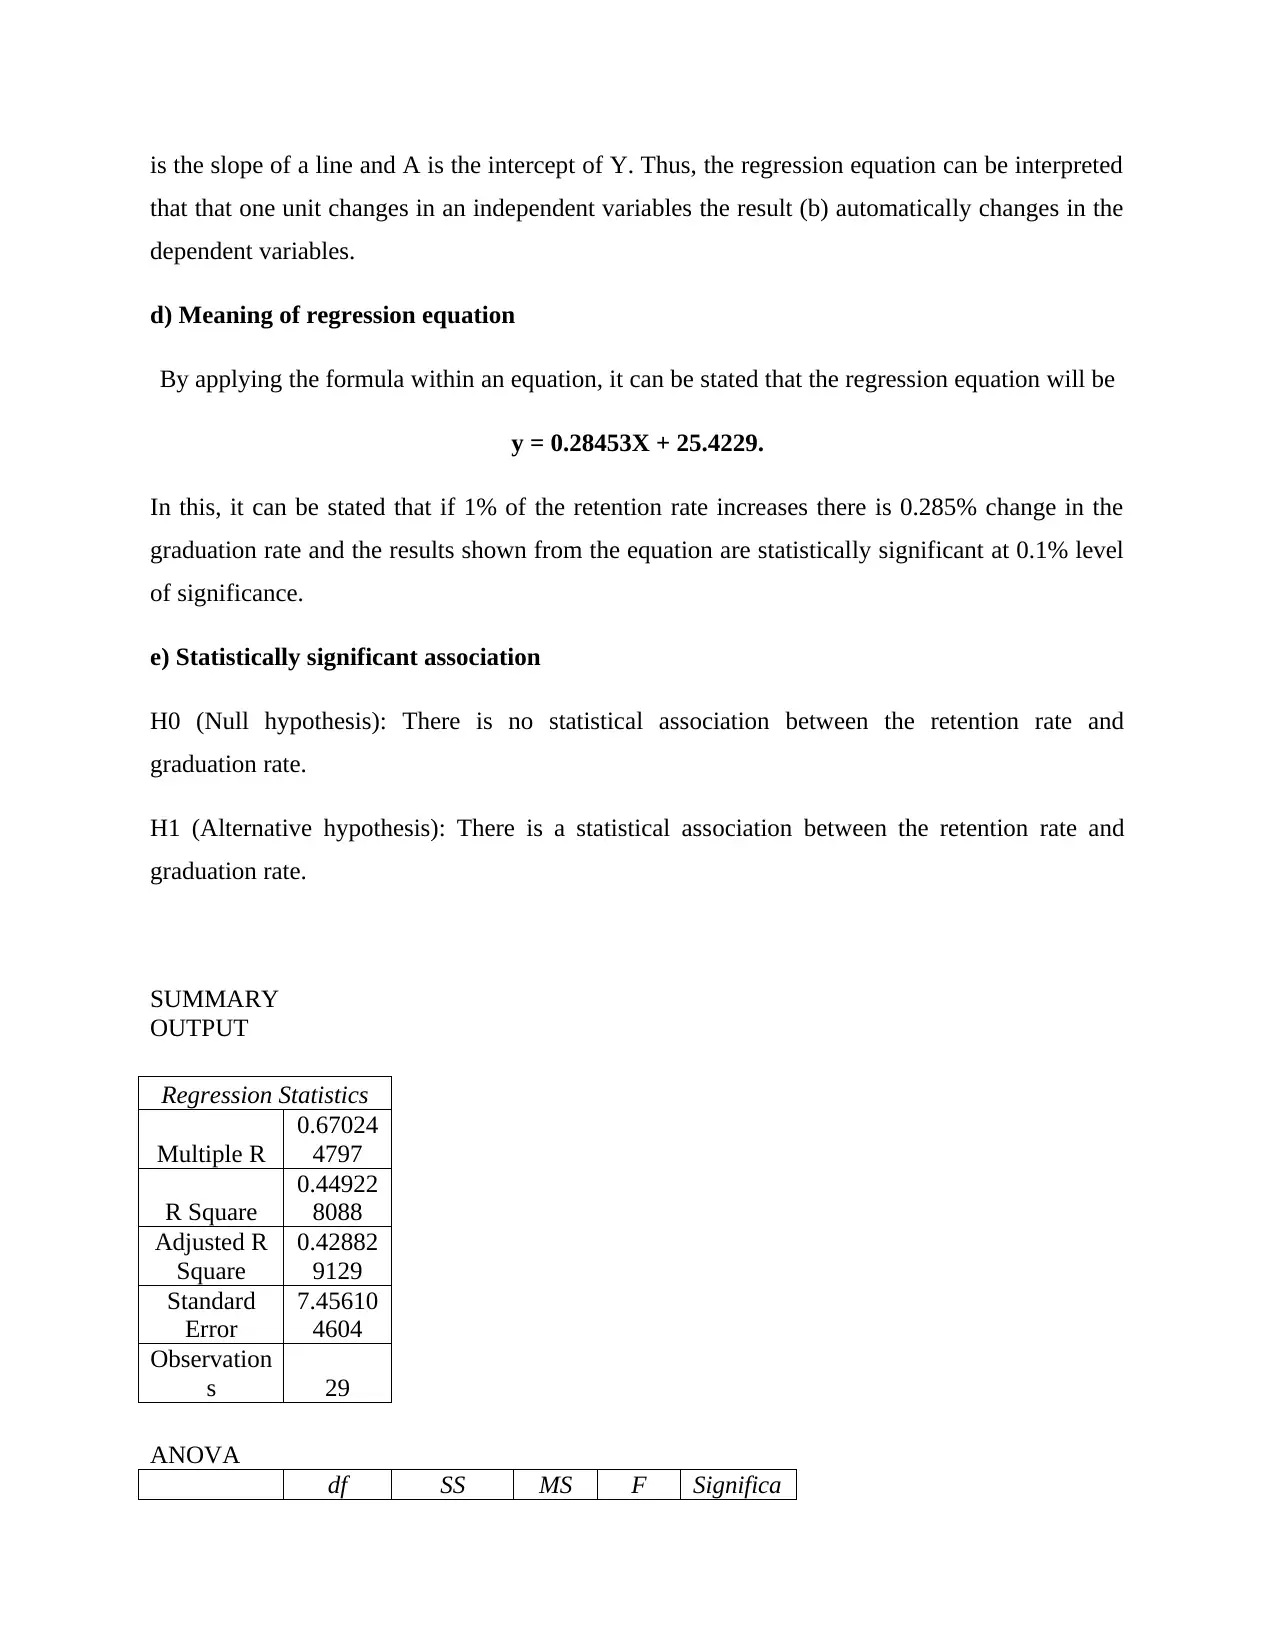
This report investigates the relationship between retention and graduation rates in online universities using statistical analysis. The study employs regression analysis to determine the correlation between these variables, drawing upon data from various online institutions. The results reveal a positive association between the two rates, indicating that higher graduation rates tend to coincide with increased retention. The analysis includes descriptive statistics, a scatter diagram illustrating the linear trend, and a regression equation to quantify the relationship. The findings highlight a moderate relationship, suggesting that while graduation rates influence retention, other factors also play a significant role. The report concludes with recommendations for universities to enhance retention rates, emphasizing the need to consider additional factors beyond graduation rates and to utilize diverse statistical tools for more comprehensive insights. The report also addresses the concerns of university presidents regarding strategies to improve student success in the online learning environment.
Document Page
Economics and quantitative analysis
tabler-icon-diamond-filled.svg

Secure Best Marks with AI Grader

Need help grading? Try our AI Grader for instant feedback on your assignments.
Document Page
TABLE OF CONTENTS
Purpose........................................................................................................................................2
Background..................................................................................................................................2
Method.........................................................................................................................................2
Results..........................................................................................................................................3
Discussion....................................................................................................................................7
Recommendations........................................................................................................................7
REFERENCES................................................................................................................................9
Document Page
Purpose
The purpose of the study is to determine the association between the retention rate and
graduation rate. For that data has been collected over different online universities which entail
the relationship between these variables.
Background
In the current time, the entire world is shift towards an online including hotels, corporate
world and education system. Further, there are numerous drivers that change the higher
education (HE) sector in which technology, globalization, changing demographics and changes
in student’s expectation will be common (Millea and et.al., 2018). Therefore, one of the biggest
challenges faced by the higher education sector is recent growth of online universities. Such
universities established in order to provide effective results and change the study behaviour of
students, especially to those who want to study along with their professional work. In this regard,
most of the researchers are agreed that online learning is considering a disruptive innovation in
HE.
In the present study, the major focus is to analyse the relationship between the retention
and graduation rates which can be varies in different ways in online courses as compared to
traditional courses. Earlier, most of the University provide regular classes to their students but
the pandemic changes the criteria and majority of the students shift towards online classes.
Therefore, with the help of statistical data, scholar determines the relationship between variables
and also determines the dependency of variables within each other. Therefore, this in turn assist
to improve the result and develop strategies within such Universities to make made effective
results.
Method
In order to determine the association between the variables, inferential statistics has been
used in which regression analysis will be performed. Through this, study will analyse the
relationship between retention rate and graduation rate. Along with this, it helps Universities to
understand what the data points represent and use them accordingly in order to make better
decision in near future. In this, two variables are identified which included independent variable
i.e. graduation rate and dependent variable i.e. retention rate. If results shows the positive
Document Page
relationship it means that both variable is in the same direction and also having a direct
relationship and vice versa.
Results
a) Descriptive results
RR(%) GR (%)
Mean 57.4137931 41.75862
Standard Error 4.315602704 1.832019
Median 60 39
Mode 51 36
Standard
Deviation 23.24023181 9.865724
Range 96 36
Minimum 4 25
Maximum 100 61
Sum 1665 1211
Count 29 29
Interpretation: In accordance with the above table it can be interpreted that the average of
retention rate is 57 whereas graduation rate is 41%. Also, the repetitive retention rate is 51 and
graduation is 36. Apart from this 50% of the retention rate is 60% , while graduation rate is
39%.
b) Scatter diagram
tabler-icon-diamond-filled.svg

Secure Best Marks with AI Grader

Need help grading? Try our AI Grader for instant feedback on your assignments.
Document Page
0 2 4 6 8 10 12
0
2
4
6
8
10
12
RR(%)
RR(%)
1
3
5
7
9
11
13
15
17
19
21
23
25
27
29
0
20
40
60
80
100
120
RR(%)
GR(%)
Interpretation: from the above scatter diagram, it can be stated that there is a positive
association between retention and graduation rate. Such that when the graduation rate increases
there is a linear trend identified. So it can be stated that when graduation rate increases, retention
rate automatically increases and vice versa. Also, within online University, if the graduation rate
of a students is increases, chances of retention automatically increases.
c) Estimate regression equation
Here, in order to define the simple linear regression equation, scholar uses Y = bX + a
equation. In this, X is constant and ‘a’ is parameter. Also, in this equation, Y is an intercept and b
Document Page
is the slope of a line and A is the intercept of Y. Thus, the regression equation can be interpreted
that that one unit changes in an independent variables the result (b) automatically changes in the
dependent variables.
d) Meaning of regression equation
By applying the formula within an equation, it can be stated that the regression equation will be
y = 0.28453X + 25.4229.
In this, it can be stated that if 1% of the retention rate increases there is 0.285% change in the
graduation rate and the results shown from the equation are statistically significant at 0.1% level
of significance.
e) Statistically significant association
H0 (Null hypothesis): There is no statistical association between the retention rate and
graduation rate.
H1 (Alternative hypothesis): There is a statistical association between the retention rate and
graduation rate.
SUMMARY
OUTPUT
Regression Statistics
Multiple R
0.67024
4797
R Square
0.44922
8088
Adjusted R
Square
0.42882
9129
Standard
Error
7.45610
4604
Observation
s 29
ANOVA
df SS MS F Significa
Document Page
nce F
Regression 1 1224.286
1224.
286
22.02
211 0.00
Residual 27 1501.024
55.59
35
Total 28 2725.31
Coeffici
ents
Standard
Error t Stat
P-
value
Lower
95%
Upper
95%
Lower
95.0%
Upper
95.0%
Intercept
25.4229
0363 3.746284
6.786
166
2.74E
-07
17.73616
416
33.109
64
17.7361
6
33.1096
4
RR(%)
0.28452
6003 0.060631
4.692
772
6.95E
-05
0.160122
1
0.4089
3
0.16012
2 0.40893
Interpretation: From the regression statistic table it can be interpreted that there is a moderate
relationship between both variable because the value of R is 0.67 which is lower than 0.75.
However, it can be stated from anova table that there is a significant relationship between the
retention and graduation rates. It is so because the value of p (0.00 < 0.05) which means
alternative hypothesis is accepted over null. So, it can be stated that graduation rate increases,
there is a direct impact upon the retention rate.
f) Interpretation of good fit
The goodness of fit can be recognized through the value if R^2 ad residual plot. Also,
from the regression statistics, it can be said that there is 44% of the changes in the value of
retention rate if graduation rate changes. So it can be stated that there is a moderate changes
between both variables.
g) Concern of president of South University
From the result, it can be stated that graduation rate is depends upon the retention rate,
but not completely. Therefore, the concern of president of South University is such that there is a
need to consider some other factors which helps University of increase the rate of retention.
Through the data it is analyzed that the rate of retention is good within South University. Along
with the graduation rate, that is why, university should only implement the strategies that assist
to improve the retention rate.
tabler-icon-diamond-filled.svg

Paraphrase This Document

Need a fresh take? Get an instant paraphrase of this document with our AI Paraphraser
Document Page
h) Concern of president of University of Phoenix
As per the data provided, it is analyzed that the graduation rate is satisfactory whereas the
retention rate is quite low and that is why, President of University of Phoenix must consider
some relevant key aspects in order to increase the retention rate of the University. This in turn
assists them to improve the overall performance and attract new students towards it.
Discussion
In accordance with the results generated from data, it can be stated there is a positive
relationship between the retention and graduation rates. Sebastiani and et.al., (2021) also stated
that University have an effective tools and techniques which assist students to return for their
second year and also indicate that they are interested within Universities. It has been further
examined through thee Anova table that there is a moderate relationship between graduation and
retention rate. It is also supported by Bowman and et.al., (2019) that student retain after
graduation when the online university has a brand image and that is why, it attract rage of
students. Whereas, it University did not offer effective courses and skilled teachers than it did
not assist to attract range of students which in turn decreases the graduation rate as well as
retention rates.
Also, due to having moderate relationship, it can be stated that scholar must use other
factors which influence the graduation rate and this in turn also assist University to implement
strategy accordingly. Zumwalt and et.al., (2017) critically evaluated that graduation rate does not
influence from the retention rate, that is why University should provide effectual methods that
assist to increase the graduation rate which in turn increases the relationship between other
factors as well.
Recommendations
From the findings, it is examined that there is a direct relationship between these factors
and somehow the model does not provide a satisfactory answer. So, here are some
recommendations provided in order to improve the performance of Online Universities:
It is to be recommended to the University to consider some more relevant factors that
assist them to improve the performance. It is analyzed that online learning is good and
Document Page
cost effective, that is why, there is a need to implement the strategies which assist attract
other students effectively.
Further, it is also suggested to the universities to collect the data related to other factor
that are depend upon the graduation rate. Through this, Universities also identify the key
aspects which need to be considered in their studies so that they make valid decision for
the welfare of the student’s learning. The aspects includes students served, subject
domain, scale, budget and role of teacher towards a growth of a learning among students.
Moreover, it is also recommended to the researcher to use different inferential tools, if the
more factors will be included. This in turn assist to derive the valid conclusion and let the
University identified the key aspects which can be considered in order to improve the
learning.
Document Page
REFERENCES
Books and Journals
Bowman, N.A. and et.al., 2019. Understanding the link between noncognitive attributes and
college retention. Research in Higher Education. 60(2). pp.135-152.
Millea, M. and et.al., 2018. What matters in college student success? Determinants of college
retention and graduation rates. Education. 138(4). pp.309-322.
Sebastiani, M. and et.al., 2021. Retention rate of a second line with a biologic DMARD after
failure of a first-line therapy with abatacept, tocilizumab, or rituximab: results from the
Italian GISEA registry. Clinical Rheumatology, pp.1-9.
Zumwalt, K. and et.al., 2017. Recruitment, preparation, placement, and retention of alternate
route and college-prepared teachers: An early study of a New Jersey initiative. Teachers
College Record. 119(14). pp.1-32.
chevron_up_icon
1 out of 10
circle_padding
hide_on_mobile
zoom_out_icon
logo.png

Your All-in-One AI-Powered Toolkit for Academic Success.

Available 24*7 on WhatsApp / Email

[object Object]