OPAIC: Macroeconomic Analysis, Government Influence & Trade Impact
VerifiedAdded on 2023/03/23
|21
|3298
|97
Report
AI Summary
This report provides a comprehensive analysis of macroeconomic concepts, focusing on the impact of government policies and international trade. It begins by defining the Consumer Price Index (CPI) and its role in measuring inflation, followed by a discussion of Gross Domestic Product (GDP) calculation using the expenditure method and the limitations of national income estimates. The report further explores the effects of net migration, business confidence, and household savings on aggregate demand and supply. It also examines the role of monetary and fiscal policies in stabilizing economic growth and maintaining full employment, using the example of New Zealand's central bank and government. Finally, the report delves into international trade, analyzing comparative advantage and the potential impacts of trade liberalization on domestic industries.

Running head: BACHELOR OF APPLIED MANAGEMENT
Bachelor of Applied Management
Name of the Student
Name of the University
Course ID
Student ID
Bachelor of Applied Management
Name of the Student
Name of the University
Course ID
Student ID
Paraphrase This Document
Need a fresh take? Get an instant paraphrase of this document with our AI Paraphraser
1BACHELOR OF APPLIED MANAGEMENT
Table of Contents
Section A.........................................................................................................................................2
Answer 1......................................................................................................................................2
Answer 2......................................................................................................................................2
Section 2..........................................................................................................................................4
Answer 1......................................................................................................................................4
Answer 2......................................................................................................................................5
Answer 3......................................................................................................................................8
Section C........................................................................................................................................10
Answer 1....................................................................................................................................10
Answer 2....................................................................................................................................10
Answer 3....................................................................................................................................11
Section D.......................................................................................................................................12
Answer 1....................................................................................................................................12
Answer 2....................................................................................................................................13
Answer 3....................................................................................................................................14
Answer 4....................................................................................................................................15
List of References..........................................................................................................................18
2BACHELOR OF APPLIED MANAGEMENT
Section A
Answer 1
Consumer price index is an indicative measure of price level in a nation. CPI measures
the change in price of a certain basket of goods and services that household purchases to
maintain a certain standard of living in two different periods (Rao & Selvanathan, 2016). Rate of
change in CPI from one year to the next is termed as inflation rate. Rate of inflation in computed
from CPI using the following formula.
Inflation rate= CPIt −CPIt−1
CPIt −1
× 100
In New Zealand, the New Zealand department of statistics estimates Consumer Price
Index to measure price level in the nation. The department first determines basket of goods and
services. The spending pattern of household indicates relative importance of the selected items.
Different items in the CPI basket indicates spending pattern of New Zealand’s household
(stats.govt.nz, 2019). The department collects prices of goods and services over time. Based on
price and weight of relative items CPI is computed with the given formula
CPI= Price of desired basket ∈current year
Price of desired basket ∈base year × 100
Answer 2
Answer a
Given the information, GDP of the accounting year can be computed using the
expenditure method. The formula of GDP is given as follows
GDP=Cosumption+ Investment +Government expenditure+ Net export
⊘ This is a preview!⊘
Do you want full access?
Subscribe today to unlock all pages.
Trusted by 1+ million students worldwide
3BACHELOR OF APPLIED MANAGEMENT
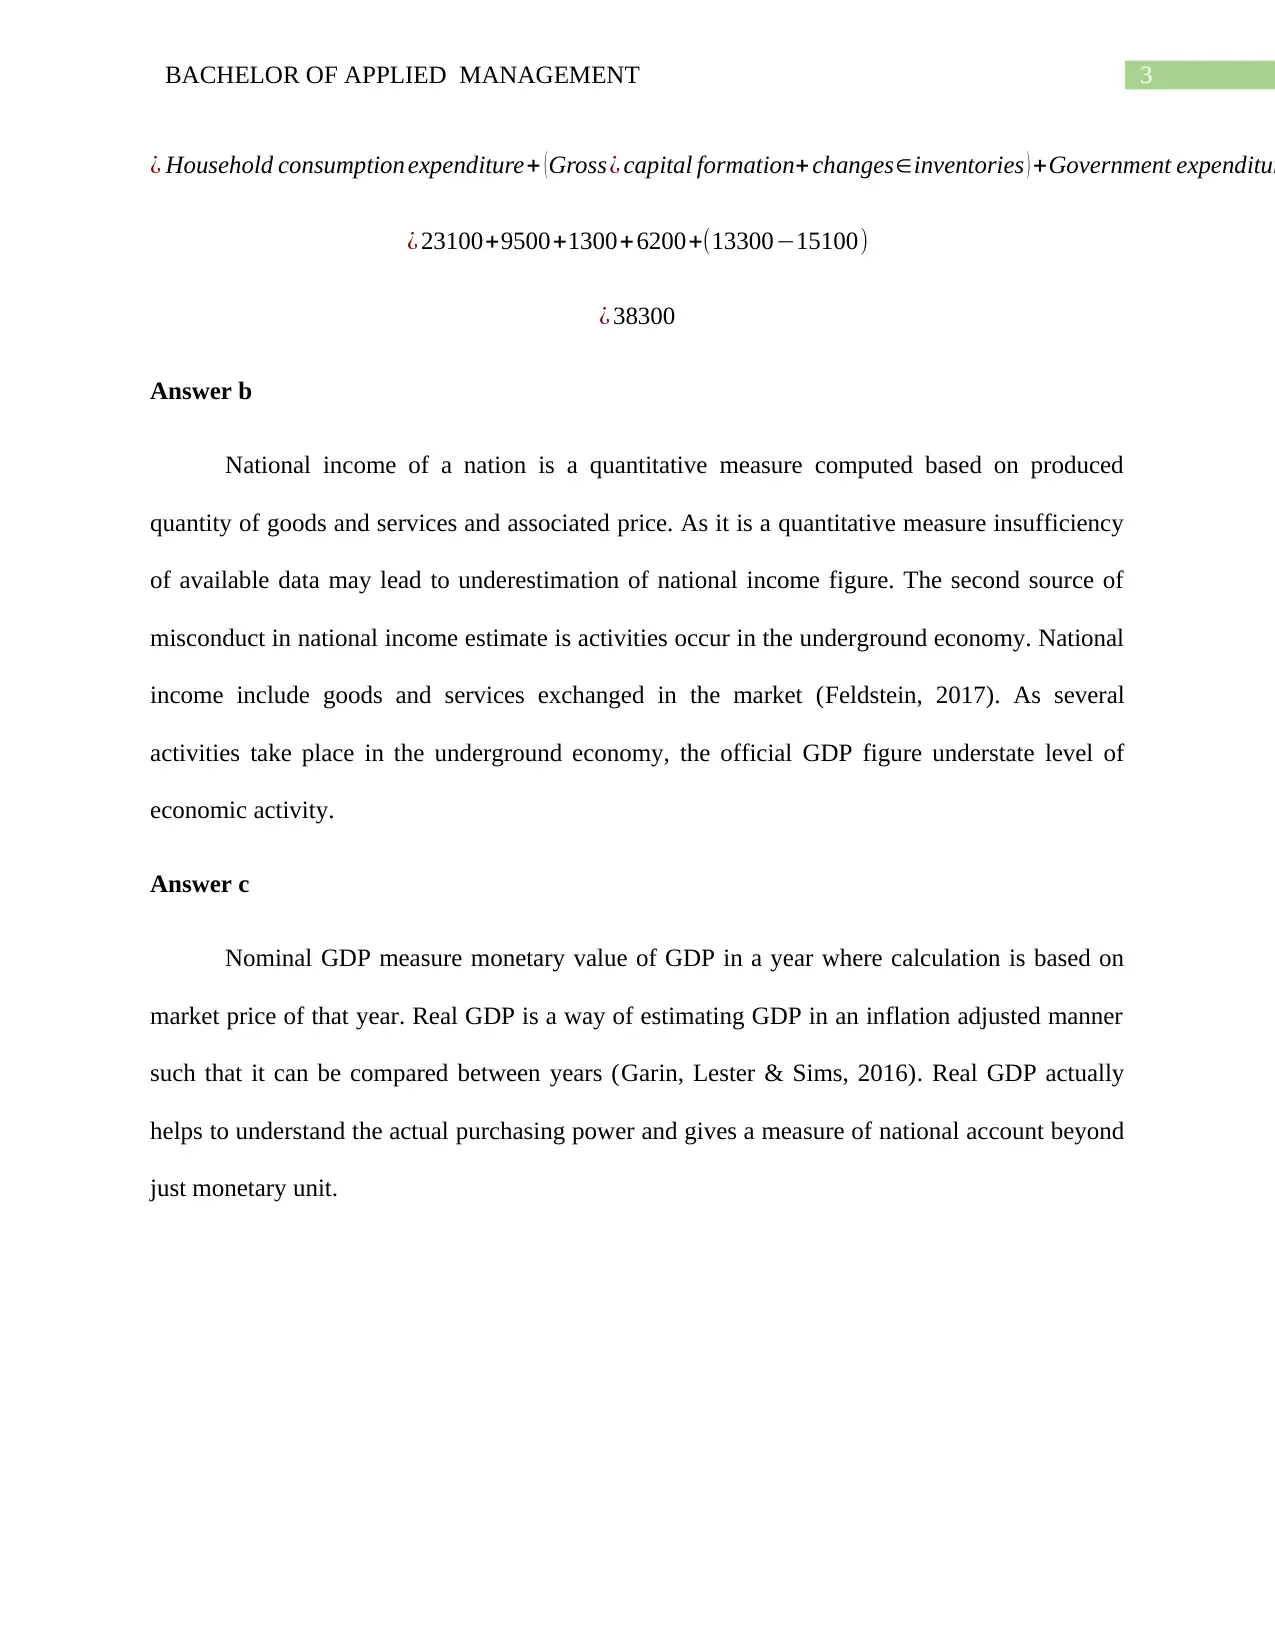
¿ Household consumption expenditure+ ( Gross¿ capital formation+ changes∈inventories ) +Government expenditur
¿ 23100+9500+1300+6200+(13300−15100)
¿ 38300
Answer b
National income of a nation is a quantitative measure computed based on produced
quantity of goods and services and associated price. As it is a quantitative measure insufficiency
of available data may lead to underestimation of national income figure. The second source of
misconduct in national income estimate is activities occur in the underground economy. National
income include goods and services exchanged in the market (Feldstein, 2017). As several
activities take place in the underground economy, the official GDP figure understate level of
economic activity.
Answer c
Nominal GDP measure monetary value of GDP in a year where calculation is based on
market price of that year. Real GDP is a way of estimating GDP in an inflation adjusted manner
such that it can be compared between years (Garin, Lester & Sims, 2016). Real GDP actually
helps to understand the actual purchasing power and gives a measure of national account beyond
just monetary unit.
Paraphrase This Document
Need a fresh take? Get an instant paraphrase of this document with our AI Paraphraser
4BACHELOR OF APPLIED MANAGEMENT
Answer d
Real GDP per capita represents a measure for economic output of a nation accounting for
number of people. It divides gross domestic product of the country by total population of the
country.
Answer e
Two measures alternative of GDP are Human Development Index (HDI) and Genuine
Progress Indicator (GPI). HDI measure effect of growth on people instead of its impact only on
the economy. Well-being under HDI is assessed in terms of income, level of education and state
of health. GPI includes several qualitative aspects of lives that GDP does not (Bleys & Whitby,
2016). The qualitative aspects evaluated under GPI include household work, volunteer work,
pollution, depletion of resources, changes in leisure time and such other.
Section 2
Answer 1
Net migration has significant influence on demand and supply side. As more and more
people from other countries, enter the nation, size of labor force increases. In the labor market,
an increase in supply of labor reduces equilibrium wage. Because of increasing migration flow,
producers now can have more labors at a relatively lower cost. This leads to an increase in
aggregate supply in the nation (Dustmann, Schonberg & Stuhler, 2016). On the other hand,
increase in net migration increase aggregate demand in the economy by increasing consumption
and other spending. As both aggregate demand and aggregate supply increases simultaneously,
there is an increase in equilibrium GDP. If aggregate demand and aggregate supply change by
5BACHELOR OF APPLIED MANAGEMENT
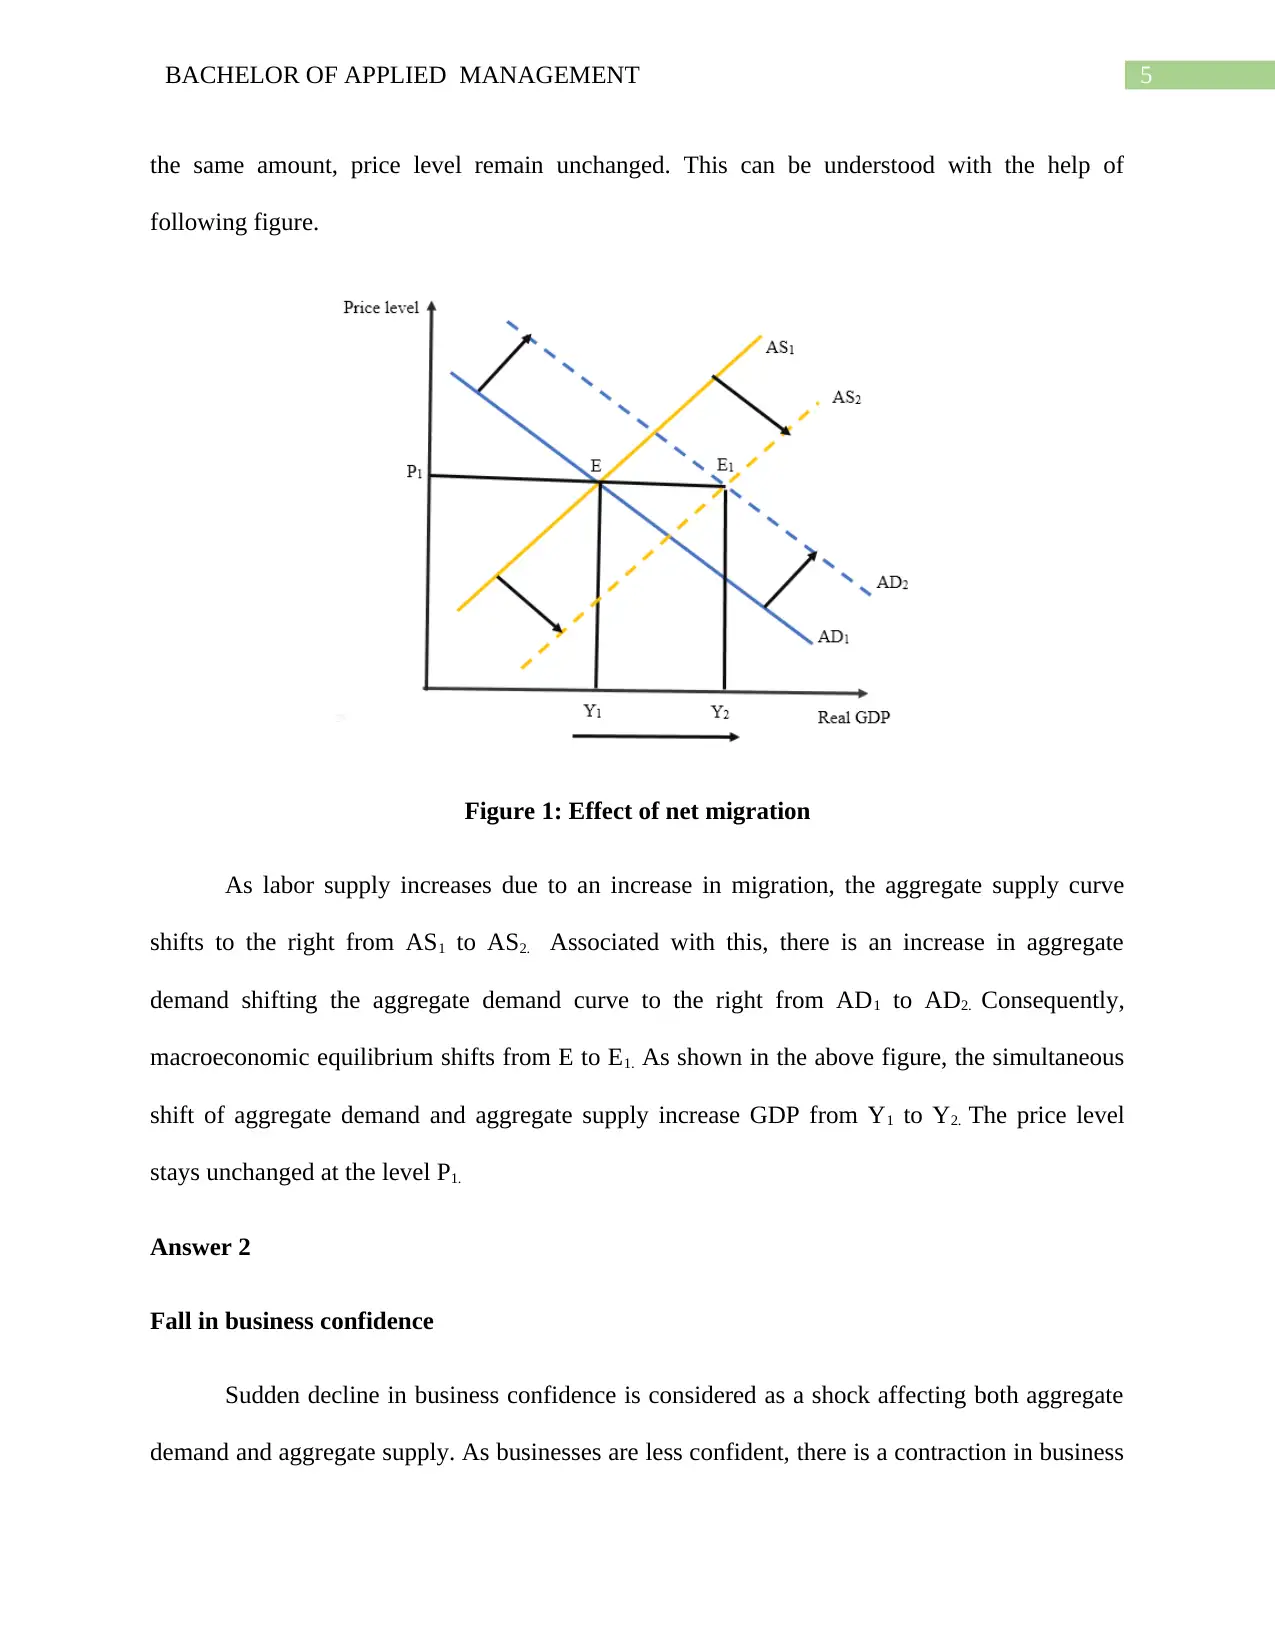
the same amount, price level remain unchanged. This can be understood with the help of
following figure.
Figure 1: Effect of net migration
As labor supply increases due to an increase in migration, the aggregate supply curve
shifts to the right from AS1 to AS2. Associated with this, there is an increase in aggregate
demand shifting the aggregate demand curve to the right from AD1 to AD2. Consequently,
macroeconomic equilibrium shifts from E to E1. As shown in the above figure, the simultaneous
shift of aggregate demand and aggregate supply increase GDP from Y1 to Y2. The price level
stays unchanged at the level P1.
Answer 2
Fall in business confidence
Sudden decline in business confidence is considered as a shock affecting both aggregate
demand and aggregate supply. As businesses are less confident, there is a contraction in business
⊘ This is a preview!⊘
Do you want full access?
Subscribe today to unlock all pages.
Trusted by 1+ million students worldwide
6BACHELOR OF APPLIED MANAGEMENT
activity. Lack of confidence encourage business personnel to reduce their investment in business.
The fall in investment reduces aggregate demand. As many businesses in the economy lowers,
their spending there is a decline in aggregate supply as well (Popp & Zhang, 2016). The
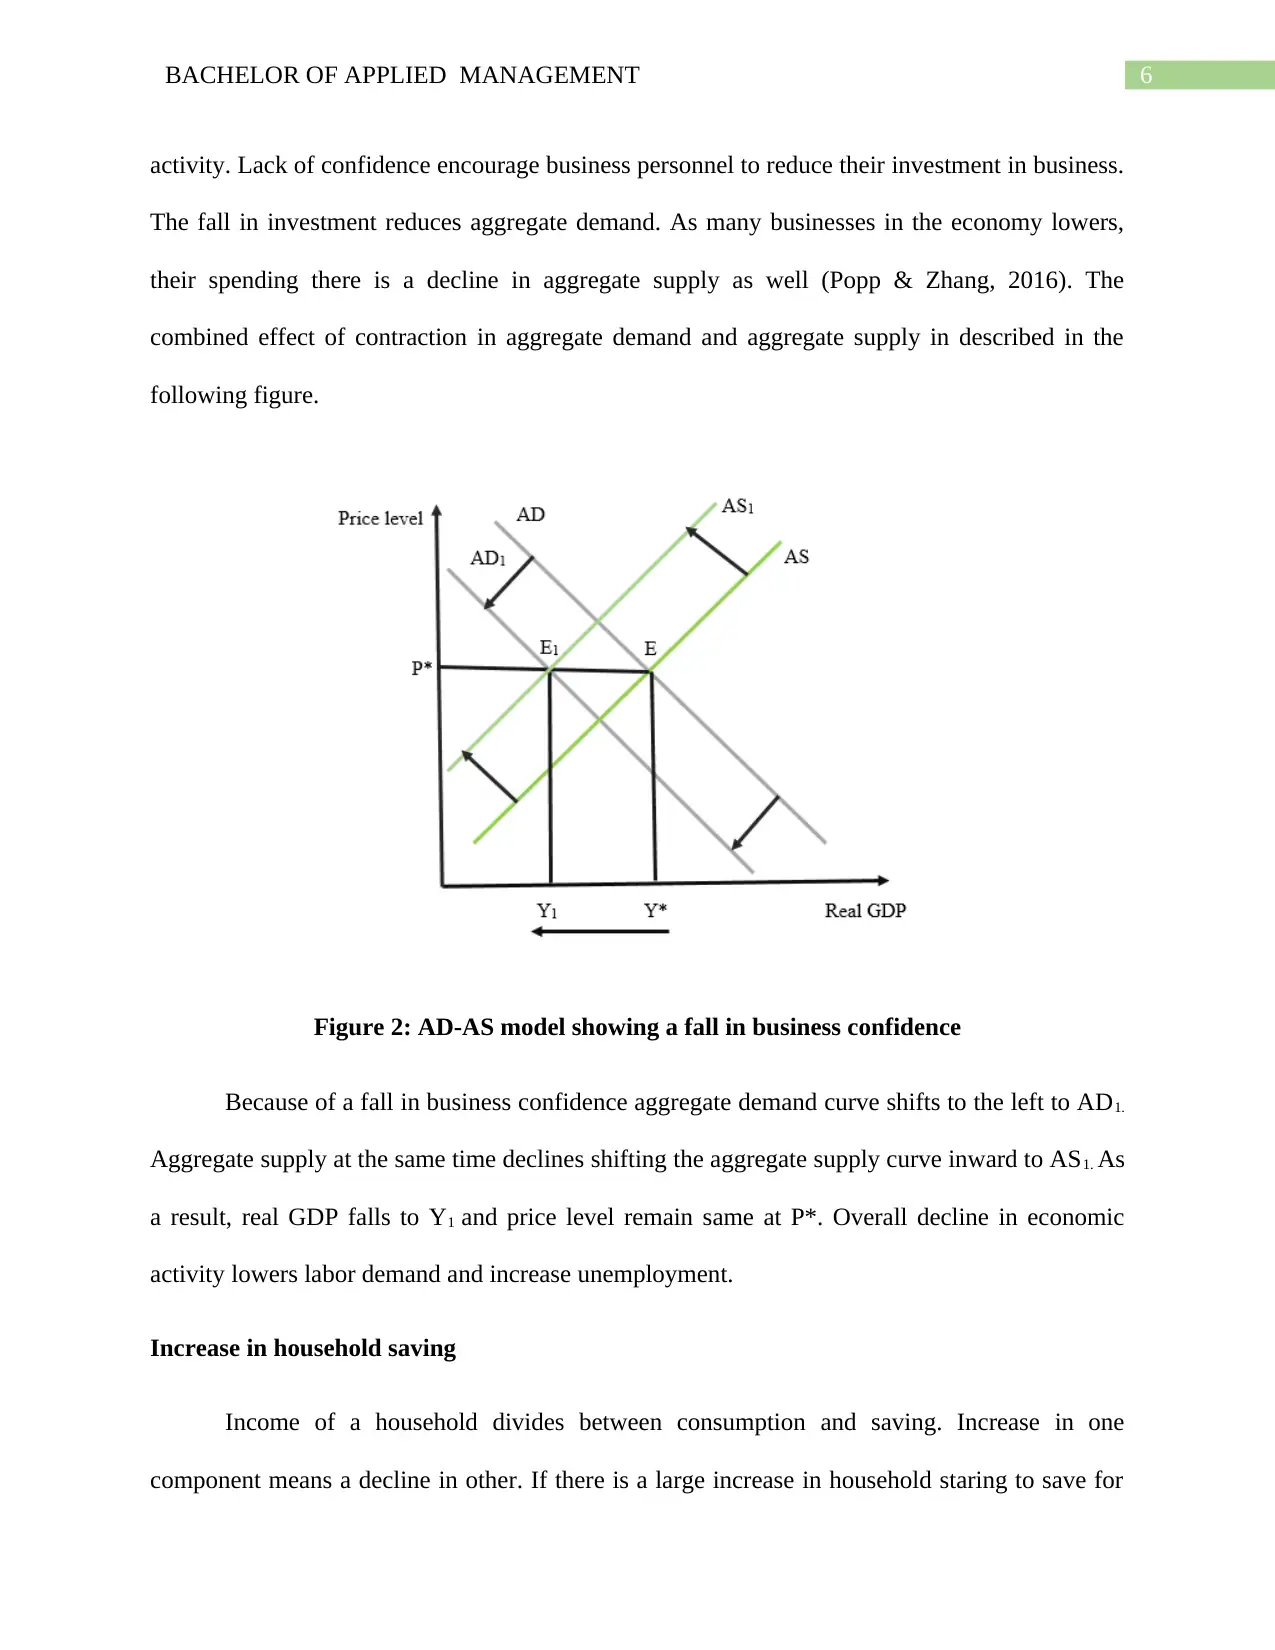
combined effect of contraction in aggregate demand and aggregate supply in described in the
following figure.
Figure 2: AD-AS model showing a fall in business confidence
Because of a fall in business confidence aggregate demand curve shifts to the left to AD1.
Aggregate supply at the same time declines shifting the aggregate supply curve inward to AS1. As
a result, real GDP falls to Y1 and price level remain same at P*. Overall decline in economic
activity lowers labor demand and increase unemployment.
Increase in household saving
Income of a household divides between consumption and saving. Increase in one
component means a decline in other. If there is a large increase in household staring to save for
activity. Lack of confidence encourage business personnel to reduce their investment in business.
The fall in investment reduces aggregate demand. As many businesses in the economy lowers,
their spending there is a decline in aggregate supply as well (Popp & Zhang, 2016). The
combined effect of contraction in aggregate demand and aggregate supply in described in the
following figure.
Figure 2: AD-AS model showing a fall in business confidence
Because of a fall in business confidence aggregate demand curve shifts to the left to AD1.
Aggregate supply at the same time declines shifting the aggregate supply curve inward to AS1. As
a result, real GDP falls to Y1 and price level remain same at P*. Overall decline in economic
activity lowers labor demand and increase unemployment.
Increase in household saving
Income of a household divides between consumption and saving. Increase in one
component means a decline in other. If there is a large increase in household staring to save for
Paraphrase This Document
Need a fresh take? Get an instant paraphrase of this document with our AI Paraphraser
7BACHELOR OF APPLIED MANAGEMENT
their retirement, the current demand for consumption expenditure reduces. A fall in
consumption expenditure lowers aggregate demand. The effect of a fall in aggregate demand due
to increase in saving reduces real GDP and price level (Mankiw, 2016). As real GDP declines,
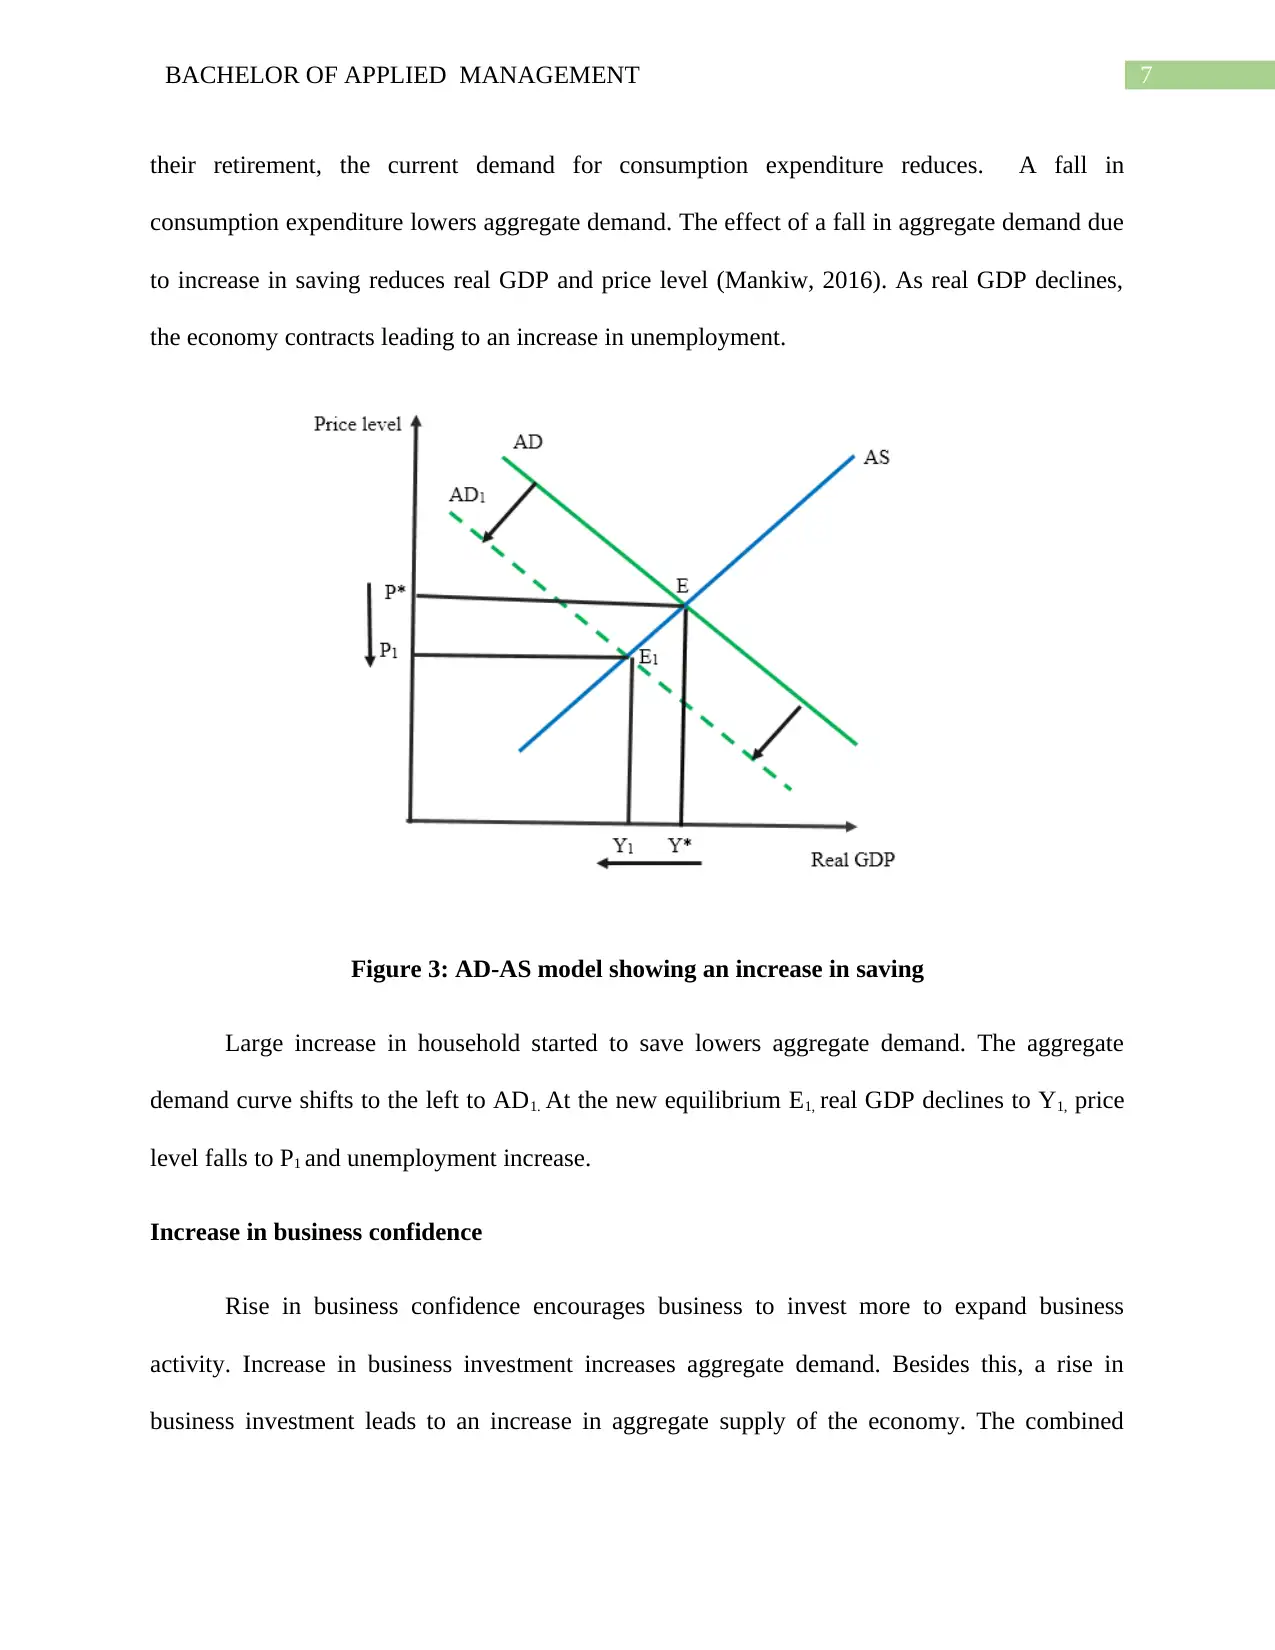
the economy contracts leading to an increase in unemployment.
Figure 3: AD-AS model showing an increase in saving
Large increase in household started to save lowers aggregate demand. The aggregate
demand curve shifts to the left to AD1. At the new equilibrium E1, real GDP declines to Y1, price
level falls to P1 and unemployment increase.
Increase in business confidence
Rise in business confidence encourages business to invest more to expand business
activity. Increase in business investment increases aggregate demand. Besides this, a rise in
business investment leads to an increase in aggregate supply of the economy. The combined
their retirement, the current demand for consumption expenditure reduces. A fall in
consumption expenditure lowers aggregate demand. The effect of a fall in aggregate demand due
to increase in saving reduces real GDP and price level (Mankiw, 2016). As real GDP declines,
the economy contracts leading to an increase in unemployment.
Figure 3: AD-AS model showing an increase in saving
Large increase in household started to save lowers aggregate demand. The aggregate
demand curve shifts to the left to AD1. At the new equilibrium E1, real GDP declines to Y1, price
level falls to P1 and unemployment increase.
Increase in business confidence
Rise in business confidence encourages business to invest more to expand business
activity. Increase in business investment increases aggregate demand. Besides this, a rise in
business investment leads to an increase in aggregate supply of the economy. The combined
8BACHELOR OF APPLIED MANAGEMENT
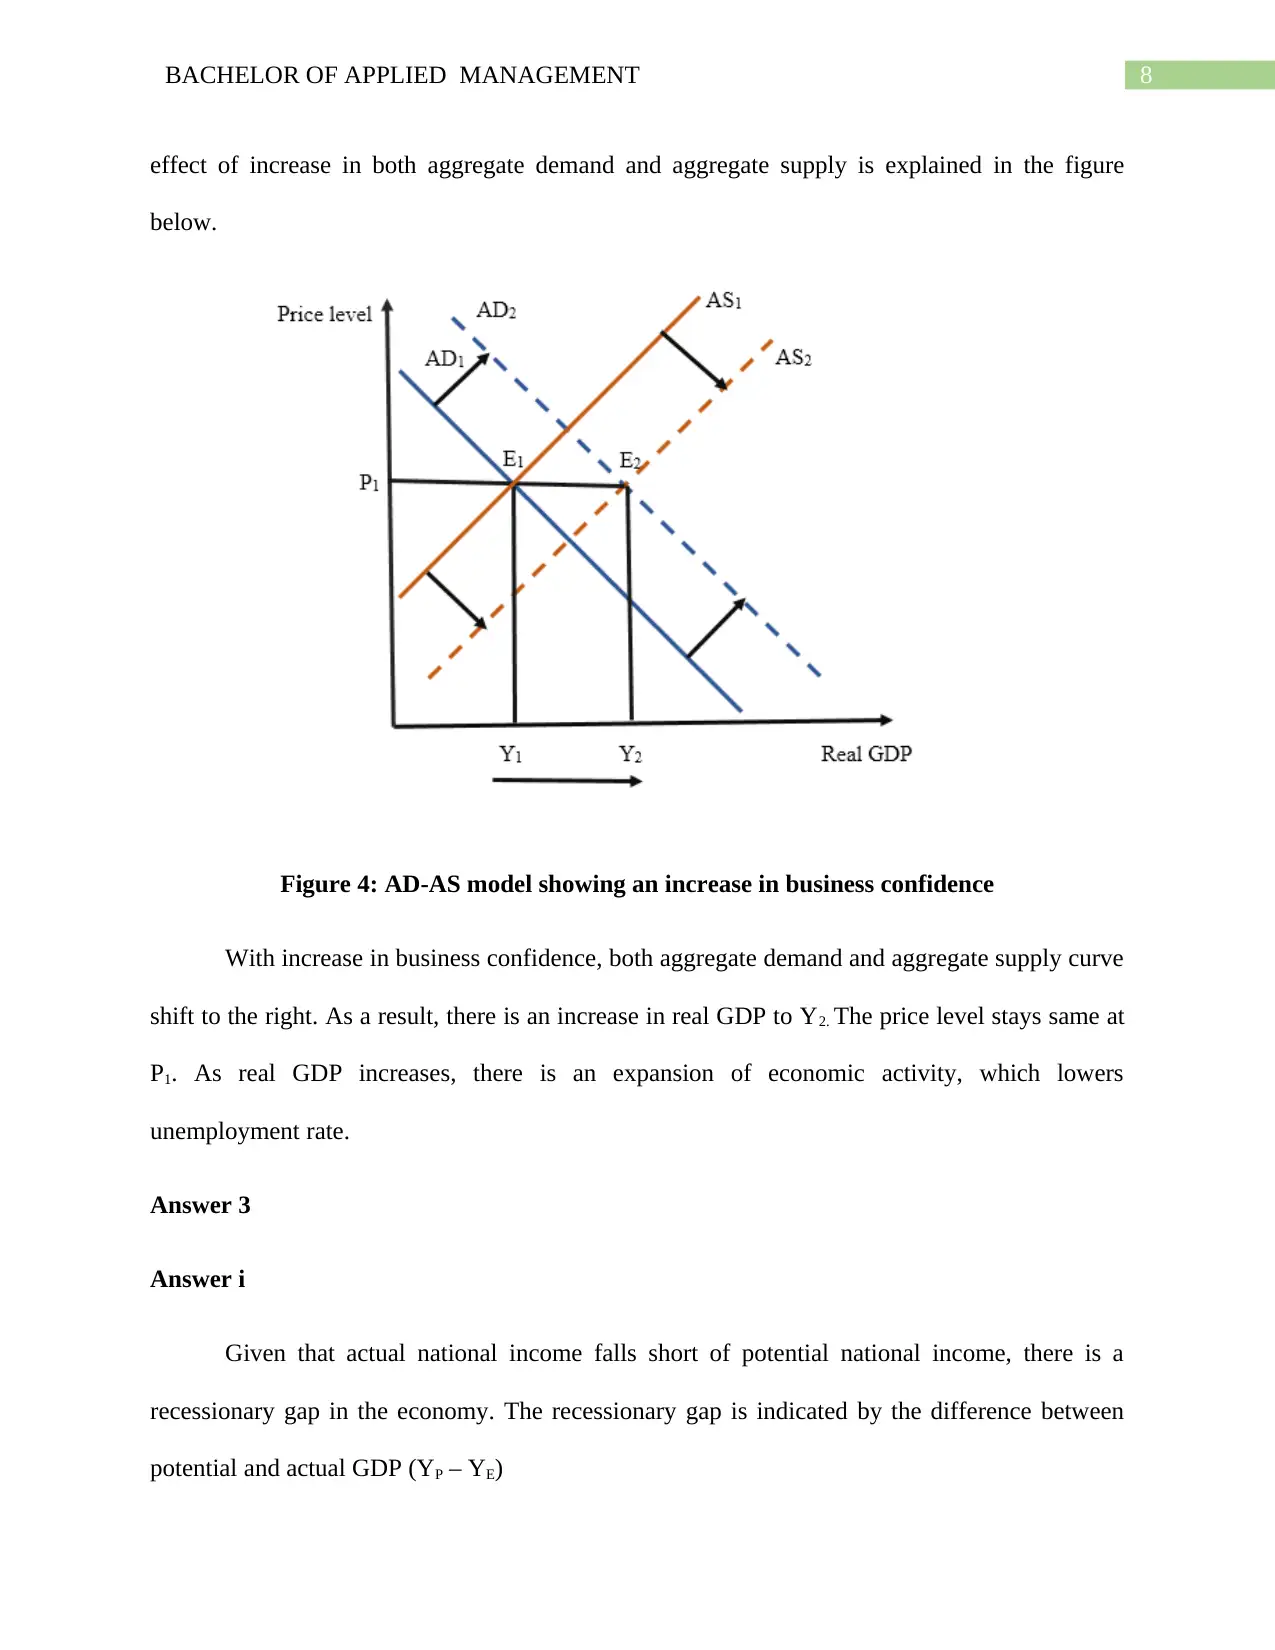
effect of increase in both aggregate demand and aggregate supply is explained in the figure
below.
Figure 4: AD-AS model showing an increase in business confidence
With increase in business confidence, both aggregate demand and aggregate supply curve
shift to the right. As a result, there is an increase in real GDP to Y2. The price level stays same at
P1. As real GDP increases, there is an expansion of economic activity, which lowers
unemployment rate.
Answer 3
Answer i
Given that actual national income falls short of potential national income, there is a
recessionary gap in the economy. The recessionary gap is indicated by the difference between
potential and actual GDP (YP – YE)
⊘ This is a preview!⊘
Do you want full access?
Subscribe today to unlock all pages.
Trusted by 1+ million students worldwide
9BACHELOR OF APPLIED MANAGEMENT
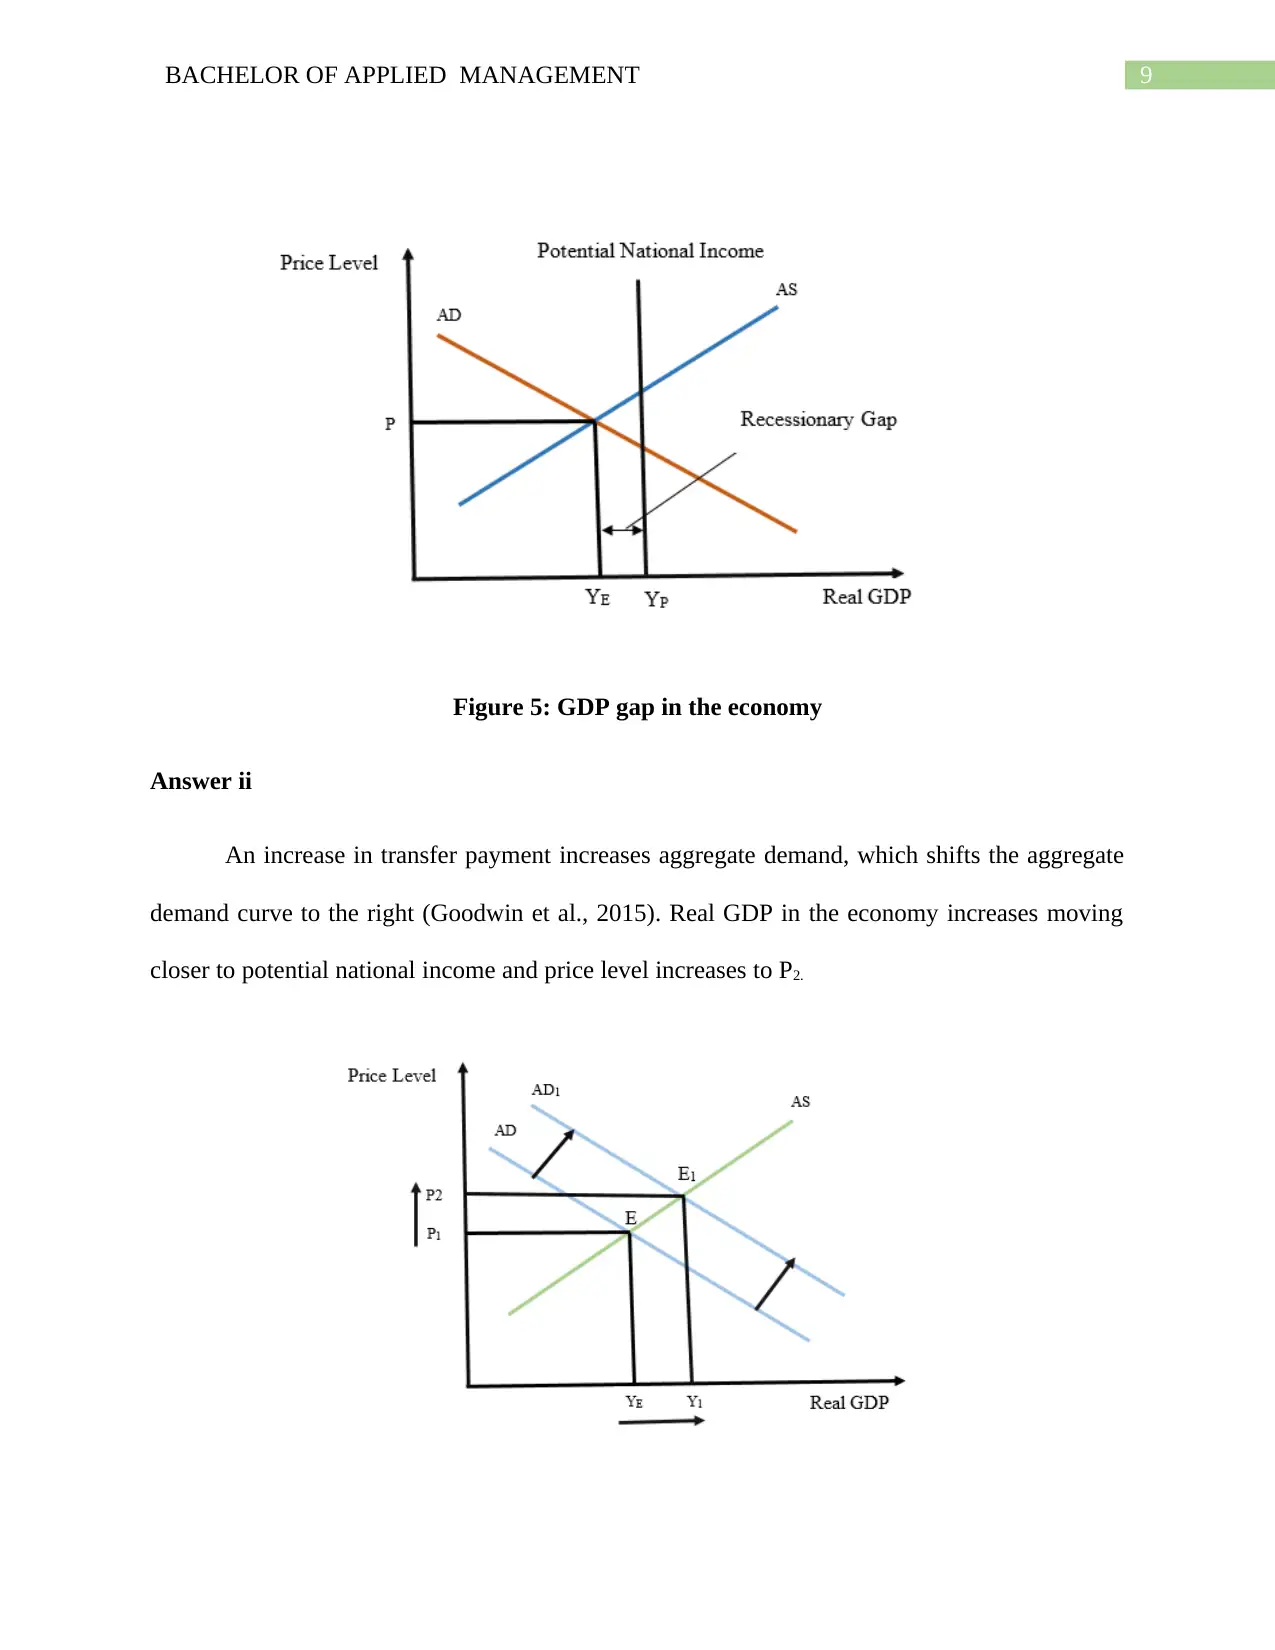
Figure 5: GDP gap in the economy
Answer ii
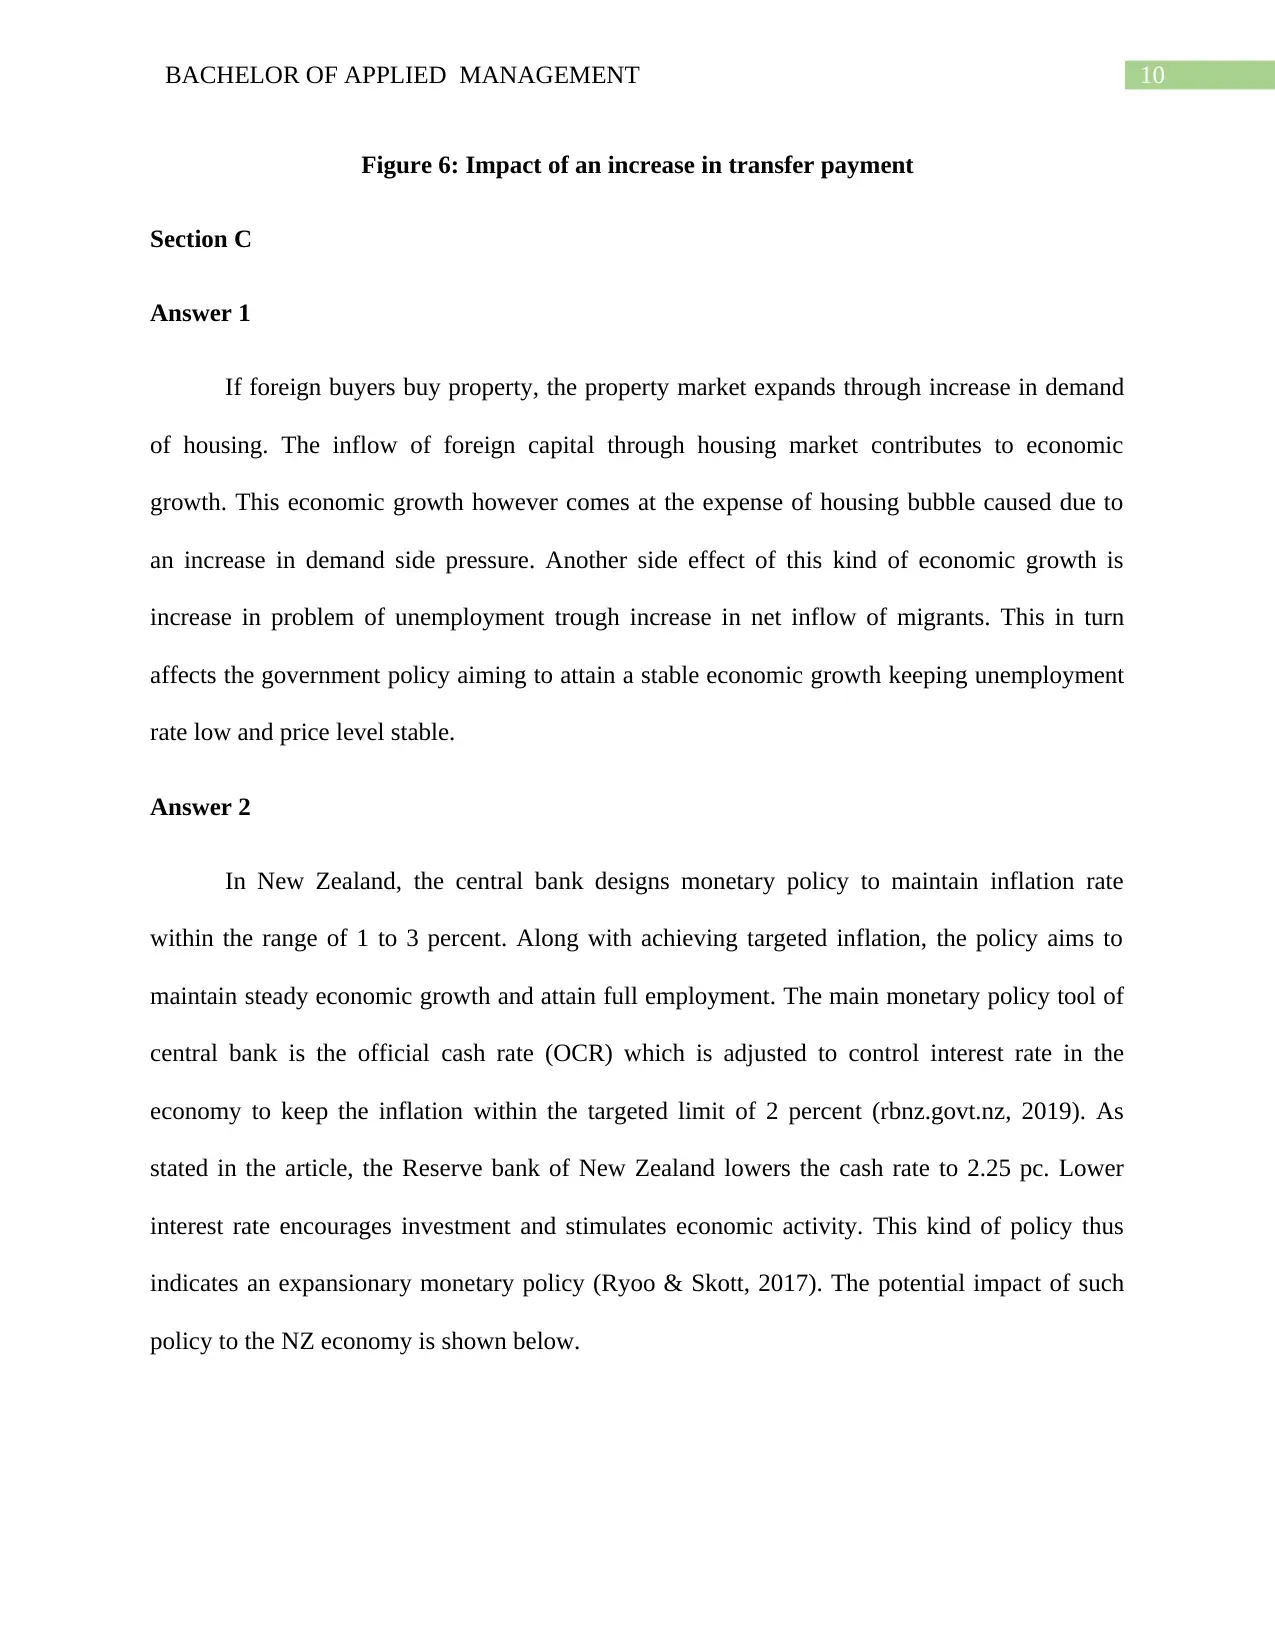
An increase in transfer payment increases aggregate demand, which shifts the aggregate
demand curve to the right (Goodwin et al., 2015). Real GDP in the economy increases moving
closer to potential national income and price level increases to P2.
Figure 5: GDP gap in the economy
Answer ii
An increase in transfer payment increases aggregate demand, which shifts the aggregate
demand curve to the right (Goodwin et al., 2015). Real GDP in the economy increases moving
closer to potential national income and price level increases to P2.
Paraphrase This Document
Need a fresh take? Get an instant paraphrase of this document with our AI Paraphraser
10BACHELOR OF APPLIED MANAGEMENT
Figure 6: Impact of an increase in transfer payment
Section C
Answer 1
If foreign buyers buy property, the property market expands through increase in demand
of housing. The inflow of foreign capital through housing market contributes to economic
growth. This economic growth however comes at the expense of housing bubble caused due to
an increase in demand side pressure. Another side effect of this kind of economic growth is
increase in problem of unemployment trough increase in net inflow of migrants. This in turn
affects the government policy aiming to attain a stable economic growth keeping unemployment
rate low and price level stable.
Answer 2
In New Zealand, the central bank designs monetary policy to maintain inflation rate
within the range of 1 to 3 percent. Along with achieving targeted inflation, the policy aims to
maintain steady economic growth and attain full employment. The main monetary policy tool of
central bank is the official cash rate (OCR) which is adjusted to control interest rate in the
economy to keep the inflation within the targeted limit of 2 percent (rbnz.govt.nz, 2019). As
stated in the article, the Reserve bank of New Zealand lowers the cash rate to 2.25 pc. Lower
interest rate encourages investment and stimulates economic activity. This kind of policy thus
indicates an expansionary monetary policy (Ryoo & Skott, 2017). The potential impact of such
policy to the NZ economy is shown below.
11BACHELOR OF APPLIED MANAGEMENT
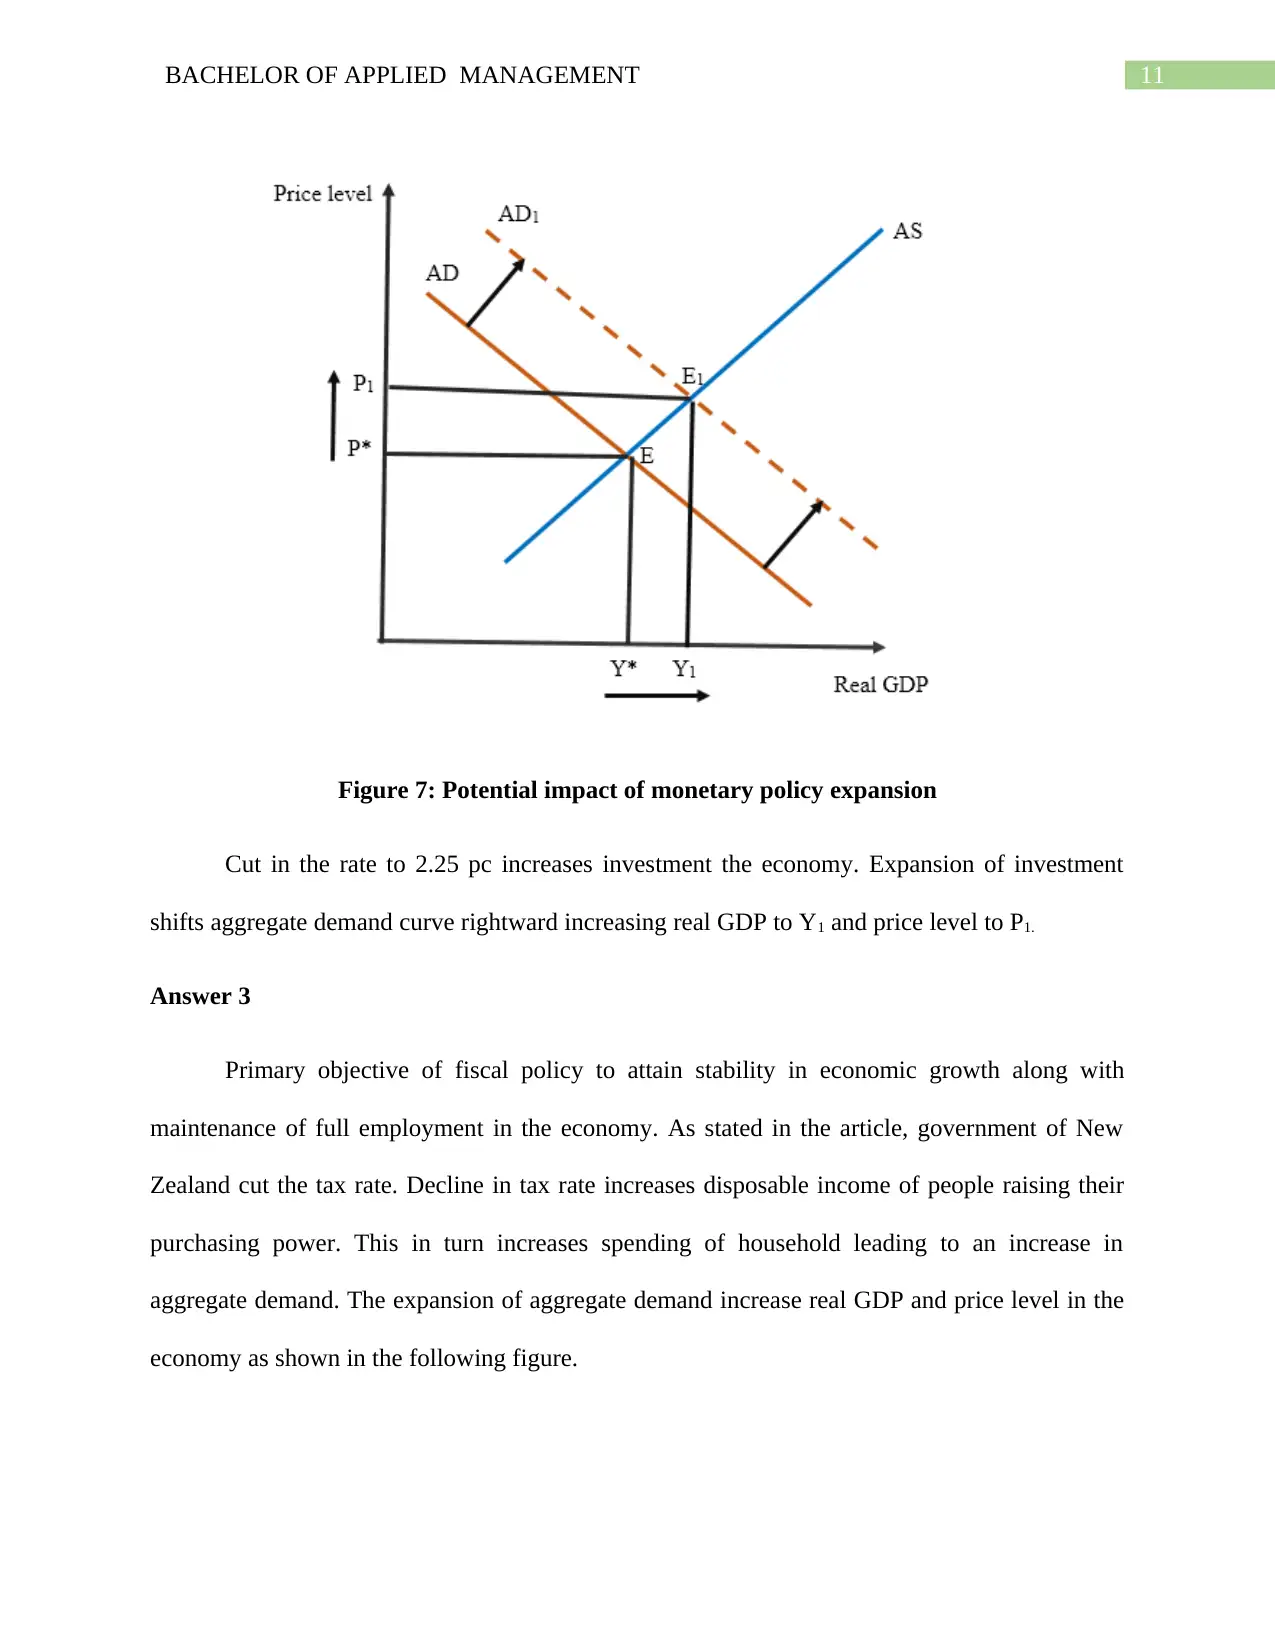
Figure 7: Potential impact of monetary policy expansion
Cut in the rate to 2.25 pc increases investment the economy. Expansion of investment
shifts aggregate demand curve rightward increasing real GDP to Y1 and price level to P1.
Answer 3
Primary objective of fiscal policy to attain stability in economic growth along with
maintenance of full employment in the economy. As stated in the article, government of New
Zealand cut the tax rate. Decline in tax rate increases disposable income of people raising their
purchasing power. This in turn increases spending of household leading to an increase in
aggregate demand. The expansion of aggregate demand increase real GDP and price level in the
economy as shown in the following figure.
⊘ This is a preview!⊘
Do you want full access?
Subscribe today to unlock all pages.
Trusted by 1+ million students worldwide
1 out of 21
Related Documents


Your All-in-One AI-Powered Toolkit for Academic Success.
+13062052269
info@desklib.com
Available 24*7 on WhatsApp / Email
![[object Object]](/_next/static/media/star-bottom.7253800d.svg)
Unlock your academic potential
Copyright © 2020–2026 A2Z Services. All Rights Reserved. Developed and managed by ZUCOL.