ECON6001 Report: Analyzing OPEC's Impact on Global Oil Prices

Verified

Added on  2023/03/21

|8
|1594
|72
Report
AI Summary
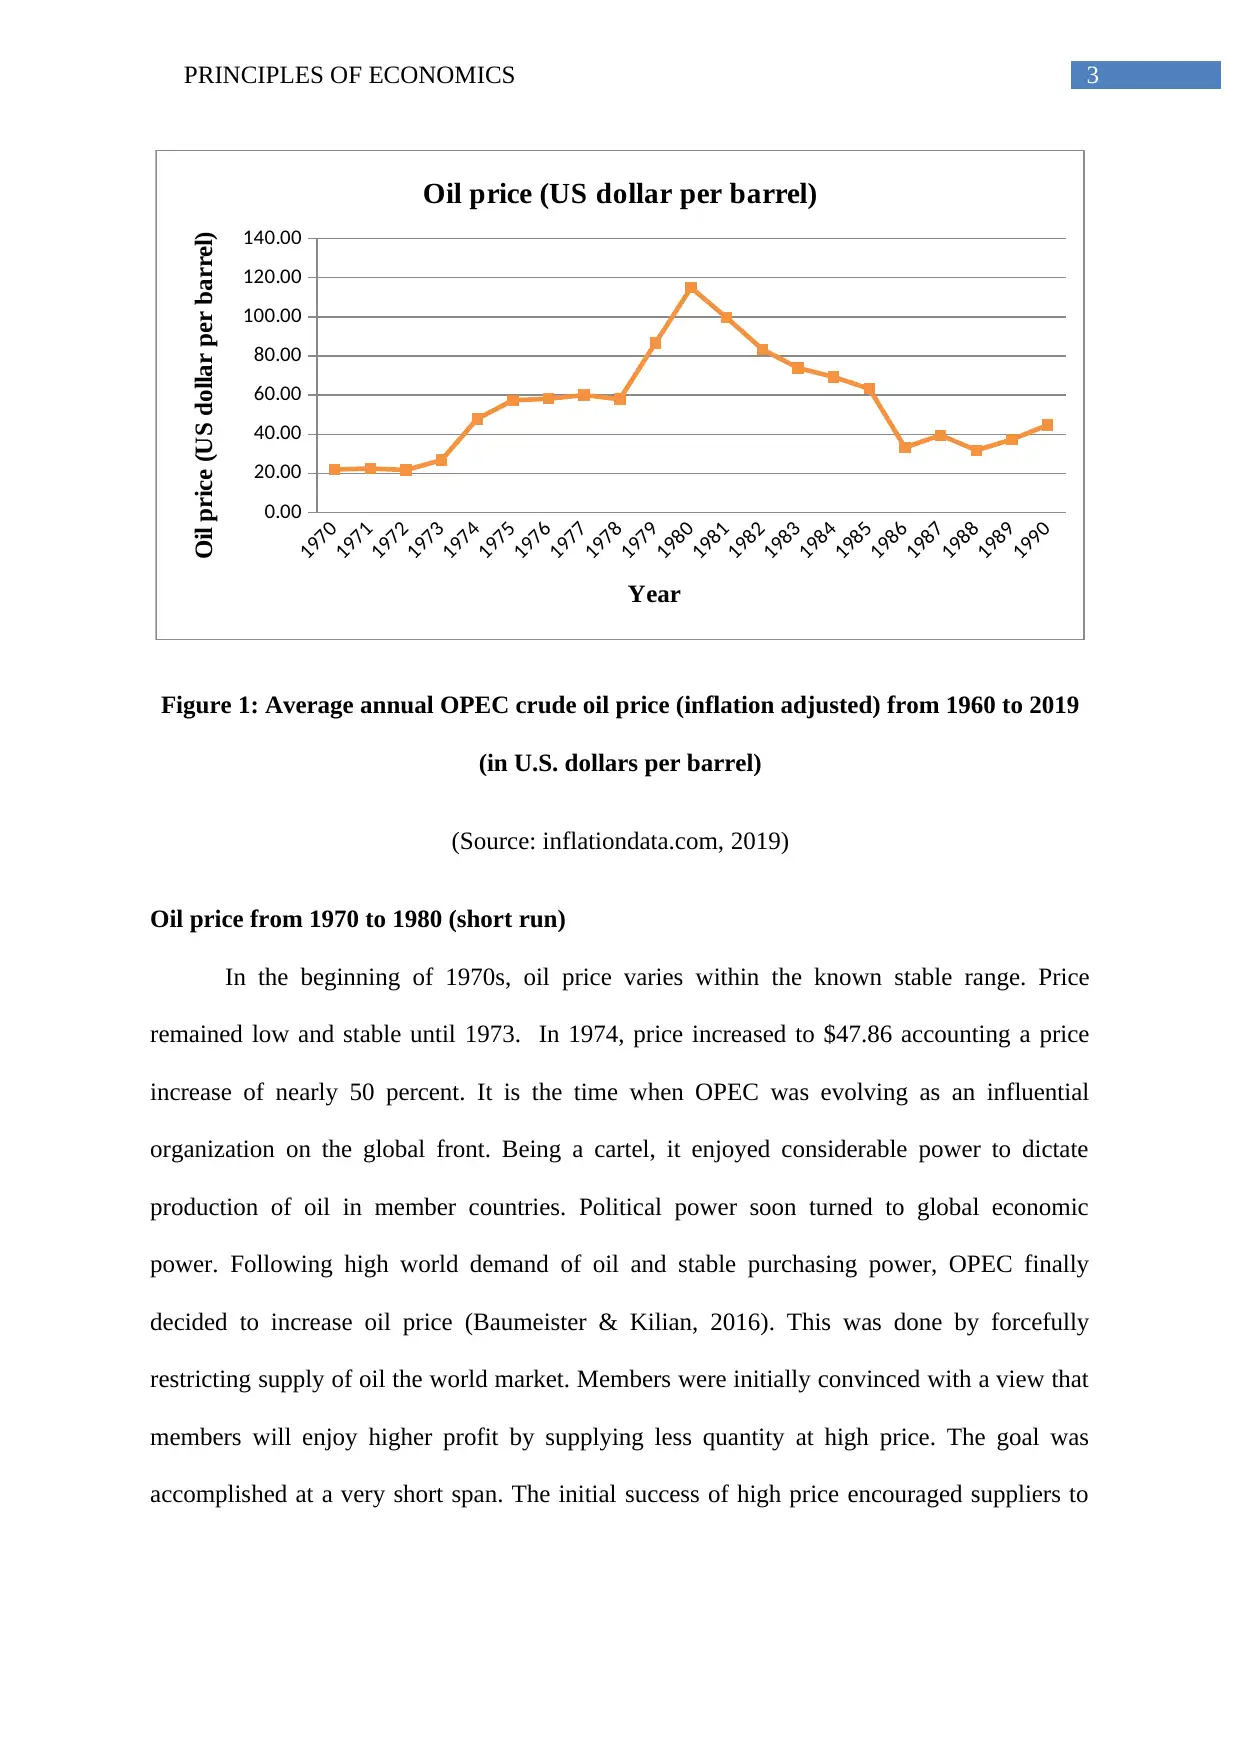
This report analyzes the impact of OPEC's decisions on global oil prices from 1970 to 1990, focusing on the economic principles of supply, demand, and elasticity. The analysis begins with an overview of OPEC's formation and its increasing influence in the global oil market, leading to price manipulation to increase member nations' profitability. The report examines the short-run effects of OPEC's price increases, explaining how inelastic supply and demand allowed for revenue increases. It then explores the long-run consequences, where increased supply and demand elasticity led to declining revenues. The report highlights how changes in market conditions, including responses from both suppliers and consumers, ultimately undermined OPEC's ability to sustain high oil prices. The conclusion summarizes the findings and reiterates the importance of understanding the interplay of supply, demand, and elasticity in determining oil prices.
Document Page
Running Head: PRINCIPLES OF ECONOMICS
Principles of Economics
Name of the Student
Name of the University
Course ID
tabler-icon-diamond-filled.svg

Paraphrase This Document

Need a fresh take? Get an instant paraphrase of this document with our AI Paraphraser
Document Page
1PRINCIPLES OF ECONOMICS
Table of Contents
Introduction................................................................................................................................2
Analysis of world oil price trend................................................................................................2
Oil price from 1970 to 1980 (short run).................................................................................3
Oil price from 1981to 1990 (long run)...................................................................................5
Conclusion..................................................................................................................................6
References..................................................................................................................................7
Document Page
2PRINCIPLES OF ECONOMICS
Introduction
OPEC appeared as an international organization since 1960. Initially top five
exporters were active members of OPEC. Gaining support from top oil exporters OPEC
gradually became one of the largest institutions having significant power to manipulate price
and supply of oil in the global market. In order to increase profitability member nations,
OPEC took the decision to increase oil price since 1970. Global economy faced serious
trouble in the beginning years of price rise (Griffin & Teece, 2016). However, the initial
success from price increases did not sustain for a long period. Realizing failure of decision
OPEC members finally decided to make a downward revision of price since 1980. The
inability of OPEC members to sustain high price for a significantly long period can be
explained using the concept of demand, supply and elasticity.
Analysis of world oil price trend
The period of 1960 was the period of formation of OPEC. During this decade, oil
price almost followed a stable trend with price varying within the affordable range. The
advent of OPEC was expected to contribute to the stability by forming a cartel in export
market. From 1968 to 1970 inflation adjusted oil price remained around $23 per barrel.
Purchasing power of people remained also at a stable level. By the time, OPEC grew stronger
and more members joined the organization. As OPEC appeared as a strong organization in
the global market, it thought of utilizing its power in manipulating word oil price. This led to
an oil price glut since 1973 (Kisswani, 2014). The figure below shows trend in global oil
price from 1970 to 1990.
Document Page
3PRINCIPLES OF ECONOMICS
1970
1971
1972
1973
1974
1975
1976
1977
1978
1979
1980
1981
1982
1983
1984
1985
1986
1987
1988
1989
1990
0.00
20.00
40.00
60.00
80.00
100.00
120.00
140.00
Oil price (US dollar per barrel)
Year
Oil price (US dollar per barrel)
Figure 1: Average annual OPEC crude oil price (inflation adjusted) from 1960 to 2019
(in U.S. dollars per barrel)
(Source: inflationdata.com, 2019)
Oil price from 1970 to 1980 (short run)
In the beginning of 1970s, oil price varies within the known stable range. Price
remained low and stable until 1973. In 1974, price increased to $47.86 accounting a price
increase of nearly 50 percent. It is the time when OPEC was evolving as an influential
organization on the global front. Being a cartel, it enjoyed considerable power to dictate
production of oil in member countries. Political power soon turned to global economic
power. Following high world demand of oil and stable purchasing power, OPEC finally
decided to increase oil price (Baumeister & Kilian, 2016). This was done by forcefully
restricting supply of oil the world market. Members were initially convinced with a view that
members will enjoy higher profit by supplying less quantity at high price. The goal was
accomplished at a very short span. The initial success of high price encouraged suppliers to
tabler-icon-diamond-filled.svg

Paraphrase This Document

Need a fresh take? Get an instant paraphrase of this document with our AI Paraphraser
Document Page
4PRINCIPLES OF ECONOMICS
stick to their decision. Price continuously increased since 1974 reaching peak in 1980 with
inflation adjusted price being $114.93 in 1980.
The initial success of OPEC members to maintain a high price is explained with the
help of supply and demand condition in the short run. In the short run, supply and demand are
relatively inelastic compared to long run. Supply is inelastic because known sources of oil
cannot be changed in short span. Oil supply in the short run continuously depend on supply
of exiting source . Therefore, each OPEC members has to reduce their supply by only a small
extent to maintain a high price. Demand is also inelastic as people are unable to revise oil
demand in a short notice. People continue to use their old cars that usually consumed heavy
fuels (Varian, 2014). In the short run thus, as increase in price of oil was associated with a
smaller decline in quantity sold. The inelastic supply and demand caused OPEC’s revenue to
increase from a higher price. This is explained in figure 2.
Figure 2: Short run demand and supply of oil
In the short run, market demand curve is denoted DD and that of the supply curve is
denoted as SS. Both demand and supply curve are steeper because of inelastic nature of
Document Page
5PRINCIPLES OF ECONOMICS
demand and supply. Initially equilibrium is at E with price and quantity being P1 and Q1
respectively. A decline in supply by OPEC members shifts the supply curve to the left to S1S1.
Equilibrium shifts from E to E1. Price increases from P1 to P2 while quantity lowers from Q1
to Q2. The price increase in the short run associated with a smaller decline in quantity causing
revenue to increase.
Oil price from 1981to 1990 (long run)
After reaching peak in 1980, oil price started to decline since 1981. After 6 years of
price increase, it became difficult to sustain a high price. After longer period of price
increase, the situation changed in the long run. Demand and supply started to response to
rising price. High price encourage other suppliers to increase oil supply. They explored new
technology to increase their extraction capacity (Ansari, 2017). On the demand side, buyers
across the world started to adjust their fuel consumption much as possible. In this situation to
maintain a high price, OPEC members has to lower quantity has to be reduced largely. The
proportionate decrease in quantity exceeded the proportionate increase in price resulting in a
decline in revenue for suppliers (Baumeister & Peersman, 2013). Figure 3 portraits the
market condition in the long run.
Document Page
6PRINCIPLES OF ECONOMICS
Figure 3: Long run demand and supply of oil
The demand and supply curve in the long-run become flatter due to increase in
adjustment in both demand and supply (Baumol & Blinder, 2015). The decline in supply
causes prices to increase to P2 and quantity to decline to Q2. It is clearly indicated from the
figure that P1P2<Q1Q2. In the long run thus OPEC member started to experience a decline in
revenue. Oil price thus began to fall. Oil price in 1990 reached almost to the level of 1960s.
Conclusion
Organization of Petroleum Oil Exporting Countries (OPEC) is an important
organization controlling a major share of world oil exports. One crucial phase of crude oil
price is that from 1970-1990. The decision to price increase by OPEC members was
successful in the first few years of 1970s. The short run success of OPEC was due to
relatively inelastic demand and supply. In the long-run, demand and supply of oil become
relatively elastic making it difficult for OPEC countries to sustain the high price.
tabler-icon-diamond-filled.svg

Paraphrase This Document

Need a fresh take? Get an instant paraphrase of this document with our AI Paraphraser
Document Page
7PRINCIPLES OF ECONOMICS
References
Ansari, D. (2017). OPEC, Saudi Arabia, and the shale revolution: Insights from equilibrium
modelling and oil politics. Energy Policy, 111, 166-178.
Baumeister, C., & Kilian, L. (2016). Forty years of oil price fluctuations: Why the price of oil
may still surprise us. Journal of Economic Perspectives, 30(1), 139-60.
Baumeister, C., & Peersman, G. (2013). The role of timevarying price elasticities in
accounting for volatility changes in the crude oil market. Journal of Applied
Econometrics, 28(7), 1087-1109.
Baumol, W. J., & Blinder, A. S. (2015). Microeconomics: Principles and policy. Nelson
Education.
Griffin, J. M., & Teece, D. J. (2016). OPEC behaviour and world oil prices. Routledge.
inflationdata.com. (2019). Historical Crude Oil Prices (Table). Retrieved from
https://inflationdata.com/articles/inflation-adjusted-prices/historical-crude-oil-prices-
table/
Kisswani, K. (2014). OPEC and political considerations when deciding on oil
extraction. Journal of Economics and Finance, 38(1), 96-118.
Varian, H. R. (2014). Intermediate microeconomics with calculus: a modern approach. WW
Norton & Company.
chevron_up_icon
1 out of 8
circle_padding
hide_on_mobile
zoom_out_icon
[object Object]