Operation Management M3 Assignment Solution - University Name

Verified

Added on  2022/09/18

|7
|1160
|37
Homework Assignment
AI Summary
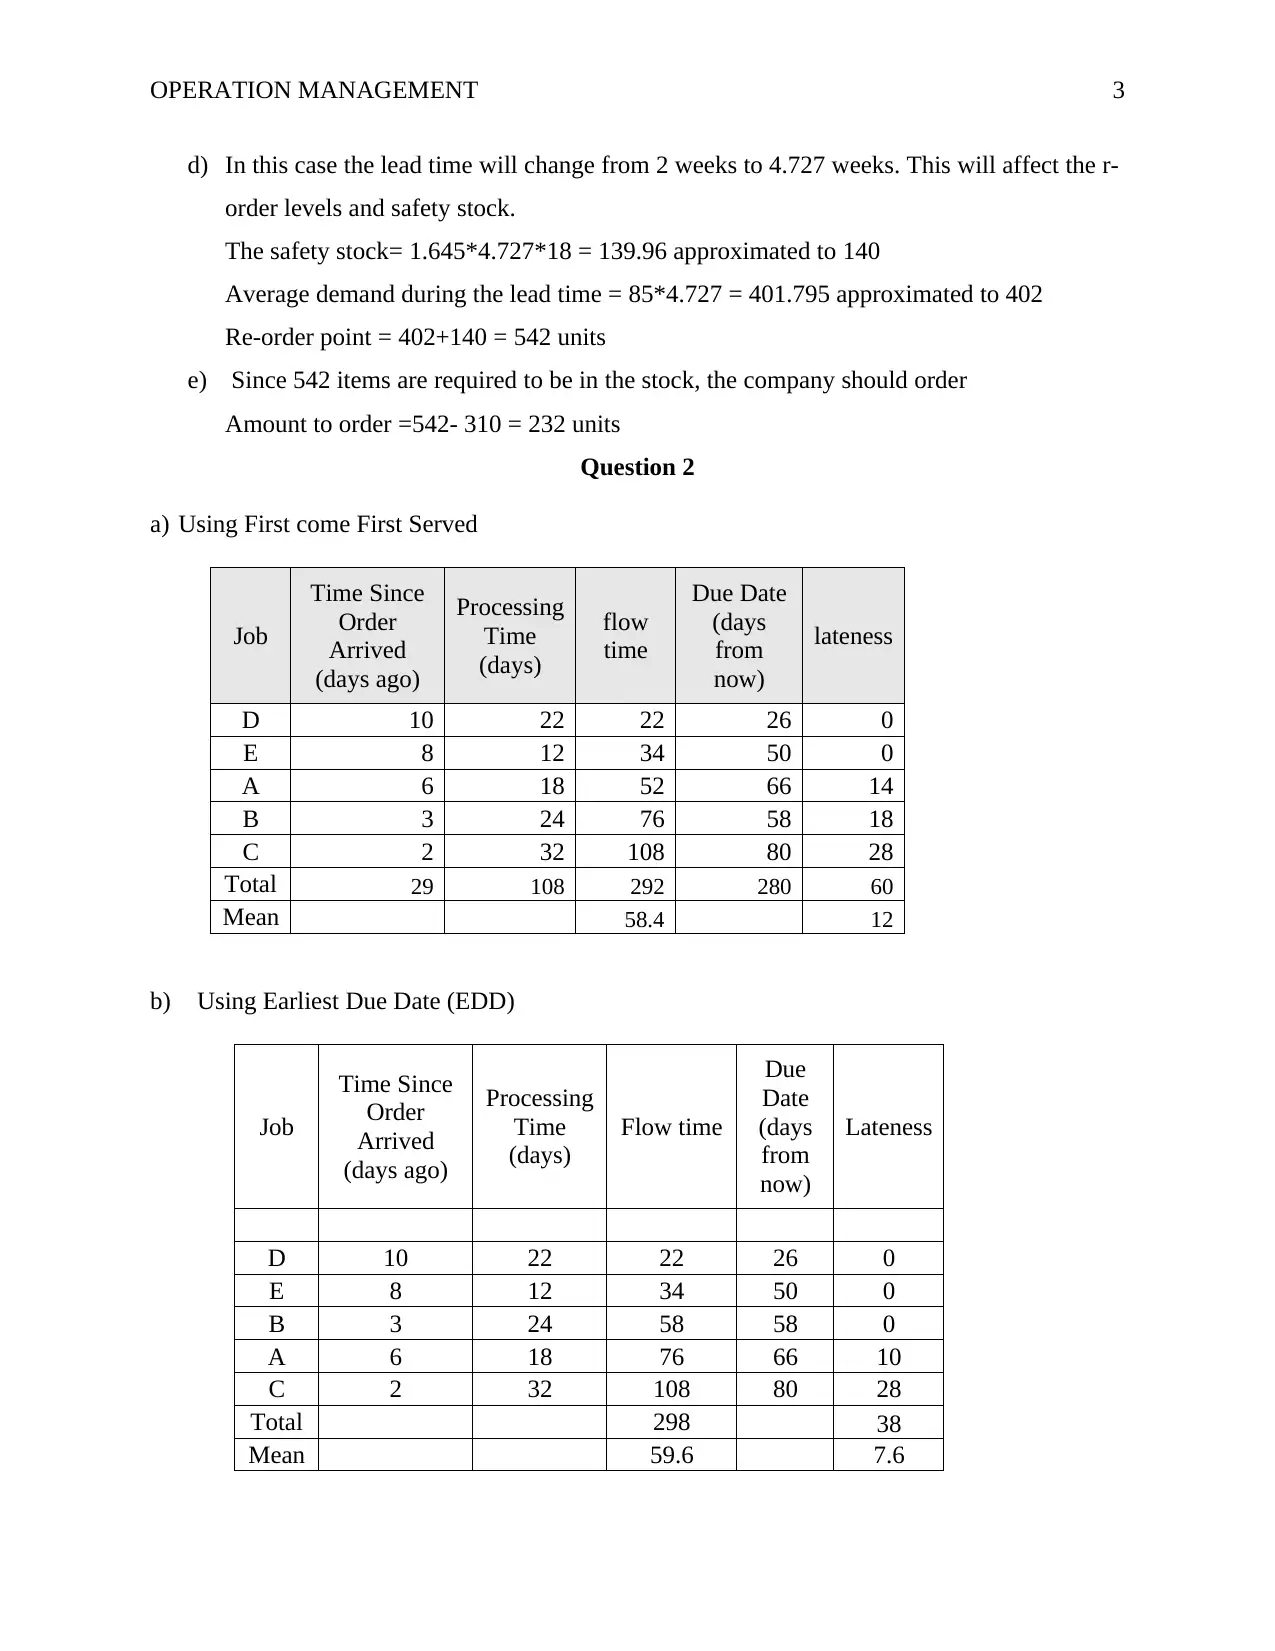
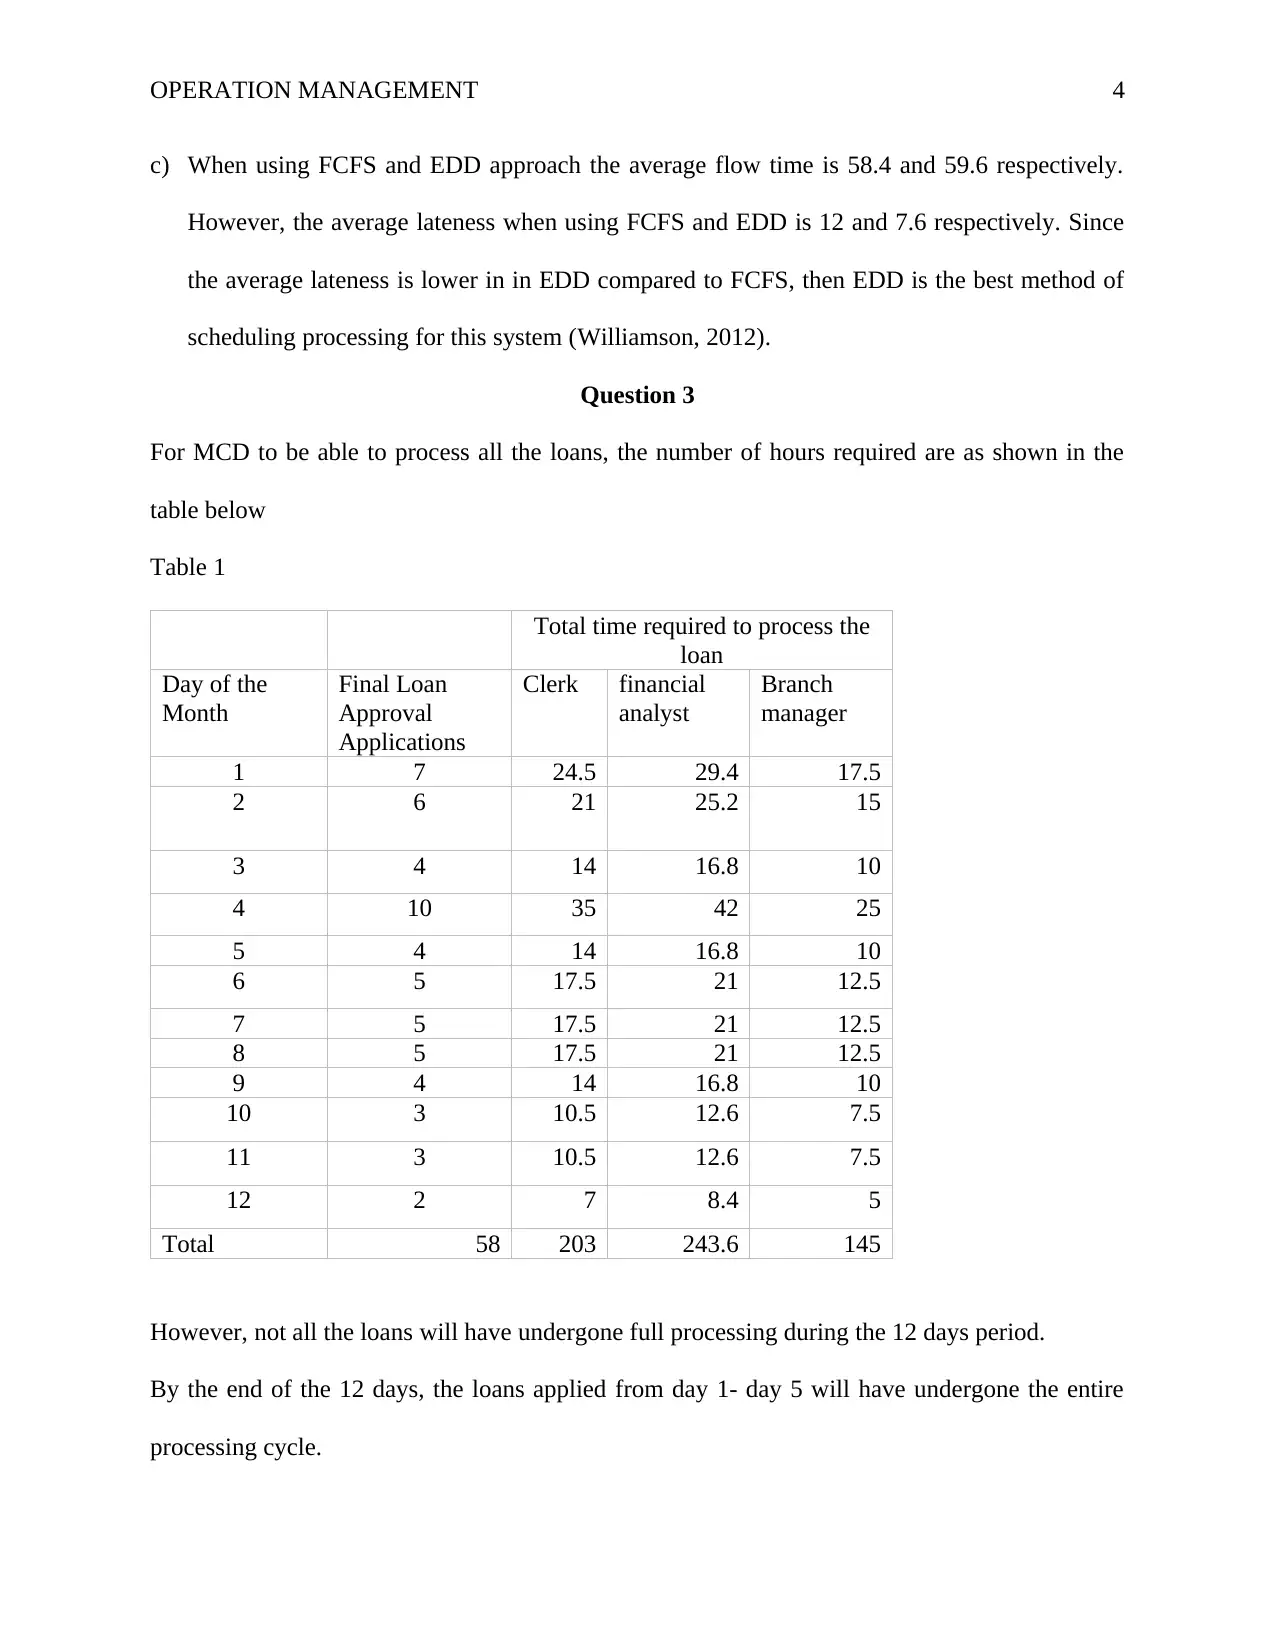
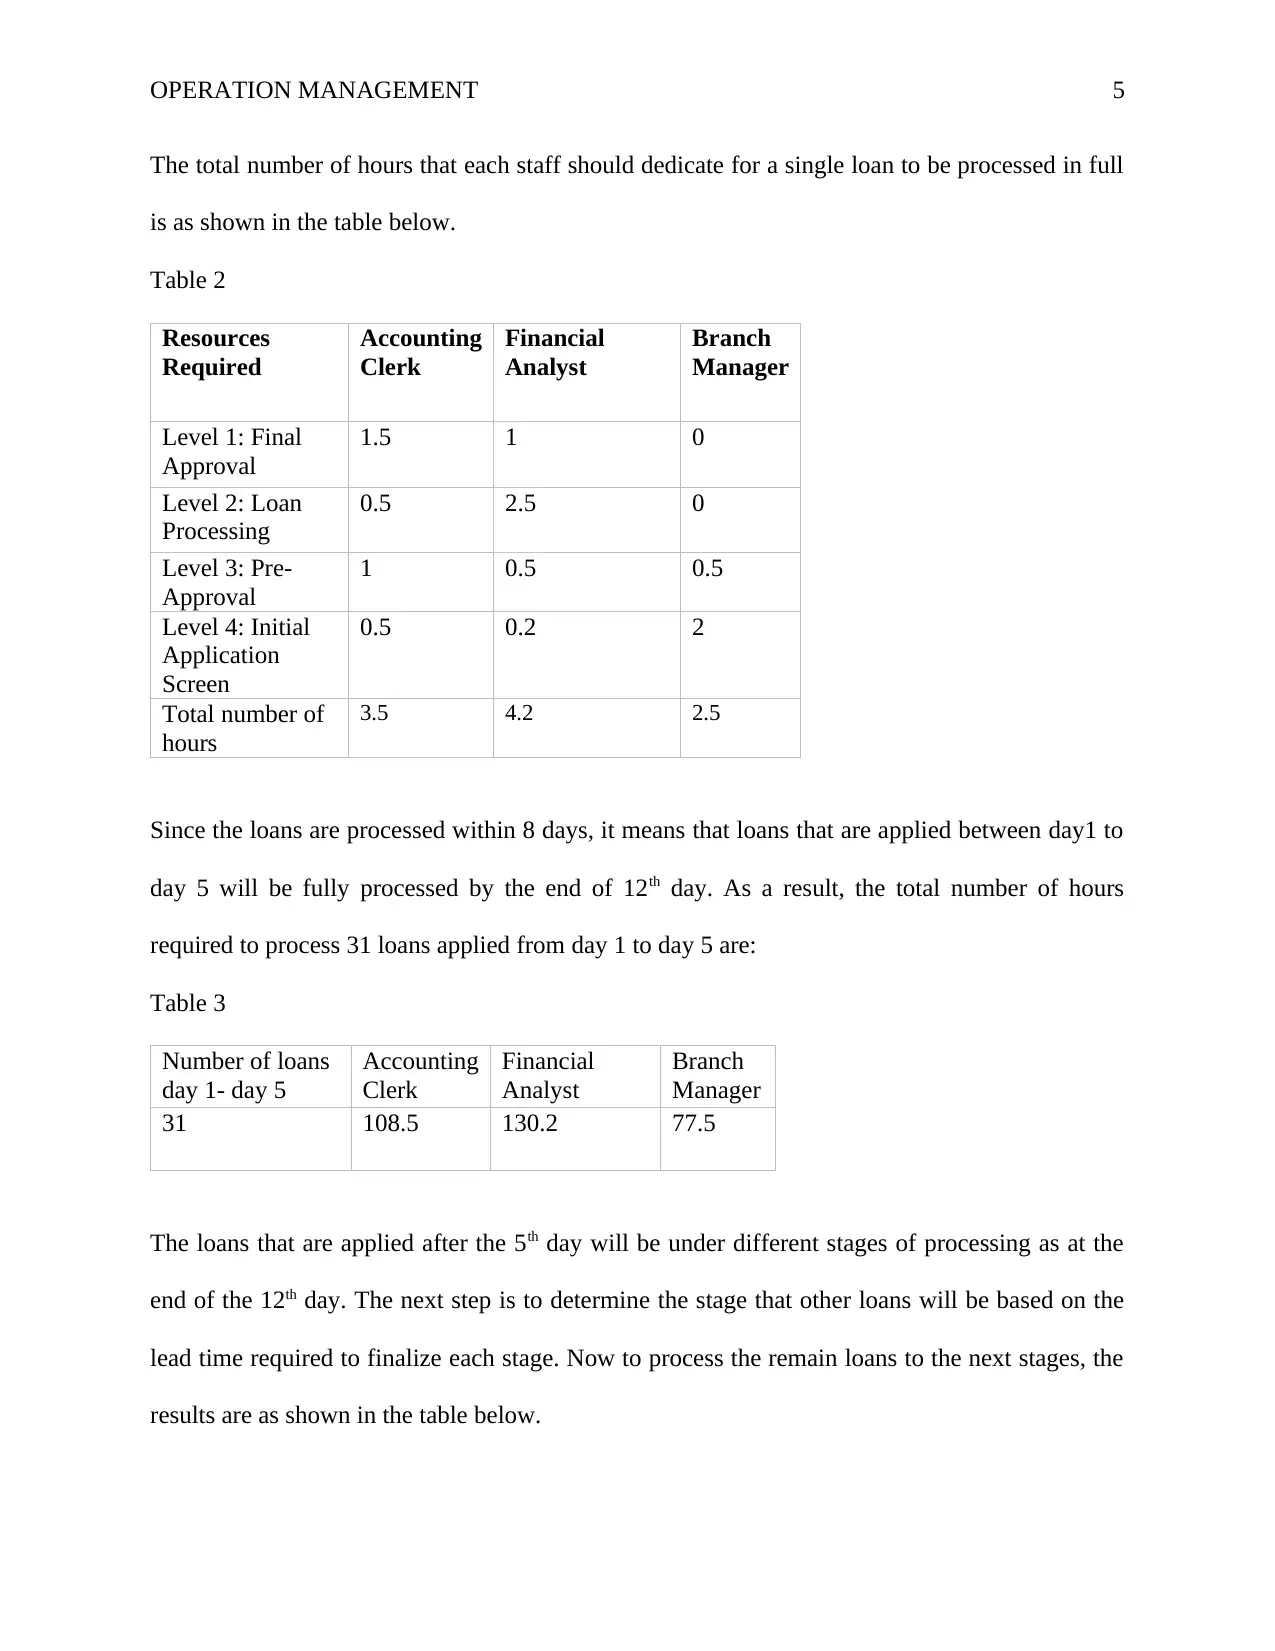
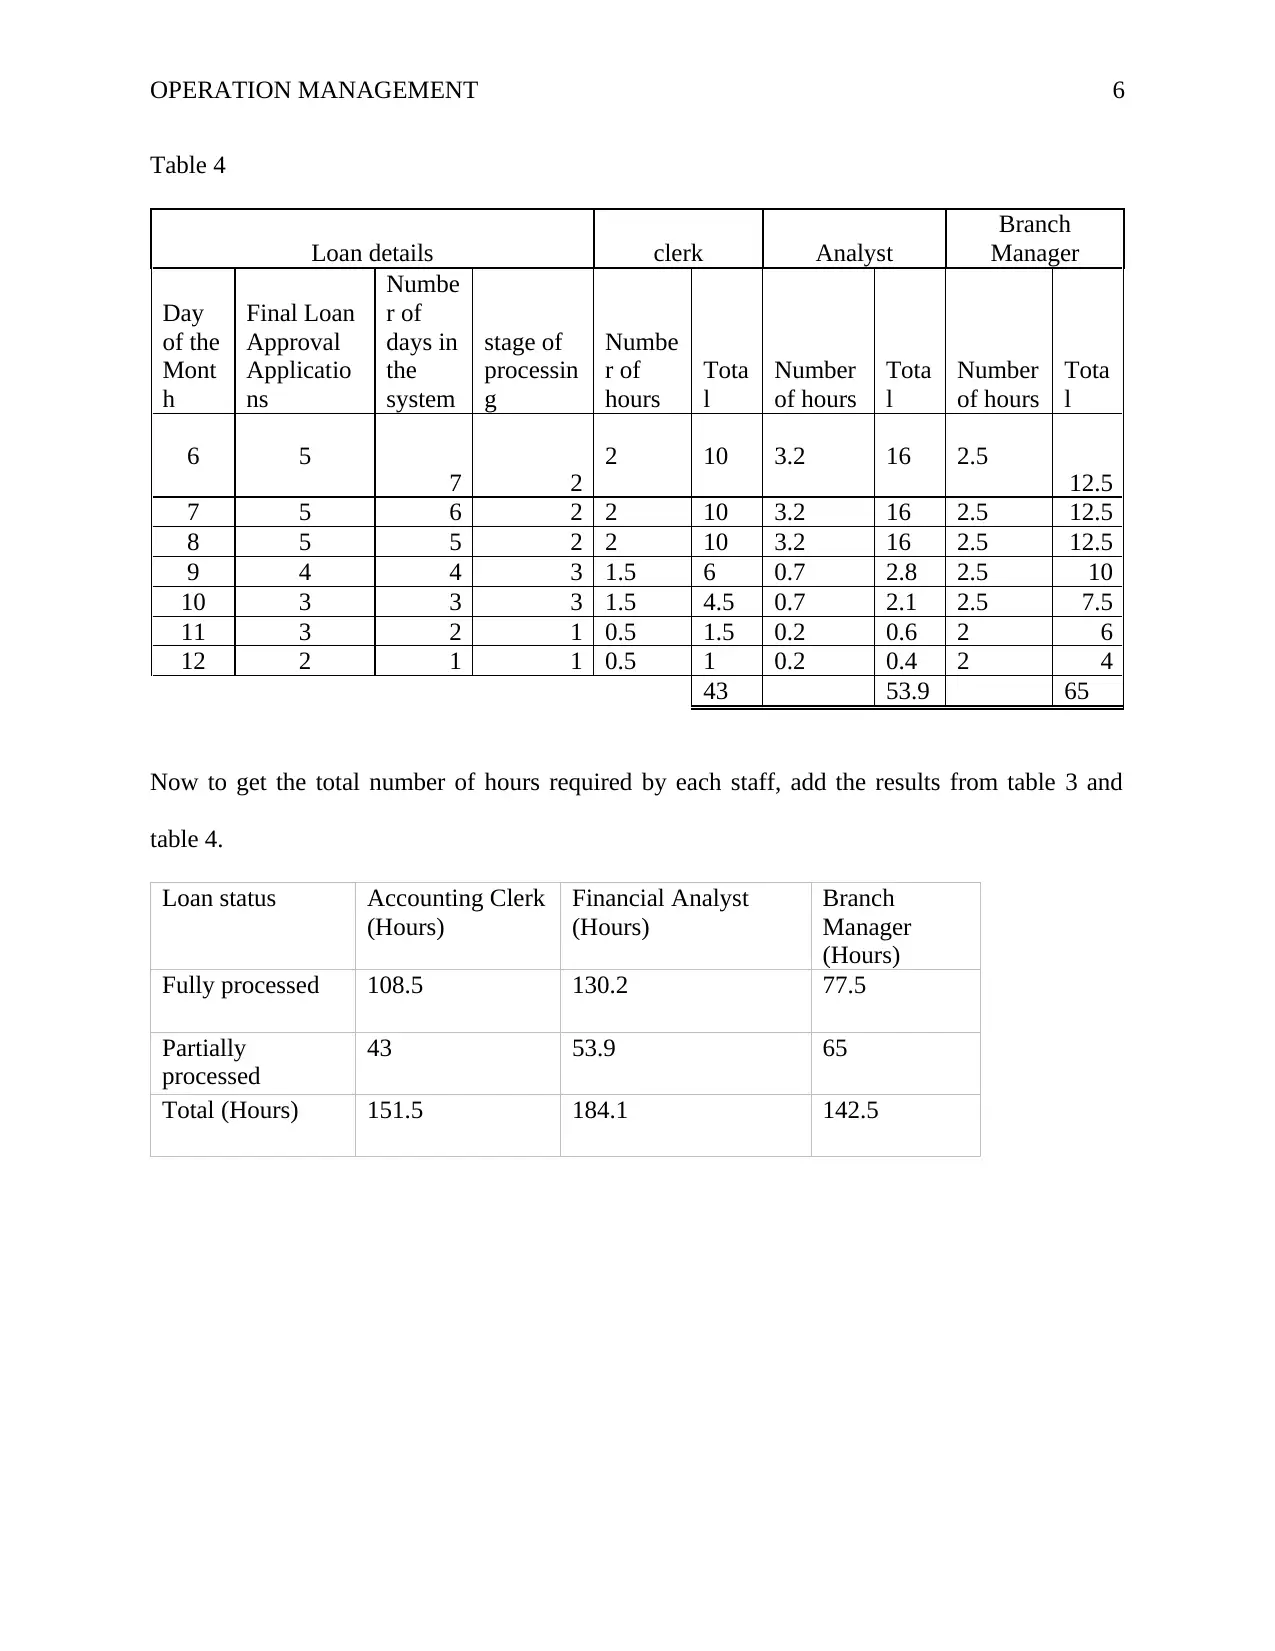
This document presents a comprehensive solution to an Operation Management assignment, addressing key concepts in inventory management and scheduling. The solution begins with an analysis of Economic Order Quantity (EOQ), reorder points, and safety stock calculations, considering factors like demand, order costs, holding costs, lead time, and desired service levels. The assignment then delves into scheduling methods, comparing First Come First Served (FCFS) and Earliest Due Date (EDD) approaches, and evaluating their impact on flow time and lateness. Finally, the solution explores a case study involving loan processing, calculating the required staff hours for different stages of the process to meet deadlines, and determining resource allocation. The solution provides detailed calculations, explanations, and tables to support the findings. The assignment covers topics like EOQ, reorder points, inventory management, FCFS, EDD, and scheduling.
tabler-icon-diamond-filled.svg

Contribute Materials

Your contribution can guide someone’s learning journey. Share your documents today.
Document Page
Running head: OPERATION MANAGEMENT
1
Operation Management
Students Name
Institution Affiliation
tabler-icon-diamond-filled.svg

Secure Best Marks with AI Grader

Need help grading? Try our AI Grader for instant feedback on your assignments.
Document Page
OPERATION MANAGEMENT 2
Operation Management
Question1
Analysis of variables
 Demand per year = 85 bags *52 =4420
 Order cost = $57/order
 Annual holding cost = 26% *$10.75 =2.795
 Desired cycle-service level = 90%
 Lead-time = 2 weeks
 Standard deviation of weekly demand = 18 bags
a) The economic order quantity (EOQ) is the quantity that can be ordered such that the
ordering cost and the inventory holding cost are kept at minimum (Senthilnathan, 2019).
It is calculate using the formula below
EOQ = √ 2∗Demand∗Ordering cost
Holding cost = √ 2∗4420∗57
2.795 = 424. 59 ; approx. 425
b) The average time between orders in weeks
If each order will contain 425 units, then in order to determine the average time in orders,
divide the demand with the number of units to determine how many times orders the
orders will be placed in the year.
Total number of orders = 4420
425 =10.4 orders, since orders cannot be a fraction, the
company has to place 11 orders in the year. These orders are distributed for a period of 52
weeks.
Average time of orders = 52
11 = 4.727weeks
c) The re-order point ( R )
The desired service level is 90% and the Z value is 1.645
Safety stock = Z value * ( the standard deviation of demand during the lead time) *
desired lead time
= 1.645*2*18 = 59.22 approximately 60 units
Re-order point = Average demand during the lead time + safety stock
Re-order point = 85*2 +60 = 230 units
Document Page
OPERATION MANAGEMENT 3
d) In this case the lead time will change from 2 weeks to 4.727 weeks. This will affect the r-
order levels and safety stock.
The safety stock= 1.645*4.727*18 = 139.96 approximated to 140
Average demand during the lead time = 85*4.727 = 401.795 approximated to 402
Re-order point = 402+140 = 542 units
e) Since 542 items are required to be in the stock, the company should order
Amount to order =542- 310 = 232 units
Question 2
a) Using First come First Served
Job
Time Since
Order
Arrived
(days ago)
Processing
Time
(days)
flow
time
Due Date
(days
from
now)
lateness
D 10 22 22 26 0
E 8 12 34 50 0
A 6 18 52 66 14
B 3 24 76 58 18
C 2 32 108 80 28
Total 29 108 292 280 60
Mean 58.4 12
b) Using Earliest Due Date (EDD)
Job
Time Since
Order
Arrived
(days ago)
Processing
Time
(days)
Flow time
Due
Date
(days
from
now)
Lateness
D 10 22 22 26 0
E 8 12 34 50 0
B 3 24 58 58 0
A 6 18 76 66 10
C 2 32 108 80 28
Total 298 38
Mean 59.6 7.6
Document Page
OPERATION MANAGEMENT 4
c) When using FCFS and EDD approach the average flow time is 58.4 and 59.6 respectively.
However, the average lateness when using FCFS and EDD is 12 and 7.6 respectively. Since
the average lateness is lower in in EDD compared to FCFS, then EDD is the best method of
scheduling processing for this system (Williamson, 2012).
Question 3
For MCD to be able to process all the loans, the number of hours required are as shown in the
table below
Table 1
Total time required to process the
loan
Day of the
Month
Final Loan
Approval
Applications
Clerk financial
analyst
Branch
manager
1 7 24.5 29.4 17.5
2 6 21 25.2 15
3 4 14 16.8 10
4 10 35 42 25
5 4 14 16.8 10
6 5 17.5 21 12.5
7 5 17.5 21 12.5
8 5 17.5 21 12.5
9 4 14 16.8 10
10 3 10.5 12.6 7.5
11 3 10.5 12.6 7.5
12 2 7 8.4 5
Total 58 203 243.6 145
However, not all the loans will have undergone full processing during the 12 days period.
By the end of the 12 days, the loans applied from day 1- day 5 will have undergone the entire
processing cycle.
tabler-icon-diamond-filled.svg

Secure Best Marks with AI Grader

Need help grading? Try our AI Grader for instant feedback on your assignments.
Document Page
OPERATION MANAGEMENT 5
The total number of hours that each staff should dedicate for a single loan to be processed in full
is as shown in the table below.
Table 2
Resources
Required
Accounting
Clerk
Financial
Analyst
Branch
Manager
Level 1: Final
Approval
1.5 1 0
Level 2: Loan
Processing
0.5 2.5 0
Level 3: Pre-
Approval
1 0.5 0.5
Level 4: Initial
Application
Screen
0.5 0.2 2
Total number of
hours
3.5 4.2 2.5
Since the loans are processed within 8 days, it means that loans that are applied between day1 to
day 5 will be fully processed by the end of 12th day. As a result, the total number of hours
required to process 31 loans applied from day 1 to day 5 are:
Table 3
Number of loans
day 1- day 5
Accounting
Clerk
Financial
Analyst
Branch
Manager
31 108.5 130.2 77.5
The loans that are applied after the 5th day will be under different stages of processing as at the
end of the 12th day. The next step is to determine the stage that other loans will be based on the
lead time required to finalize each stage. Now to process the remain loans to the next stages, the
results are as shown in the table below.
Document Page
OPERATION MANAGEMENT 6
Table 4
Loan details clerk Analyst
Branch
Manager
Day
of the
Mont
h
Final Loan
Approval
Applicatio
ns
Numbe
r of
days in
the
system
stage of
processin
g
Numbe
r of
hours
Tota
l
Number
of hours
Tota
l
Number
of hours
Tota
l
6 5
7 2
2 10 3.2 16 2.5
12.5
7 5 6 2 2 10 3.2 16 2.5 12.5
8 5 5 2 2 10 3.2 16 2.5 12.5
9 4 4 3 1.5 6 0.7 2.8 2.5 10
10 3 3 3 1.5 4.5 0.7 2.1 2.5 7.5
11 3 2 1 0.5 1.5 0.2 0.6 2 6
12 2 1 1 0.5 1 0.2 0.4 2 4
43 53.9 65
Now to get the total number of hours required by each staff, add the results from table 3 and
table 4.
Loan status Accounting Clerk
(Hours)
Financial Analyst
(Hours)
Branch
Manager
(Hours)
Fully processed 108.5 130.2 77.5
Partially
processed
43 53.9 65
Total (Hours) 151.5 184.1 142.5
Document Page
OPERATION MANAGEMENT 7
References
Senthilnathan, S. (2019). Economic Order Quantity (EOQ). SSRN Electronic Journal. doi:
10.2139/ssrn.3475239
Williamson, S. (2012). Public Library Computer Waiting Queues: Alternatives to the First-
Come-First-Served Strategy. Information Technology And Libraries, 31(2), 72. doi:
10.6017/ital.v31i2.2164
chevron_up_icon
1 out of 7
circle_padding
hide_on_mobile
zoom_out_icon
logo.png

Your All-in-One AI-Powered Toolkit for Academic Success.

Available 24*7 on WhatsApp / Email

[object Object]