Operations Engineering Analysis of Samsung Electronics Company
VerifiedAdded on 2023/06/04
|32
|6945
|311
Report
AI Summary
This comprehensive operations engineering report provides a detailed analysis of Samsung Electronics. It begins with an executive summary and an introduction to Samsung's operations, followed by a case study exploring the design of a new product using De Bono's Six Hat Thinking Model. The report delves into the design of operations, including waste forms, floor plans, and JIT production. It then examines supply chain elements, planning, purchasing, and distribution, along with inventory reorder points, safety stock, and EOQ calculations. Furthermore, the report covers OEE calculations, improvement strategies, performance metrics, and root cause analysis, culminating in a discussion of the theory of constraints. The analysis includes calculations and interpretations of various operational metrics, providing a holistic view of Samsung's operational strategies and challenges.
Operations Engineering 1
OPERATIONS ENGINEERING
By (Student Name)
(Name of the Class) - Course
Tutor: Insert Name of tutor here
University
Department of
02/10/2018
OPERATIONS ENGINEERING
By (Student Name)
(Name of the Class) - Course
Tutor: Insert Name of tutor here
University
Department of
02/10/2018
Paraphrase This Document
Need a fresh take? Get an instant paraphrase of this document with our AI Paraphraser
Operations Engineering 2
Executive summary
This report examines the case study of Samsung Electronics Company with a view to exploring
the operations of the company. It investigates the customers, suppliers, and distributors of the
company with a view to understanding the global business dynamics. The report inquires De
Bono’s Six hat model and designs a product using the same. It delves into the VSM model and
critically examines the role of JIT maintaining healthy supply chain networks.
In addition, the report explores the need to compute inventory reorder levels by calculating and
interpreting the role of inventory to reorder point, safety stock, and economic order quantity.
Other computations covered in the report include OEE with recommendations drawn on how to
improve OEE. The report examines the yield defective, yield defect and RTY. Finally, a
fictitious constraint has been examined and the role of root cause analysis interrogated.
Operations Engineering 3
TABLE OF CONTENT
Executive summary.........................................................................................................................2
1.0 Introduction................................................................................................................................4
2.0 Designing a new product using De Bono’s Six Hat Thinking Model...................................5
2.1 Developing a new product.....................................................................................................5
2.2 Design Review checklist........................................................................................................7
2.3 Design Review outcome........................................................................................................8
3.0 Design the Operations............................................................................................................9
3.2 Different Waste Forms........................................................................................................10
3.3 Production (layout) Floor Plan............................................................................................11
3.4 JIT production flow based on a Kanban Pull system..........................................................12
4.0 Manage the operations.........................................................................................................13
4.1 Elements of a supply chain..................................................................................................13
4.1.1 Supply chain integration...............................................................................................13
4.1.2 Planning of operations..................................................................................................13
4.1.3 Purchasing.....................................................................................................................13
4.1.4 Distribution management..............................................................................................14
4.1.5 Quality management.....................................................................................................14
4.2 Reorder point safety stock and EOQ...................................................................................14
4.2.1 Inventory Reorder Point...............................................................................................15
4.2.2 Safety stock...................................................................................................................15
4.2.3 Economic order quantity...............................................................................................15
4.2.4 Interpretation of the inventory calculations..................................................................16
4.2.5 Determining reliability given a fictitious MTBF..........................................................16
⊘ This is a preview!⊘
Do you want full access?
Subscribe today to unlock all pages.
Trusted by 1+ million students worldwide
Operations Engineering 4
5.0 Improve the operations........................................................................................................17
5.1 Calculation of the OEE........................................................................................................17
5.2 How to improve the OEE....................................................................................................18
5.3 Performance metric Yield....................................................................................................18
5.4 Interpretation of the obtained results...................................................................................19
5.5 Root cause analysis..............................................................................................................19
5.6 Theory of constraints - Overcoming Constraints.................................................................20
Conclusion.....................................................................................................................................21
References......................................................................................................................................22
Paraphrase This Document
Need a fresh take? Get an instant paraphrase of this document with our AI Paraphraser
Operations Engineering 5
1.0 Introduction
Background to Samsung Operations
Samsung is a multinational company dealing with a variety of products and services.
Established in 1938 with its headquarters in South Korea, it has become one of the most
innovative companies globally (Dudovskiy 2017). It is by far the largest company in South
Korea contributing to almost a quarter of the country's total exports. The company has grown
tremendously from cottage industry to a global leader employing over 300,000 workers across
the world (Jurevicius 2018).
According to Christopher (2016) Samsung is involved in multiple businesses in the
manufacturing and construction, and service sector. These are grouped under four strategic
global business units to take full advantage of different business opportunities. The Hansol
business unit, the CJ unit, and the Shinsegae unit collectively deal with chemical manufacturing,
supply chain, and logistics, manufacturing of paper, advertisement and insurance among other
business interests (Nisen 2013).
For the purposes of this report, the focus will be on the Samsung Electronics group which
is the most successful of the business units. It deals with the manufacture of mobile phones,
tablets, personal computers, televisions, display screens, fridges, headphones, microwaves,
freezers among other home appliances (Reuters 2016).
Samsung customers are spread out across the world. The company has different packages
for their different customers. To begin with, it supplies other original equipment manufacturers
(OEMs) with display screens (Weng, Wei & Fujimura 2012) Secondly, they supply the aviation
sector firms with circuits and display equipment. Governments are also part of their customers
ordering telecommunication equipment. Other customers include firms in the hospitality industry
and individual customers. Samsung has segmented their customers according to their location
and social-economic aspects (Wilson 2015). On the smartphones market, for instance, the
segments include high-end customers the midrange customers and the feature phone customers.
Operations Engineering 6
Due to the array of products that Samsung sells, the company has different sale
approaches. It has stores in all major markets in North America, Europe, Asia-Pacific, Africa,
and South America. In parts where stores are unavailable, it has agents, franchises and
subsidiaries to sell their electronics (Sai 2018). Lastly, the company has embraced online
marketing where customers can order their devices. Damaged or defective devices are replaced if
covered by warrants (Peng 2017).
Samsung is now the biggest Smartphone maker in the world after overtaking Nokia
Corporation in 2012 (Azmeh 2014). Its sales as of 2017 averaged 175 billion USD. Its net profit
was in the same year was in the neighborhood of 20 billion and asset base of a quarter billion US
dollars. Its electronics are manufactured mainly in South Korea and shipped to the rest of the
world.
2.0 Designing a new product using De Bono’s Six Hat Thinking Model
2.1 Developing a new product
In this illustration, the assumption is that Samsung needs to develop a gaming console
since they do not have this offering in their product line-up. Since the gaming console is mostly
used by young people (Morris 2009; Debano 2017). Samsung believes that it can pull up sales by
introducing the product into the market.
Table 1: The six hat model
Hat Detail
⊘ This is a preview!⊘
Do you want full access?
Subscribe today to unlock all pages.
Trusted by 1+ million students worldwide
Operations Engineering 7
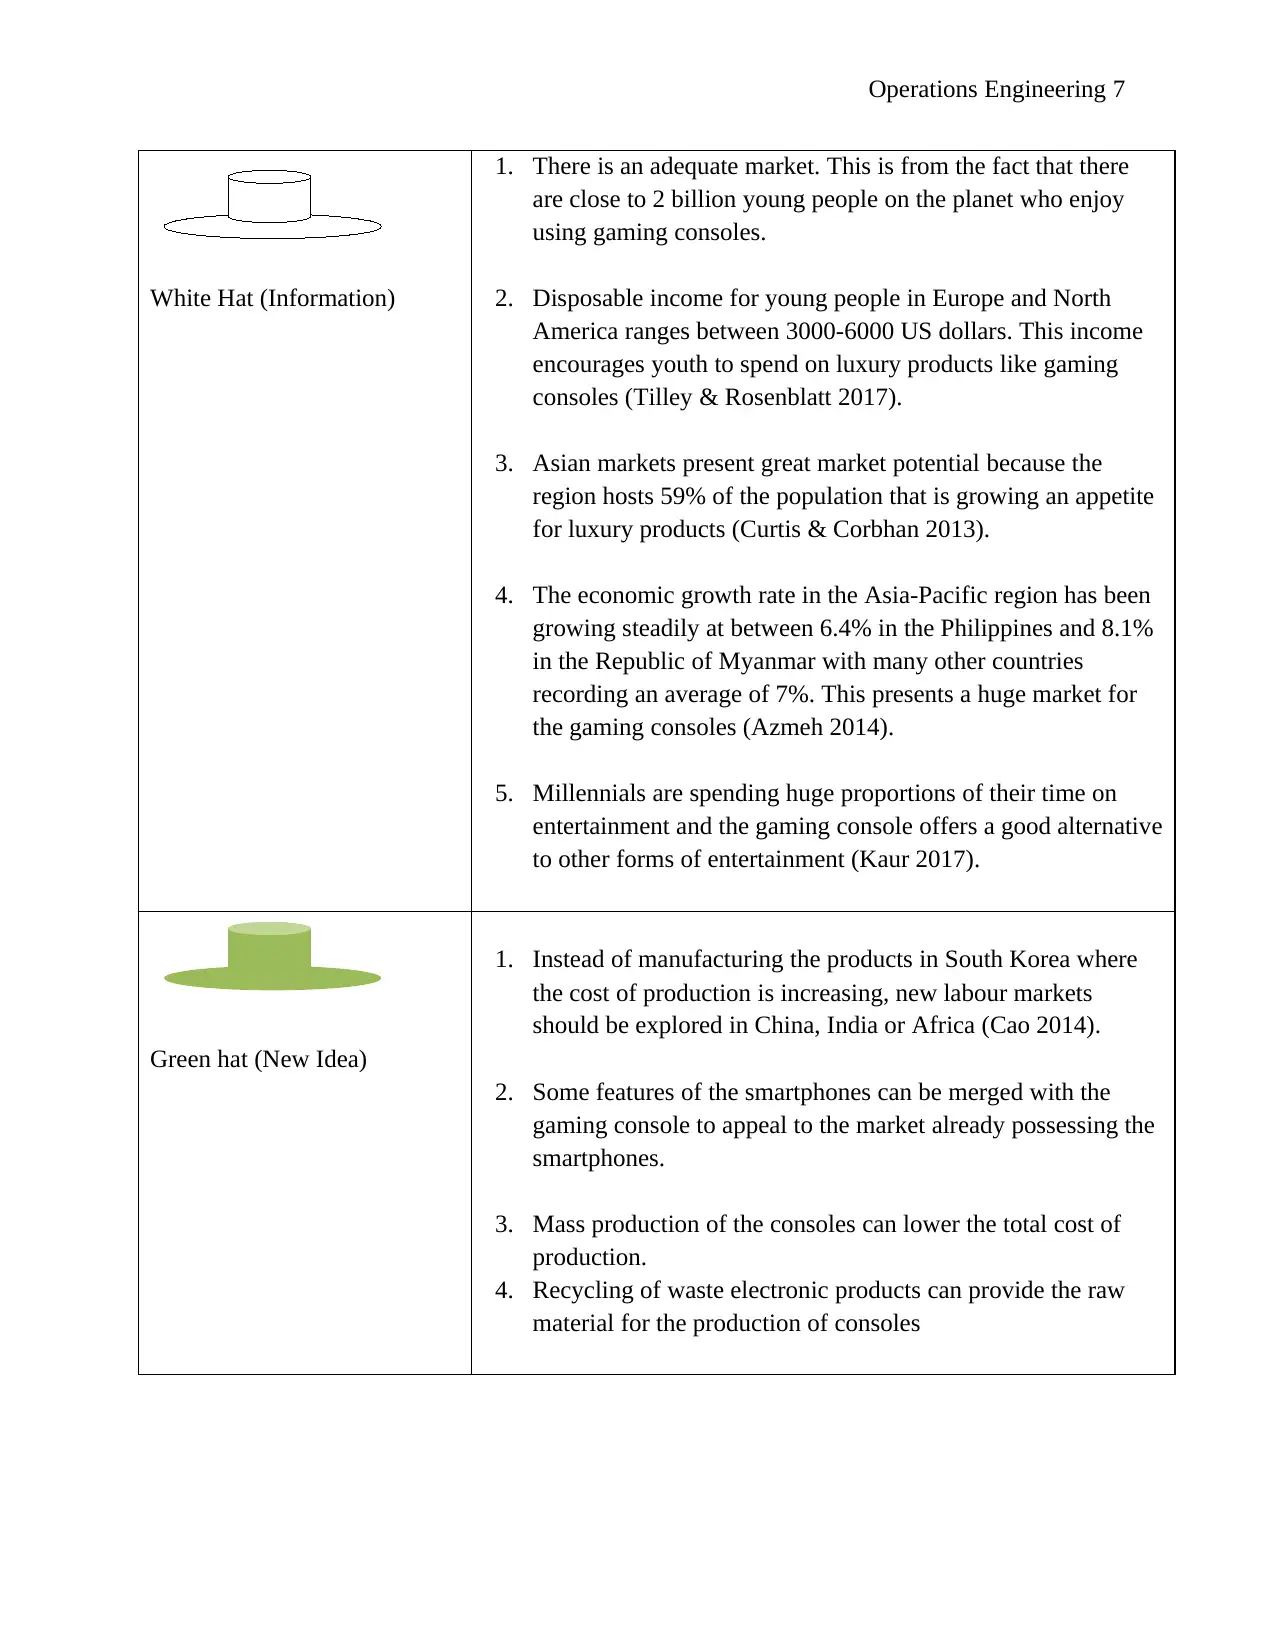
White Hat (Information)
1. There is an adequate market. This is from the fact that there
are close to 2 billion young people on the planet who enjoy
using gaming consoles.
2. Disposable income for young people in Europe and North
America ranges between 3000-6000 US dollars. This income
encourages youth to spend on luxury products like gaming
consoles (Tilley & Rosenblatt 2017).
3. Asian markets present great market potential because the
region hosts 59% of the population that is growing an appetite
for luxury products (Curtis & Corbhan 2013).
4. The economic growth rate in the Asia-Pacific region has been
growing steadily at between 6.4% in the Philippines and 8.1%
in the Republic of Myanmar with many other countries
recording an average of 7%. This presents a huge market for
the gaming consoles (Azmeh 2014).
5. Millennials are spending huge proportions of their time on
entertainment and the gaming console offers a good alternative
to other forms of entertainment (Kaur 2017).
Green hat (New Idea)
1. Instead of manufacturing the products in South Korea where
the cost of production is increasing, new labour markets
should be explored in China, India or Africa (Cao 2014).
2. Some features of the smartphones can be merged with the
gaming console to appeal to the market already possessing the
smartphones.
3. Mass production of the consoles can lower the total cost of
production.
4. Recycling of waste electronic products can provide the raw
material for the production of consoles
Paraphrase This Document
Need a fresh take? Get an instant paraphrase of this document with our AI Paraphraser
Operations Engineering 8
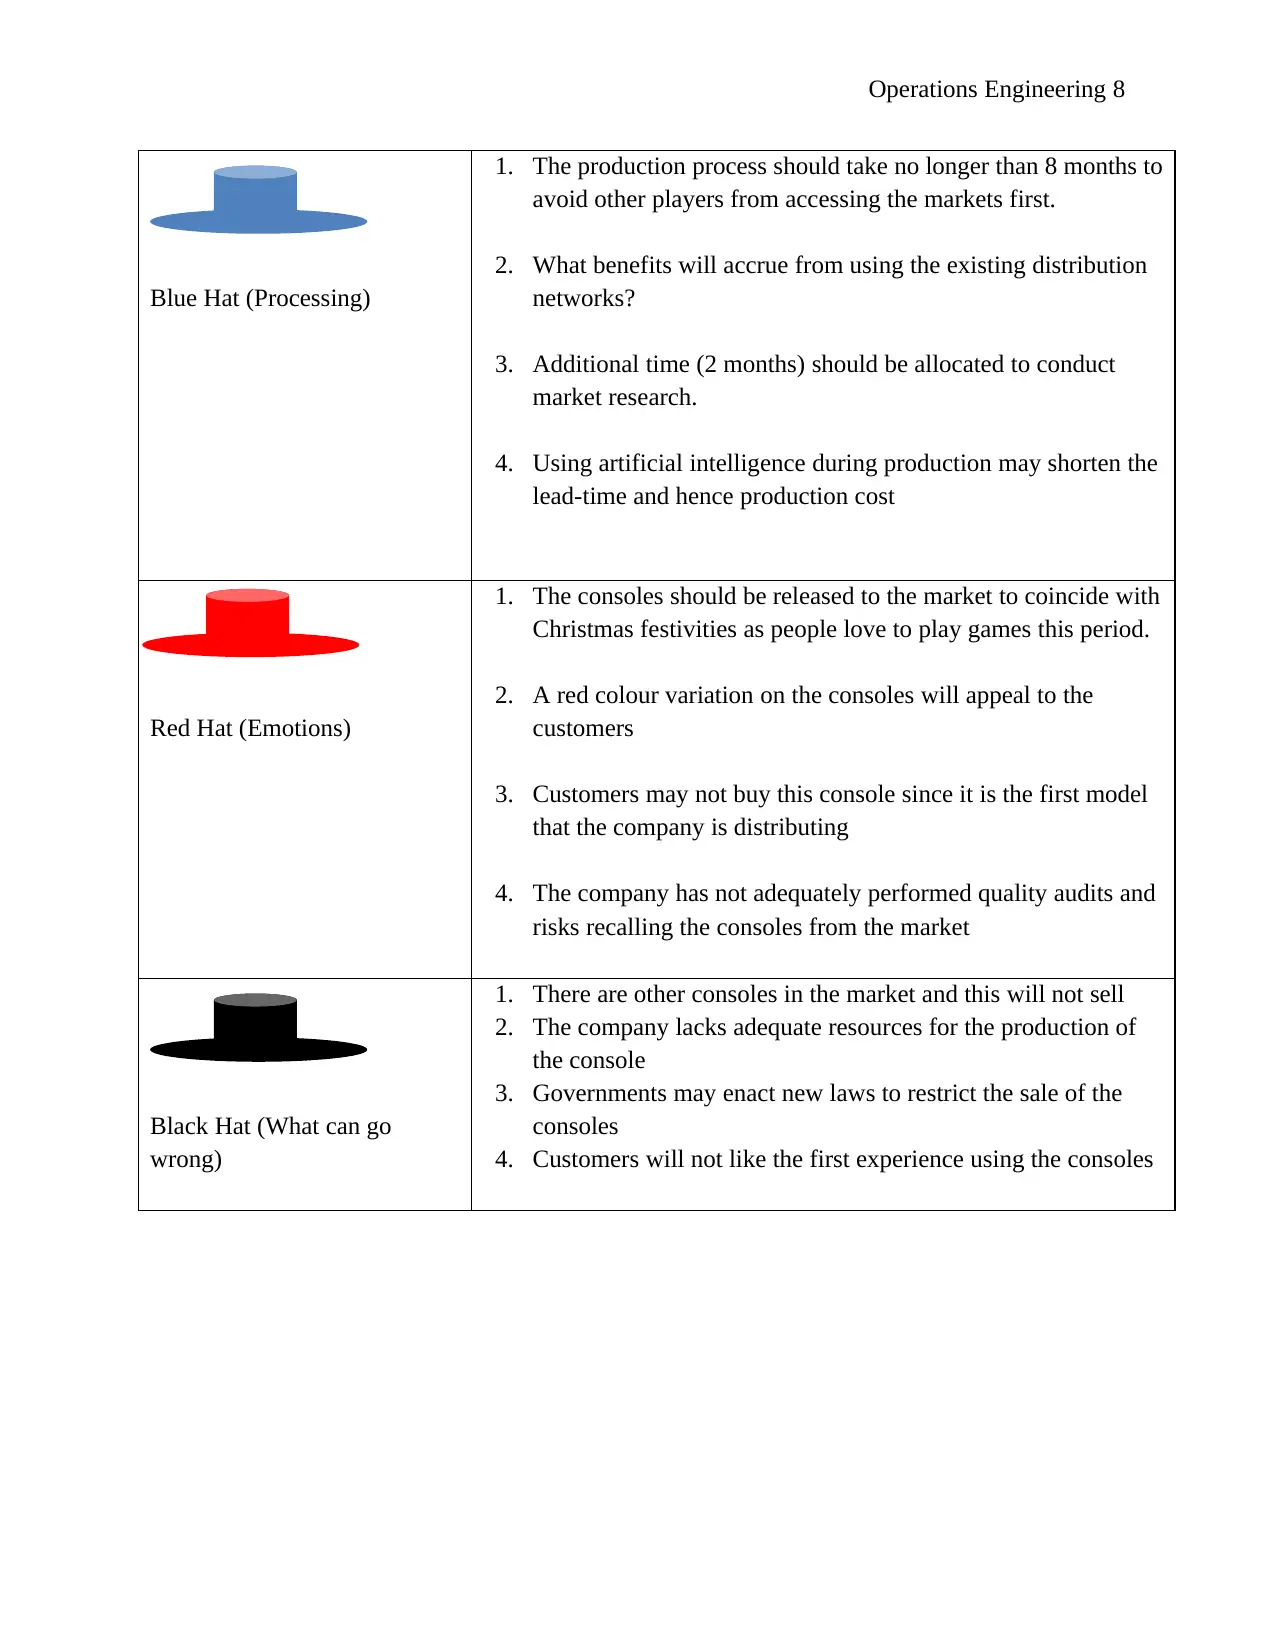
Blue Hat (Processing)
1. The production process should take no longer than 8 months to
avoid other players from accessing the markets first.
2. What benefits will accrue from using the existing distribution
networks?
3. Additional time (2 months) should be allocated to conduct
market research.
4. Using artificial intelligence during production may shorten the
lead-time and hence production cost
Red Hat (Emotions)
1. The consoles should be released to the market to coincide with
Christmas festivities as people love to play games this period.
2. A red colour variation on the consoles will appeal to the
customers
3. Customers may not buy this console since it is the first model
that the company is distributing
4. The company has not adequately performed quality audits and
risks recalling the consoles from the market
Black Hat (What can go
wrong)
1. There are other consoles in the market and this will not sell
2. The company lacks adequate resources for the production of
the console
3. Governments may enact new laws to restrict the sale of the
consoles
4. Customers will not like the first experience using the consoles
Operations Engineering 9
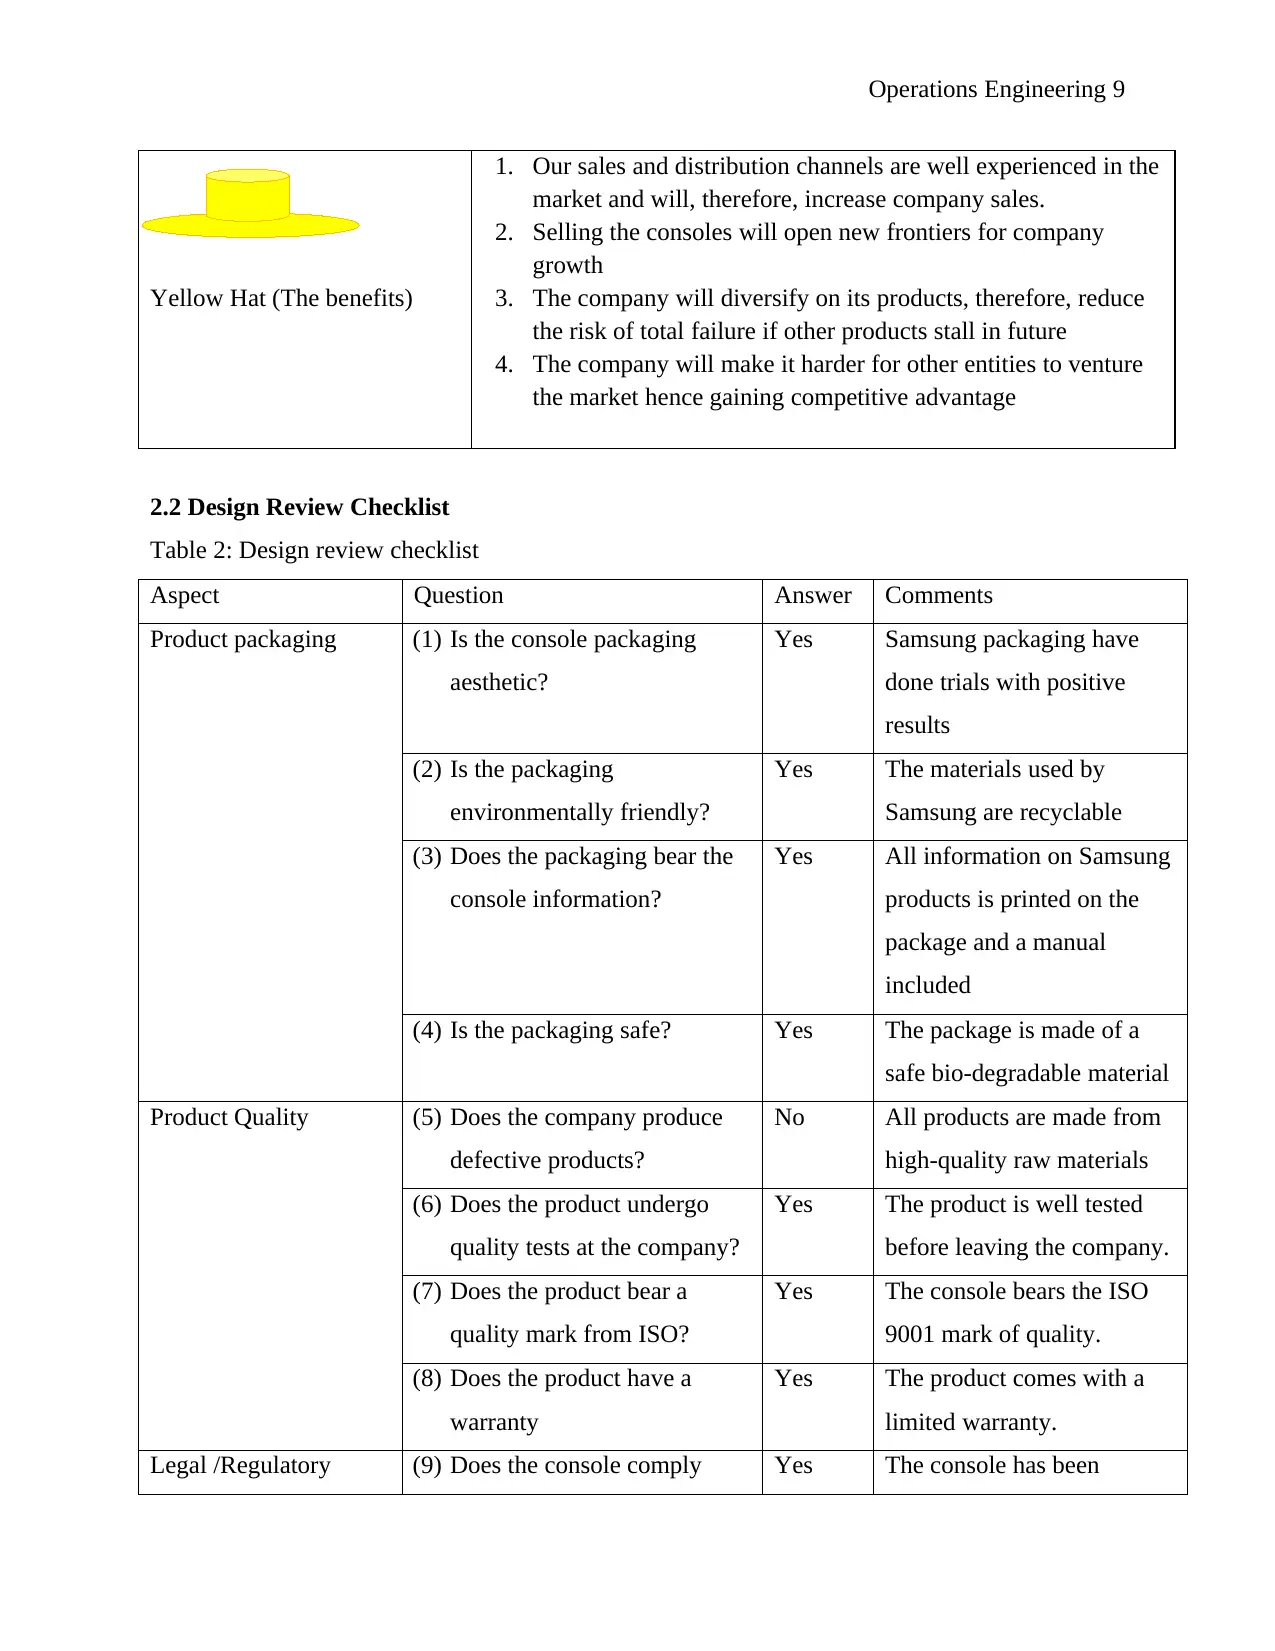
Yellow Hat (The benefits)
1. Our sales and distribution channels are well experienced in the
market and will, therefore, increase company sales.
2. Selling the consoles will open new frontiers for company
growth
3. The company will diversify on its products, therefore, reduce
the risk of total failure if other products stall in future
4. The company will make it harder for other entities to venture
the market hence gaining competitive advantage
2.2 Design Review Checklist
Table 2: Design review checklist
Aspect Question Answer Comments
Product packaging (1) Is the console packaging
aesthetic?
Yes Samsung packaging have
done trials with positive
results
(2) Is the packaging
environmentally friendly?
Yes The materials used by
Samsung are recyclable
(3) Does the packaging bear the
console information?
Yes All information on Samsung
products is printed on the
package and a manual
included
(4) Is the packaging safe? Yes The package is made of a
safe bio-degradable material
Product Quality (5) Does the company produce
defective products?
No All products are made from
high-quality raw materials
(6) Does the product undergo
quality tests at the company?
Yes The product is well tested
before leaving the company.
(7) Does the product bear a
quality mark from ISO?
Yes The console bears the ISO
9001 mark of quality.
(8) Does the product have a
warranty
Yes The product comes with a
limited warranty.
Legal /Regulatory (9) Does the console comply Yes The console has been
⊘ This is a preview!⊘
Do you want full access?
Subscribe today to unlock all pages.
Trusted by 1+ million students worldwide
Operations Engineering 10
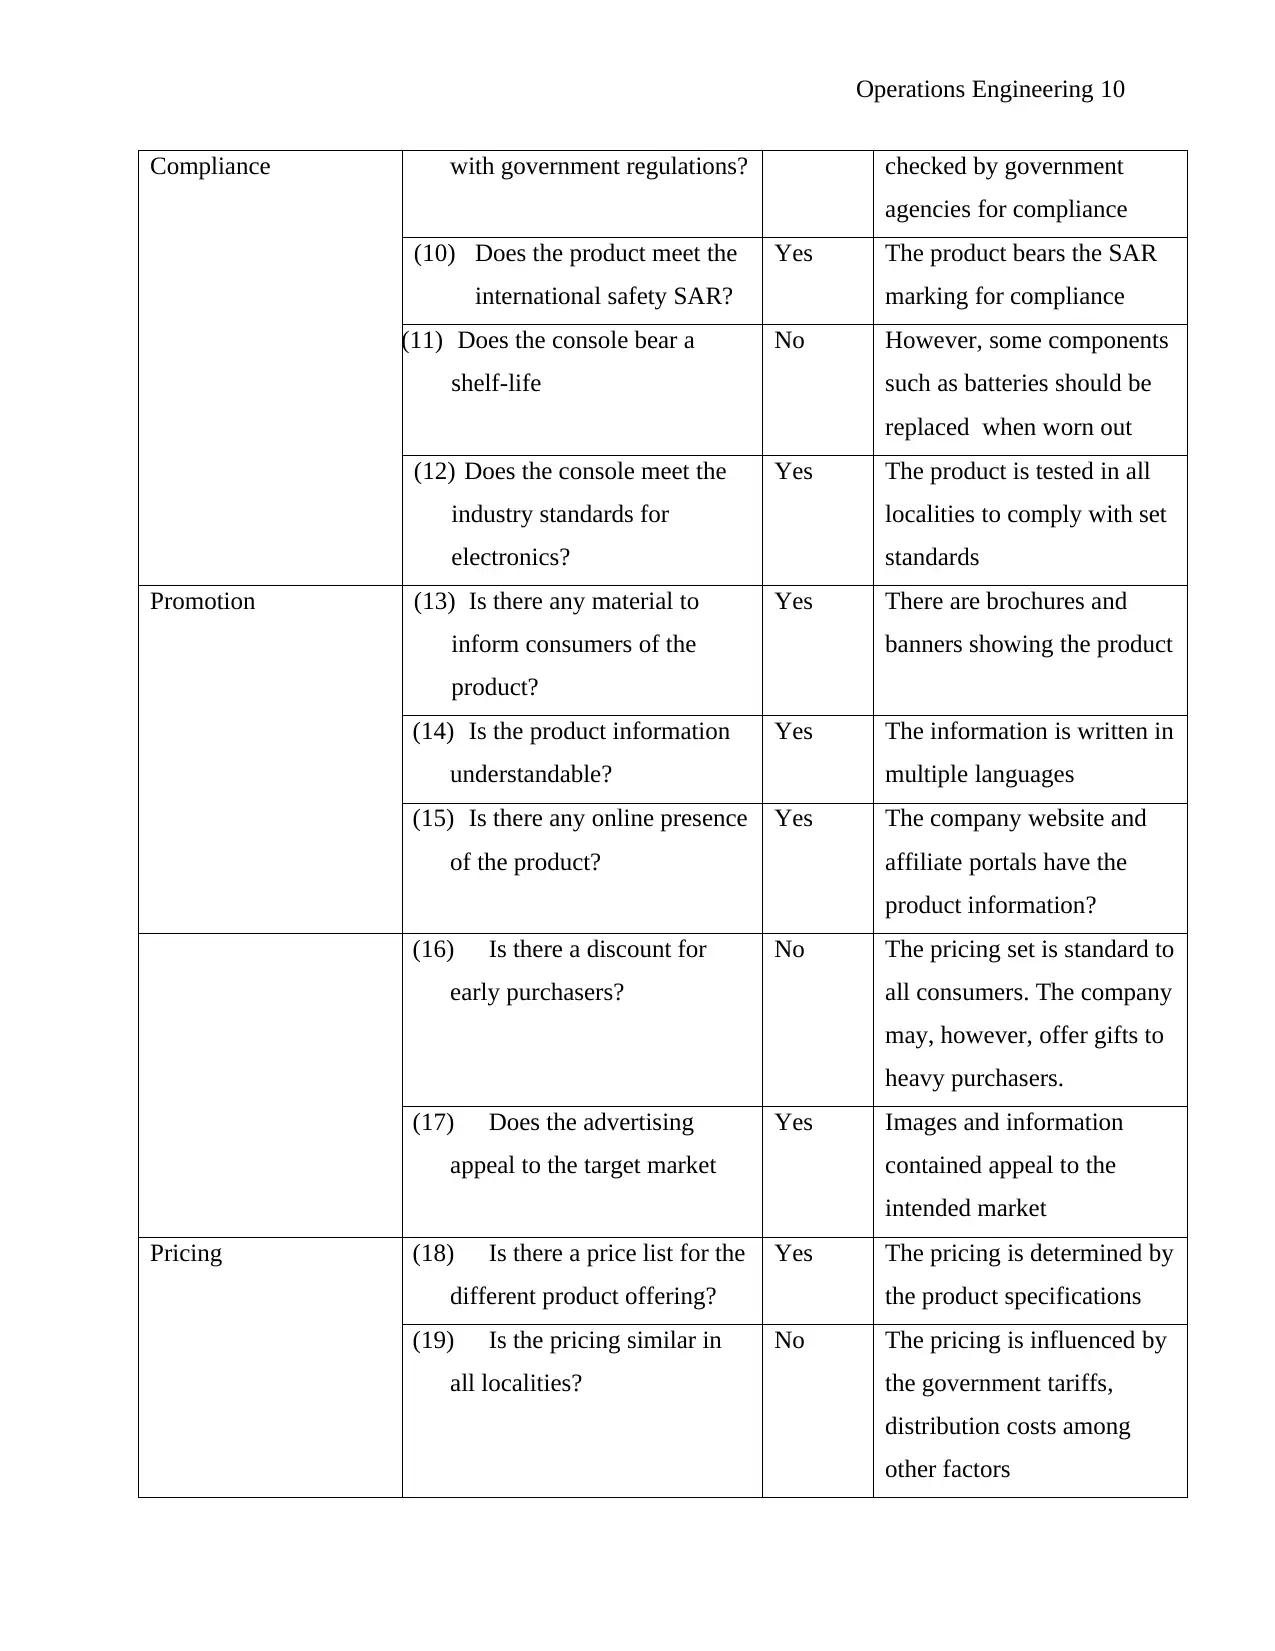
Compliance with government regulations? checked by government
agencies for compliance
(10) Does the product meet the
international safety SAR?
Yes The product bears the SAR
marking for compliance
(11) Does the console bear a
shelf-life
No However, some components
such as batteries should be
replaced when worn out
(12) Does the console meet the
industry standards for
electronics?
Yes The product is tested in all
localities to comply with set
standards
Promotion (13) Is there any material to
inform consumers of the
product?
Yes There are brochures and
banners showing the product
(14) Is the product information
understandable?
Yes The information is written in
multiple languages
(15) Is there any online presence
of the product?
Yes The company website and
affiliate portals have the
product information?
(16) Is there a discount for
early purchasers?
No The pricing set is standard to
all consumers. The company
may, however, offer gifts to
heavy purchasers.
(17) Does the advertising
appeal to the target market
Yes Images and information
contained appeal to the
intended market
Pricing (18) Is there a price list for the
different product offering?
Yes The pricing is determined by
the product specifications
(19) Is the pricing similar in
all localities?
No The pricing is influenced by
the government tariffs,
distribution costs among
other factors
Paraphrase This Document
Need a fresh take? Get an instant paraphrase of this document with our AI Paraphraser
Operations Engineering 11
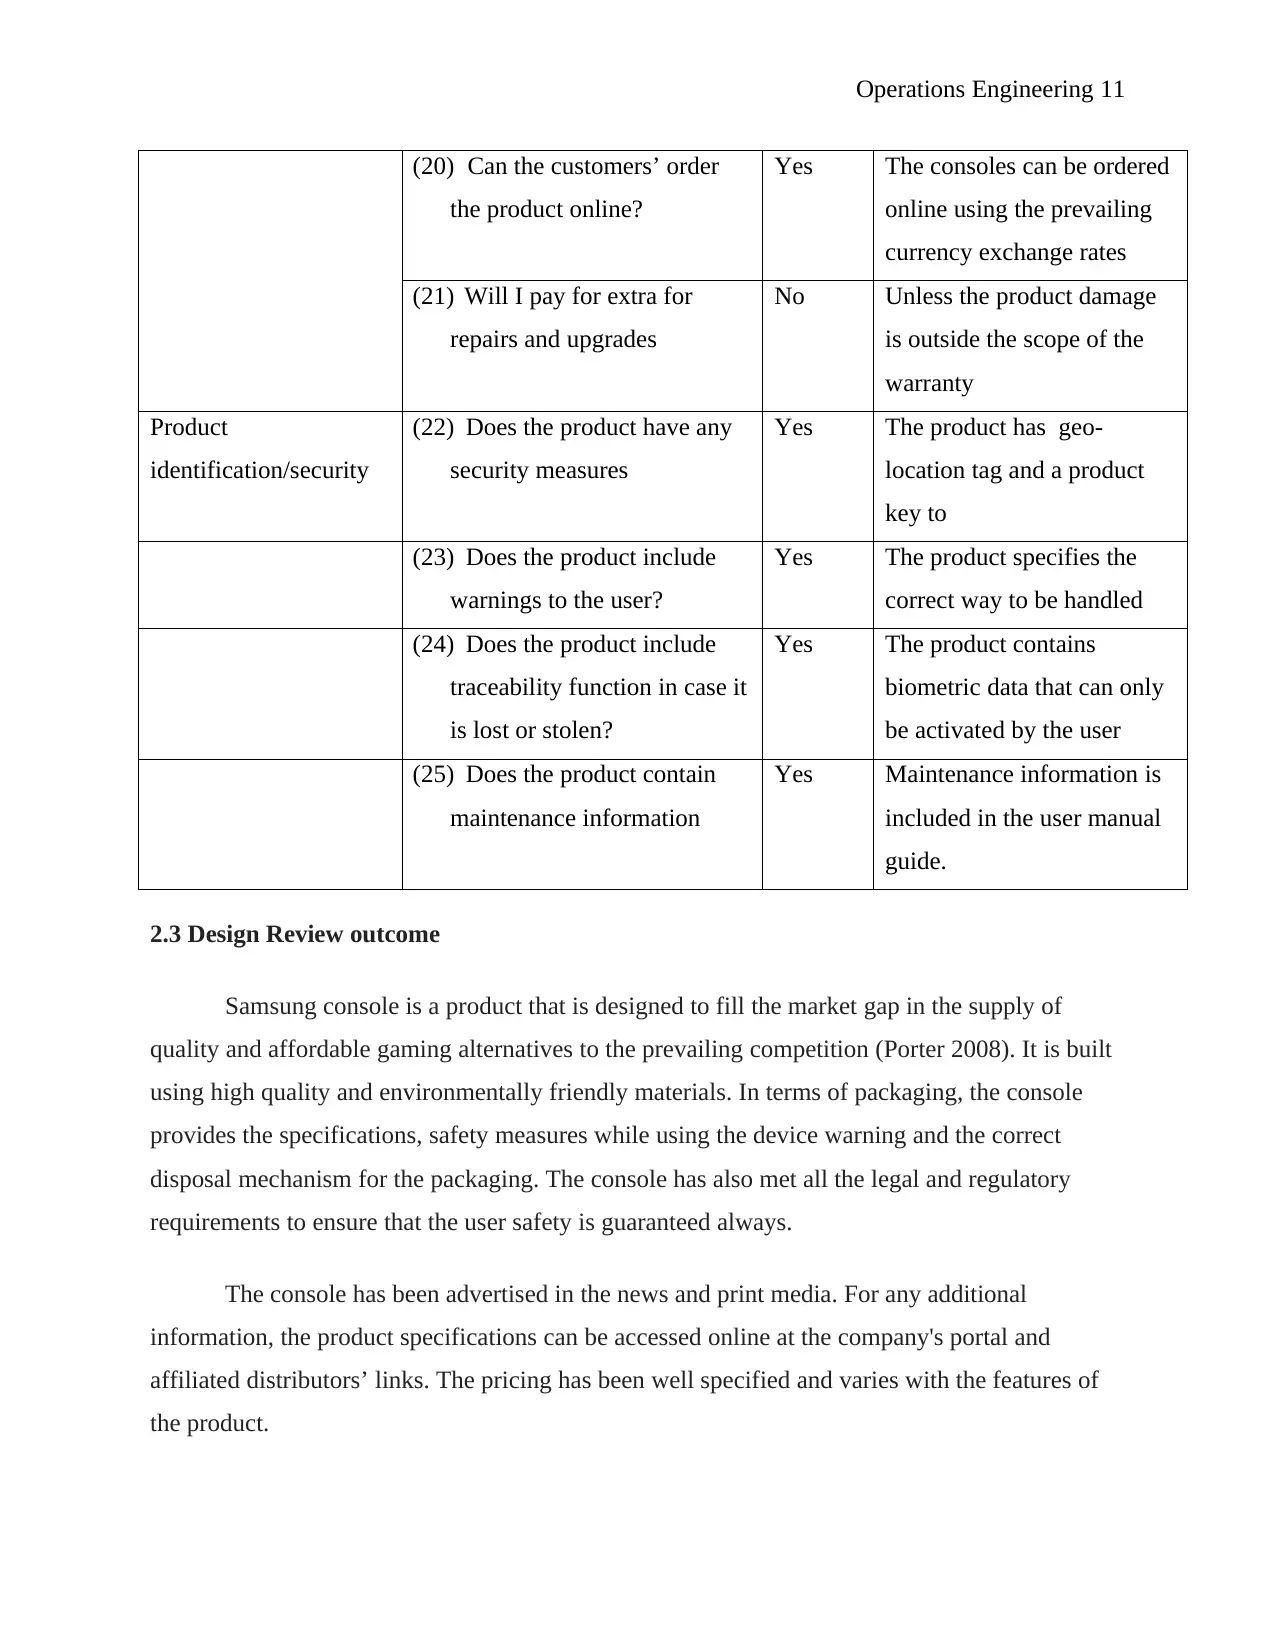
(20) Can the customers’ order
the product online?
Yes The consoles can be ordered
online using the prevailing
currency exchange rates
(21) Will I pay for extra for
repairs and upgrades
No Unless the product damage
is outside the scope of the
warranty
Product
identification/security
(22) Does the product have any
security measures
Yes The product has geo-
location tag and a product
key to
(23) Does the product include
warnings to the user?
Yes The product specifies the
correct way to be handled
(24) Does the product include
traceability function in case it
is lost or stolen?
Yes The product contains
biometric data that can only
be activated by the user
(25) Does the product contain
maintenance information
Yes Maintenance information is
included in the user manual
guide.
2.3 Design Review outcome
Samsung console is a product that is designed to fill the market gap in the supply of
quality and affordable gaming alternatives to the prevailing competition (Porter 2008). It is built
using high quality and environmentally friendly materials. In terms of packaging, the console
provides the specifications, safety measures while using the device warning and the correct
disposal mechanism for the packaging. The console has also met all the legal and regulatory
requirements to ensure that the user safety is guaranteed always.
The console has been advertised in the news and print media. For any additional
information, the product specifications can be accessed online at the company's portal and
affiliated distributors’ links. The pricing has been well specified and varies with the features of
the product.
Operations Engineering 12
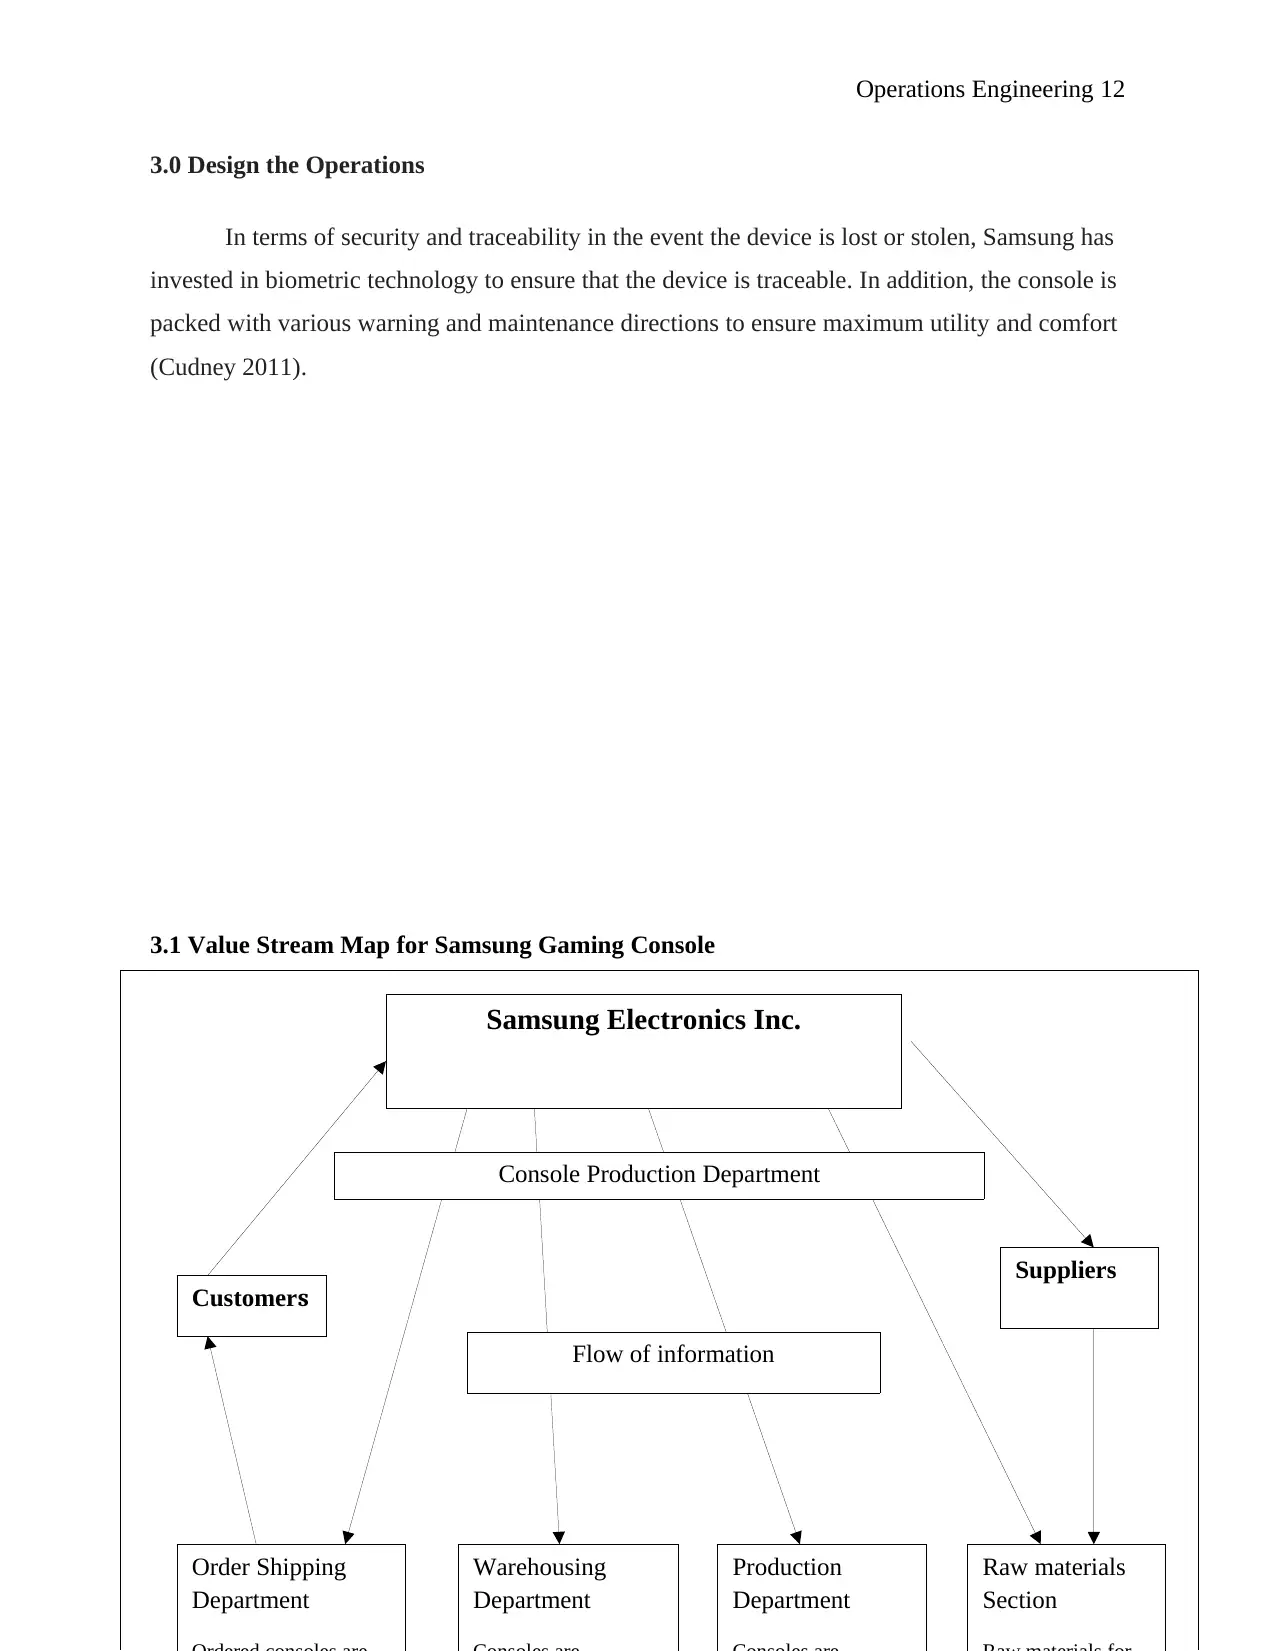
3.0 Design the Operations
In terms of security and traceability in the event the device is lost or stolen, Samsung has
invested in biometric technology to ensure that the device is traceable. In addition, the console is
packed with various warning and maintenance directions to ensure maximum utility and comfort
(Cudney 2011).
3.1 Value Stream Map for Samsung Gaming Console
Samsung Electronics Inc.
Customers
Suppliers
Order Shipping
Department
Warehousing
Department
Production
Department
Raw materials
Section
Flow of information
Console Production Department
⊘ This is a preview!⊘
Do you want full access?
Subscribe today to unlock all pages.
Trusted by 1+ million students worldwide
1 out of 32


Your All-in-One AI-Powered Toolkit for Academic Success.
+13062052269
info@desklib.com
Available 24*7 on WhatsApp / Email
![[object Object]](/_next/static/media/star-bottom.7253800d.svg)
Unlock your academic potential
Copyright © 2020–2026 A2Z Services. All Rights Reserved. Developed and managed by ZUCOL.