MSc: Critical Analysis of Operations Impact on Resources
VerifiedAdded on 2023/06/13
|19
|5198
|117
Report
AI Summary
This report critically analyzes the impact of operational practices on financial performance, focusing on cost centers and competitive advantage. It appraises performance using KPIs like volume fill and paragon hours, comparing planned versus actual results. The analysis identifies drivers of performance and recommends improvements based on established theories, considering factors such as vehicle allocation and fuel efficiency. The study highlights the importance of balancing cost to serve and suggests areas for further research to optimize resource management and financial outcomes. Desklib offers more resources for students.
Running head: MANAGING FINANCIAL AND HUMAN RESOURCES
Managing Financial and Human Resources
Name of Student:
Name of University:
Author’s Note:
Managing Financial and Human Resources
Name of Student:
Name of University:
Author’s Note:
Paraphrase This Document
Need a fresh take? Get an instant paraphrase of this document with our AI Paraphraser
1MANAGING FINANCIAL AND HUMAN RESOURCES
Table of Contents
Introduction......................................................................................................................................2
Impact of operations on financial performance...........................................................................2
Cost centres..................................................................................................................................2
Financial performance competitive advantage............................................................................3
Balancing cost to serve................................................................................................................3
Identify KPIS to talk about and explain going to explore them..................................................3
Appraisal of Performance................................................................................................................3
Analysis...........................................................................................................................................4
KPI No.1 – Volume Fill...................................................................................................................4
Description of the KPI.................................................................................................................5
Plan vs actual performance..........................................................................................................5
Identify the drivers of the performance and back it up................................................................8
Recommendations of the improvements based on theory discussed...........................................8
KPI No. 2.........................................................................................................................................8
Description of the KPI.................................................................................................................8
Plan vs actual performance..........................................................................................................8
Identify the drivers of the performance and back it up..............................................................11
Recommendations of the improvements based on theory discussed.........................................11
KPI No. 3 – Paragon Hours % Utilisation.....................................................................................12
Description of the KPI...............................................................................................................12
Plan vs actual performance........................................................................................................12
Identify the drivers of the performance and back it up..............................................................14
Recommendations of the improvements based on theory discussed.........................................15
Conclusion.....................................................................................................................................15
2MANAGING FINANCIAL AND HUMAN RESOURCES
References......................................................................................................................................17
Introduction
Impact of operations on financial performance
As stated by Wilke, Majumdar and Ochieng (2014) in the operations management the
total quality management has been seen with the application of the concepts such as “total
quality management or just in time”. These concepts have been seen to be improving the
operational performance and significantly contributing to the financial performance. Several
types of the empirical evidence have supported the effect of the operational performance is
context dependent. The findings have further revealed that both “accounting- and market-based
financial performances” are closely related to the effectiveness of SCM. The supply chain
integration and performance drivers are seen with the sourcing strategy, “SC integration, and
external relationships play critical roles to improve firm-level financial performance”. The
supply chain alignment and integration with the IT infrastructure and SC relationship is
important for realising the full financial advantage and effective SCM (Rajapakshe et al. 2017).
Cost centres
A cost centre is identified as the department in which the cost is allocated. The term
includes the departments which does not produce directly however incur cost to the business.
This is considered when the manager and the employees of the cost centre are not accountable
for the investment decisions and profitability and only responsible for some of the costs. The two
main types of the cost centres are seen with production cost centres and service cost centres. The
production cost centres are seen with the place where the products are processed or
manufactured. The service cost centres are considered with the services provided to the other
cost centres (Zhao 2014).
Financial performance competitive advantage
Early learnings have been seen with the strong connection among the cost advantage and
organization performance. The firms specific margin in the cost competency is relative to their
rivals, low manufacturing cost and improved performance. The firm’s performance with the
⊘ This is a preview!⊘
Do you want full access?
Subscribe today to unlock all pages.
Trusted by 1+ million students worldwide
3MANAGING FINANCIAL AND HUMAN RESOURCES
trade performance is depicted with the basis of “sales return, yield, return on investment, output,
Market split and the manufactured goods growth”. There have been several studies which is able
to examine the relationship between the competitive edge and financial performance is depicted
with the “higher performance, unique advantage without better performance and superior
performance without unique advantage” (Hazen et al. 2016).
Balancing cost to serve
As discussed by Qin, Nembhard and Barnes (2015), It is seen that trimming customer
service cost and boosting of customer satisfaction is challenging in the best of times. Mangers
often view service efficiency and customer satisfaction to be incompatible with the goals. Three
main practices to strike an optimal balance in the service operations is recognized with the
segment service levels, striving for consistency over several budget cycles and sharing of
accountability and continually look for efficiencies (Pedraza-Martinez and Van Wassenhove
2016).
Identify KPIS to talk about and explain going to explore them
The study aims to identify and explore the KPIs in terms of vehicle fill and miles per
store journey. The discussion of the KPIs will be explained in terms of explaining the each KPI
individually, identify the various types of the data in terms of the plan vs actual performance. It
has further identified the drivers of the performance and back it up.
Appraisal of Performance
The impact of the operations on financial performance in the given case is considered
with the times vehicle fill and miles per store journey. The different types of the parameters used
in the evaluation has been seen to be improving the operational performance and significantly
contributing to the financial performance. Several types of the empirical evidence have
supported the effect of the operational performance is context dependent. The findings have
further revealed that both “accounting- and market-based financial performances” are closely
related to the effectiveness of SCM. This consideration will be considered with the impact of the
selected KPI in the financial estimation. It is further considered that the cost centre is identified
is associated with the respective KPI, i.e. the volume fill and miles per Journey. The relevant
discussion of the study on the consideration of the cost centres has been able to state on the
Paraphrase This Document
Need a fresh take? Get an instant paraphrase of this document with our AI Paraphraser
4MANAGING FINANCIAL AND HUMAN RESOURCES
different aspects where the products are processed or manufactured. In this case, the total volume
is considered. The service cost centres are considered with the services provided to the other cost
centres. On addition to this, the various types of the discourse of the study related to the selected
KPI has been able to state on the firm’s specific margin in the cost competency is relative to their
rivals, low manufacturing cost and improved performance. The firm’s performance with the
trade performance is depicted with the basis of “sales return, yield, return on investment, output,
Market split and the manufactured goods growth”. Some of the different types of the other
considerations of the report has further highlighted on the techniques which are seen with the
trimming customer service cost and boosting of customer satisfaction is challenging in the best
of times. Mangers often view service efficiency and customer satisfaction to be incompatible
with the goals (Kou and Yu 2015).
The various types of the other aspects of the appraisal is further seen to be considered
with the identify and explore the KPIs in terms of vehicle fill and miles per store journey. The
discussion of the KPIs will be explained in terms of explaining the each KPI individually,
identify the various types of the data in terms of the plan vs actual performance. It has further
identified the drivers of the performance and consider the various types of the other relevant data
to estimate the overall contribution of the operations techniques in financing (Choi, Cheng and
Zhao 2016).
Analysis
KPI No.1 – Volume Fill
Description of the KPI
The volume fill KPI is defined as the total quantity of the petrol which had been filled in
the trailer. The various types of the data available for this parameter is able to state on the
planned and actual amount of the litres of petrol which were filled in the trailers. The different
5MANAGING FINANCIAL AND HUMAN RESOURCES
aspects of the description of the KPI data is further able to estimate the cost required in filling
petrol in the vehicle.
The miles per journey is seen to be defined with the total distance which the trailer able
to travel before it required to be refilled.
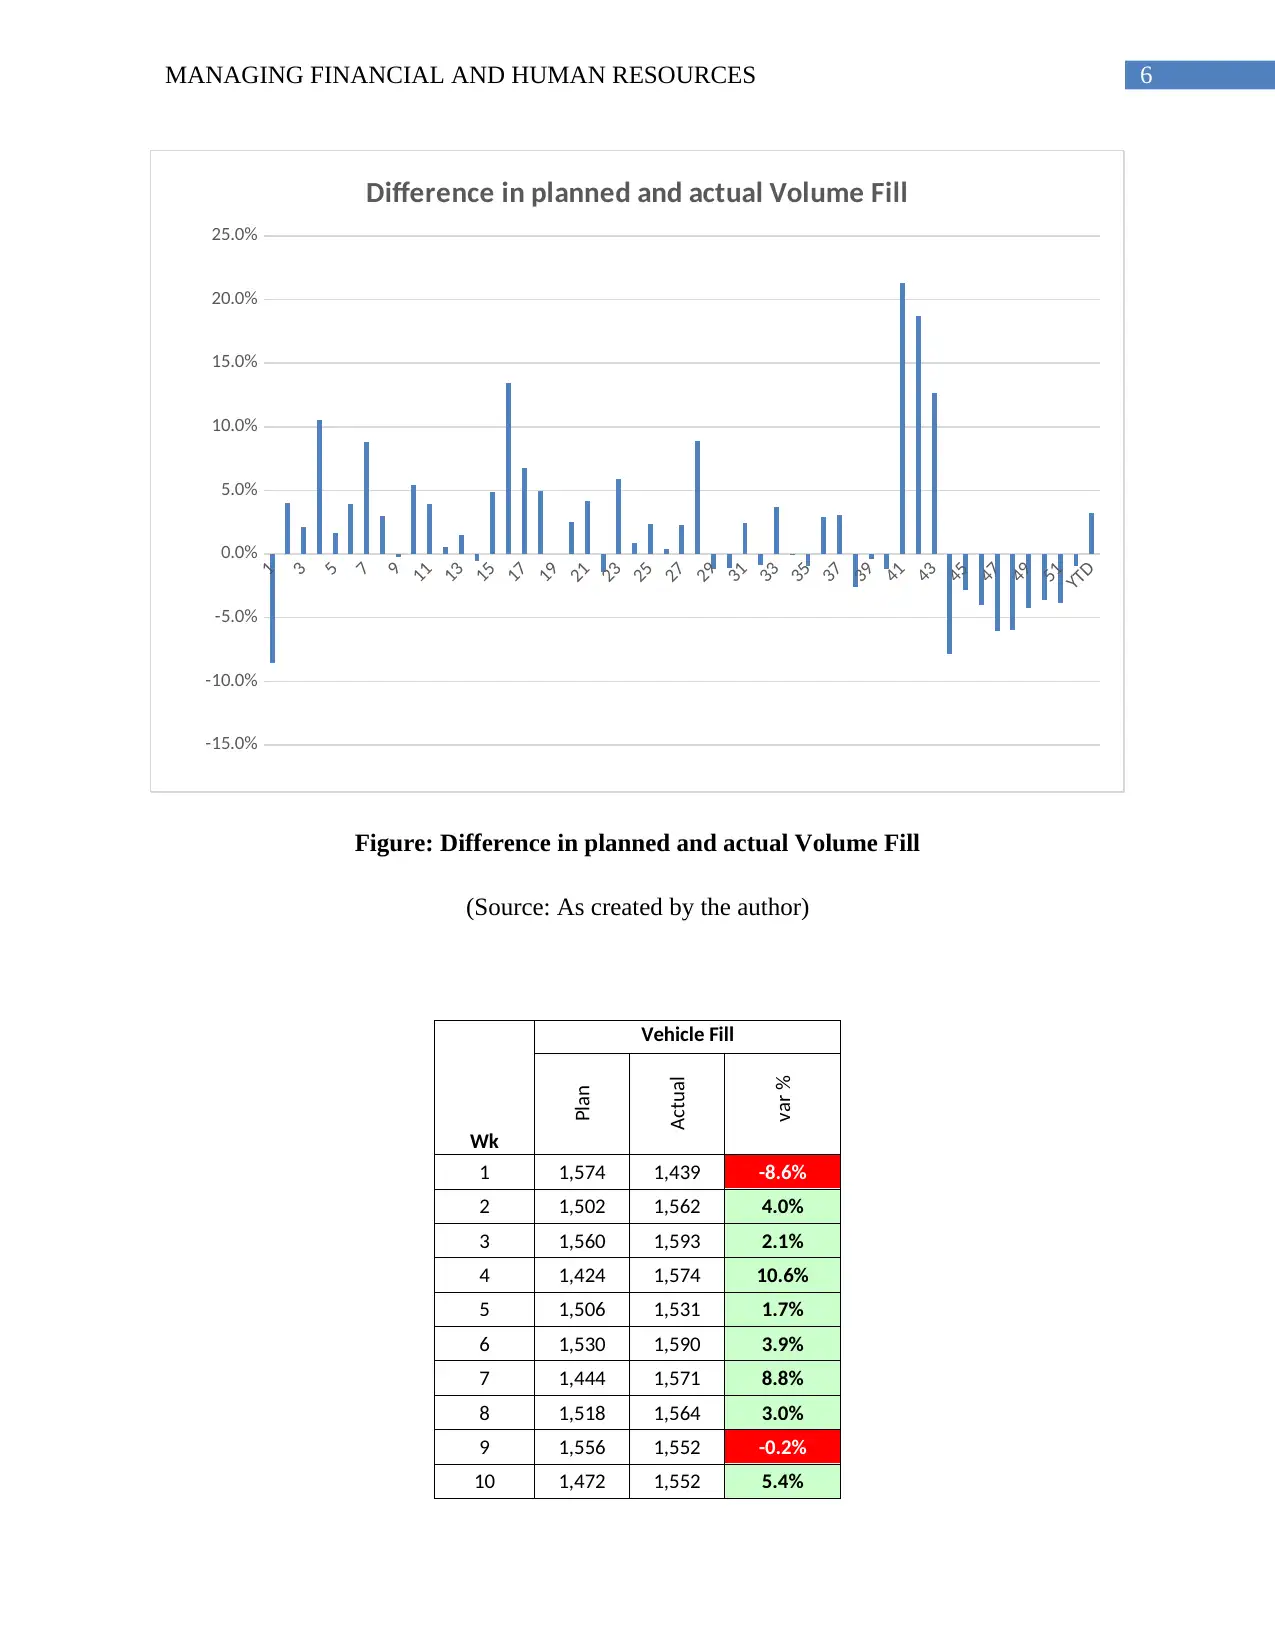
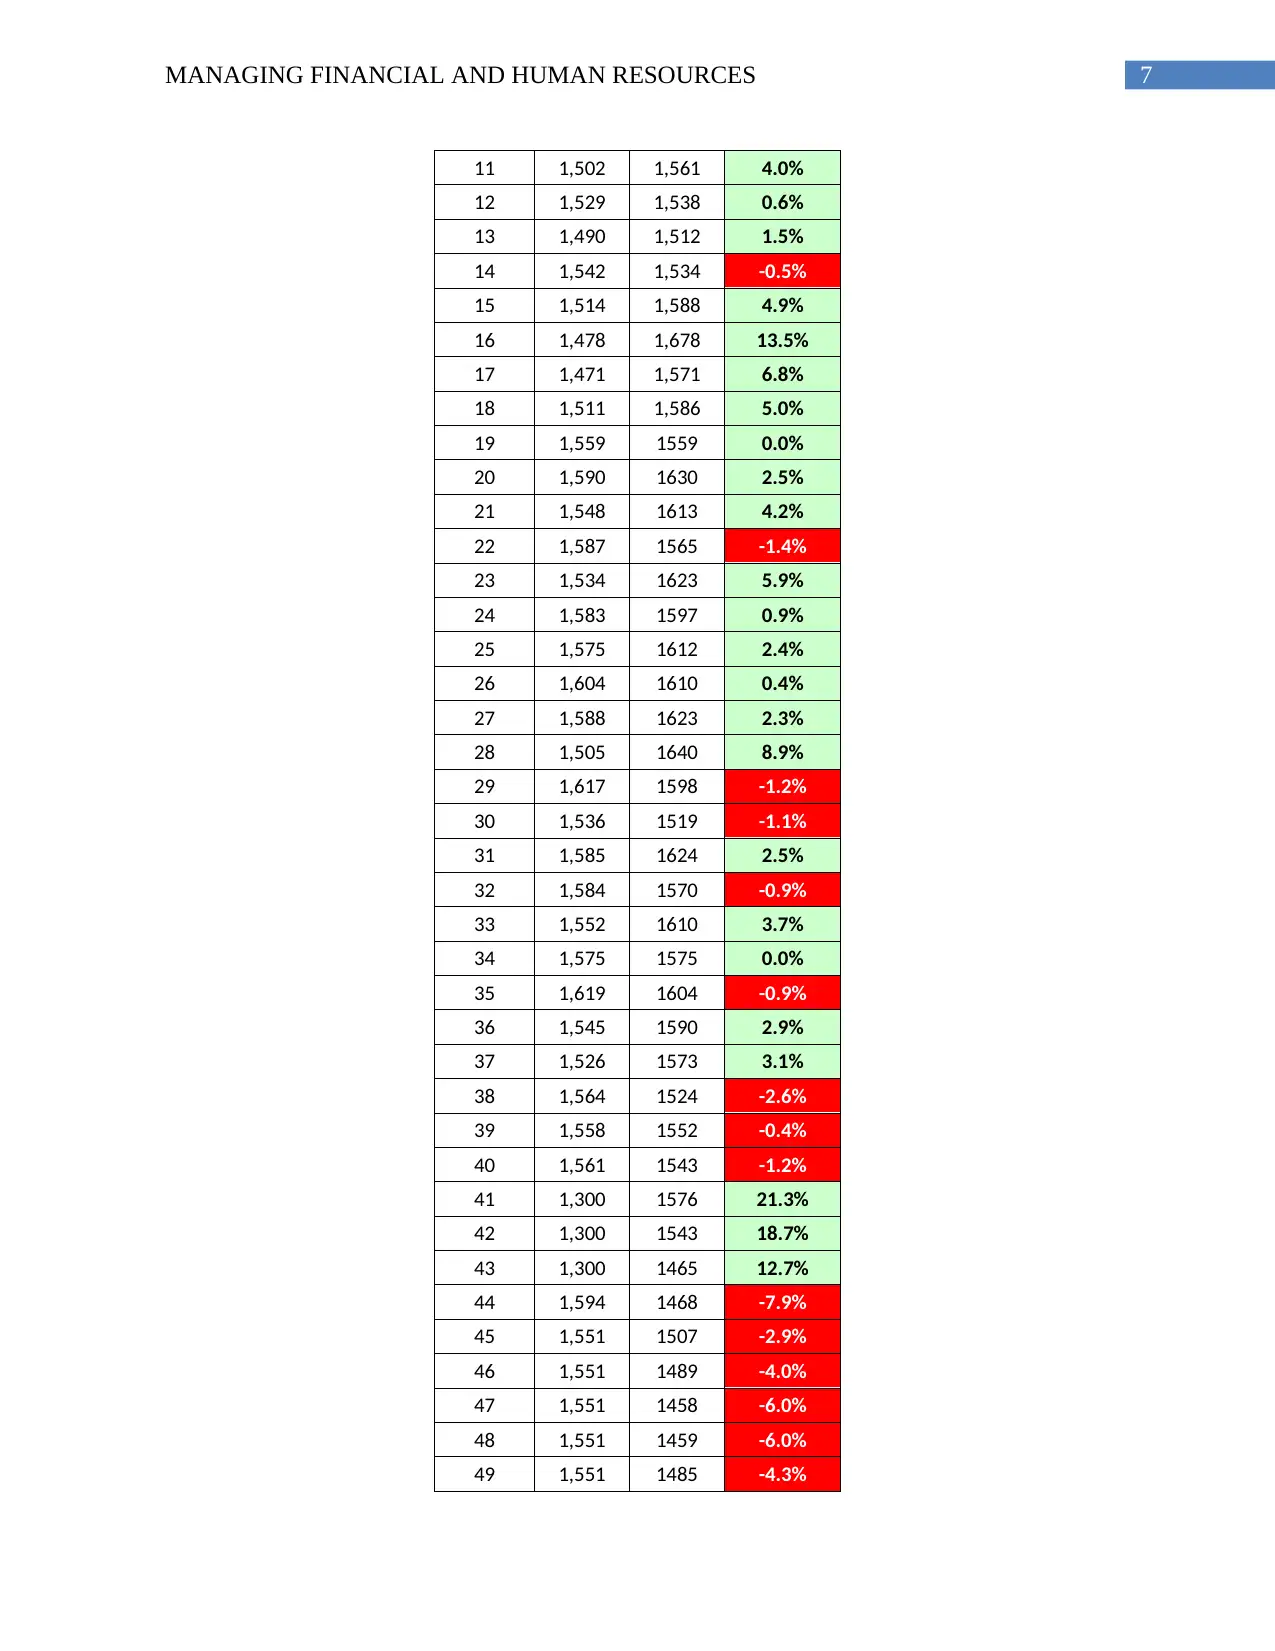
Plan vs actual performance
The different types of the interpretations made as per the planned and the actual fill of the
tanker is understood to be depict that there was significant mismatch in the week one itself. This
has been seen to be evident with planned volume fill of 1574 litres and actual fill of 1439. This is
seen to be depicted with a total variation of 8.6%. in addition to this, in week 41 and 42 there is a
discrepancy of the 21.3% and 18.7%. Despite of the positive increase there has been a significant
increase in the cost of the volume of petrol required for refilling of the trailer in terms of the
planned and the actual results. Some of the different types of the variations in the price of the
trailers are considered with the various types of the negative trends, as per the depiction of this
data, despite of the positive data there is significant scope of the improvement in he planned and
the actual results. The depictions of this data have been able to state that there has been a high
risk of the increasing nature of the cost in the planned and the actual results (Hübner, Holzapfel
and Kuhn 2015).
aspects of the description of the KPI data is further able to estimate the cost required in filling
petrol in the vehicle.
The miles per journey is seen to be defined with the total distance which the trailer able
to travel before it required to be refilled.
Plan vs actual performance
The different types of the interpretations made as per the planned and the actual fill of the
tanker is understood to be depict that there was significant mismatch in the week one itself. This
has been seen to be evident with planned volume fill of 1574 litres and actual fill of 1439. This is
seen to be depicted with a total variation of 8.6%. in addition to this, in week 41 and 42 there is a
discrepancy of the 21.3% and 18.7%. Despite of the positive increase there has been a significant
increase in the cost of the volume of petrol required for refilling of the trailer in terms of the
planned and the actual results. Some of the different types of the variations in the price of the
trailers are considered with the various types of the negative trends, as per the depiction of this
data, despite of the positive data there is significant scope of the improvement in he planned and
the actual results. The depictions of this data have been able to state that there has been a high
risk of the increasing nature of the cost in the planned and the actual results (Hübner, Holzapfel
and Kuhn 2015).
⊘ This is a preview!⊘
Do you want full access?
Subscribe today to unlock all pages.
Trusted by 1+ million students worldwide
6MANAGING FINANCIAL AND HUMAN RESOURCES
1
3
5
7
9
11
13
15
17
19
21
23
25
27
29
31
33
35
37
39
41
43
45
47
49
51
YTD
-15.0%
-10.0%
-5.0%
0.0%
5.0%
10.0%
15.0%
20.0%
25.0%
Difference in planned and actual Volume Fill
Figure: Difference in planned and actual Volume Fill
(Source: As created by the author)
Wk
Vehicle Fill
Plan
Actual
var %
1 1,574 1,439 -8.6%
2 1,502 1,562 4.0%
3 1,560 1,593 2.1%
4 1,424 1,574 10.6%
5 1,506 1,531 1.7%
6 1,530 1,590 3.9%
7 1,444 1,571 8.8%
8 1,518 1,564 3.0%
9 1,556 1,552 -0.2%
10 1,472 1,552 5.4%
Paraphrase This Document
Need a fresh take? Get an instant paraphrase of this document with our AI Paraphraser
7MANAGING FINANCIAL AND HUMAN RESOURCES
11 1,502 1,561 4.0%
12 1,529 1,538 0.6%
13 1,490 1,512 1.5%
14 1,542 1,534 -0.5%
15 1,514 1,588 4.9%
16 1,478 1,678 13.5%
17 1,471 1,571 6.8%
18 1,511 1,586 5.0%
19 1,559 1559 0.0%
20 1,590 1630 2.5%
21 1,548 1613 4.2%
22 1,587 1565 -1.4%
23 1,534 1623 5.9%
24 1,583 1597 0.9%
25 1,575 1612 2.4%
26 1,604 1610 0.4%
27 1,588 1623 2.3%
28 1,505 1640 8.9%
29 1,617 1598 -1.2%
30 1,536 1519 -1.1%
31 1,585 1624 2.5%
32 1,584 1570 -0.9%
33 1,552 1610 3.7%
34 1,575 1575 0.0%
35 1,619 1604 -0.9%
36 1,545 1590 2.9%
37 1,526 1573 3.1%
38 1,564 1524 -2.6%
39 1,558 1552 -0.4%
40 1,561 1543 -1.2%
41 1,300 1576 21.3%
42 1,300 1543 18.7%
43 1,300 1465 12.7%
44 1,594 1468 -7.9%
45 1,551 1507 -2.9%
46 1,551 1489 -4.0%
47 1,551 1458 -6.0%
48 1,551 1459 -6.0%
49 1,551 1485 -4.3%
8MANAGING FINANCIAL AND HUMAN RESOURCES
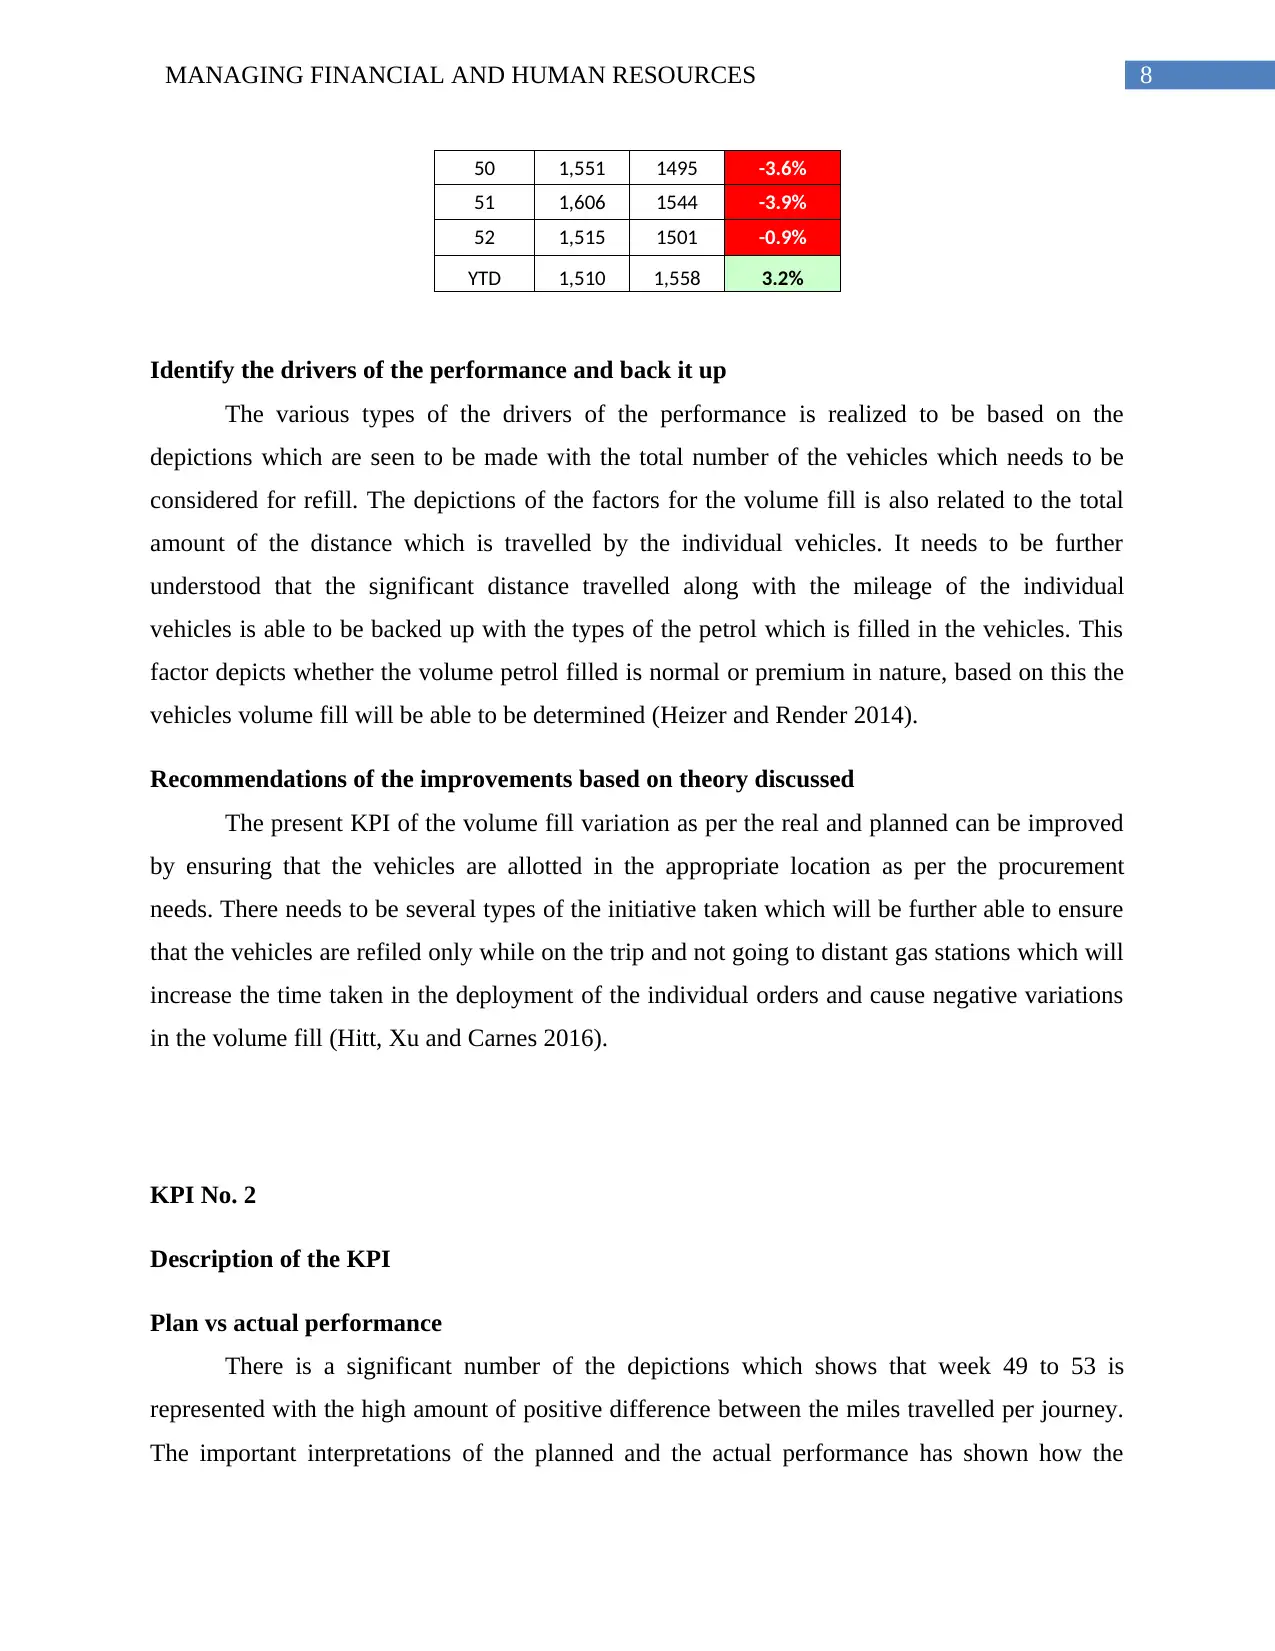
50 1,551 1495 -3.6%
51 1,606 1544 -3.9%
52 1,515 1501 -0.9%
YTD 1,510 1,558 3.2%
Identify the drivers of the performance and back it up
The various types of the drivers of the performance is realized to be based on the
depictions which are seen to be made with the total number of the vehicles which needs to be
considered for refill. The depictions of the factors for the volume fill is also related to the total
amount of the distance which is travelled by the individual vehicles. It needs to be further
understood that the significant distance travelled along with the mileage of the individual
vehicles is able to be backed up with the types of the petrol which is filled in the vehicles. This
factor depicts whether the volume petrol filled is normal or premium in nature, based on this the
vehicles volume fill will be able to be determined (Heizer and Render 2014).
Recommendations of the improvements based on theory discussed
The present KPI of the volume fill variation as per the real and planned can be improved
by ensuring that the vehicles are allotted in the appropriate location as per the procurement
needs. There needs to be several types of the initiative taken which will be further able to ensure
that the vehicles are refiled only while on the trip and not going to distant gas stations which will
increase the time taken in the deployment of the individual orders and cause negative variations
in the volume fill (Hitt, Xu and Carnes 2016).
KPI No. 2
Description of the KPI
Plan vs actual performance
There is a significant number of the depictions which shows that week 49 to 53 is
represented with the high amount of positive difference between the miles travelled per journey.
The important interpretations of the planned and the actual performance has shown how the
⊘ This is a preview!⊘
Do you want full access?
Subscribe today to unlock all pages.
Trusted by 1+ million students worldwide
9MANAGING FINANCIAL AND HUMAN RESOURCES
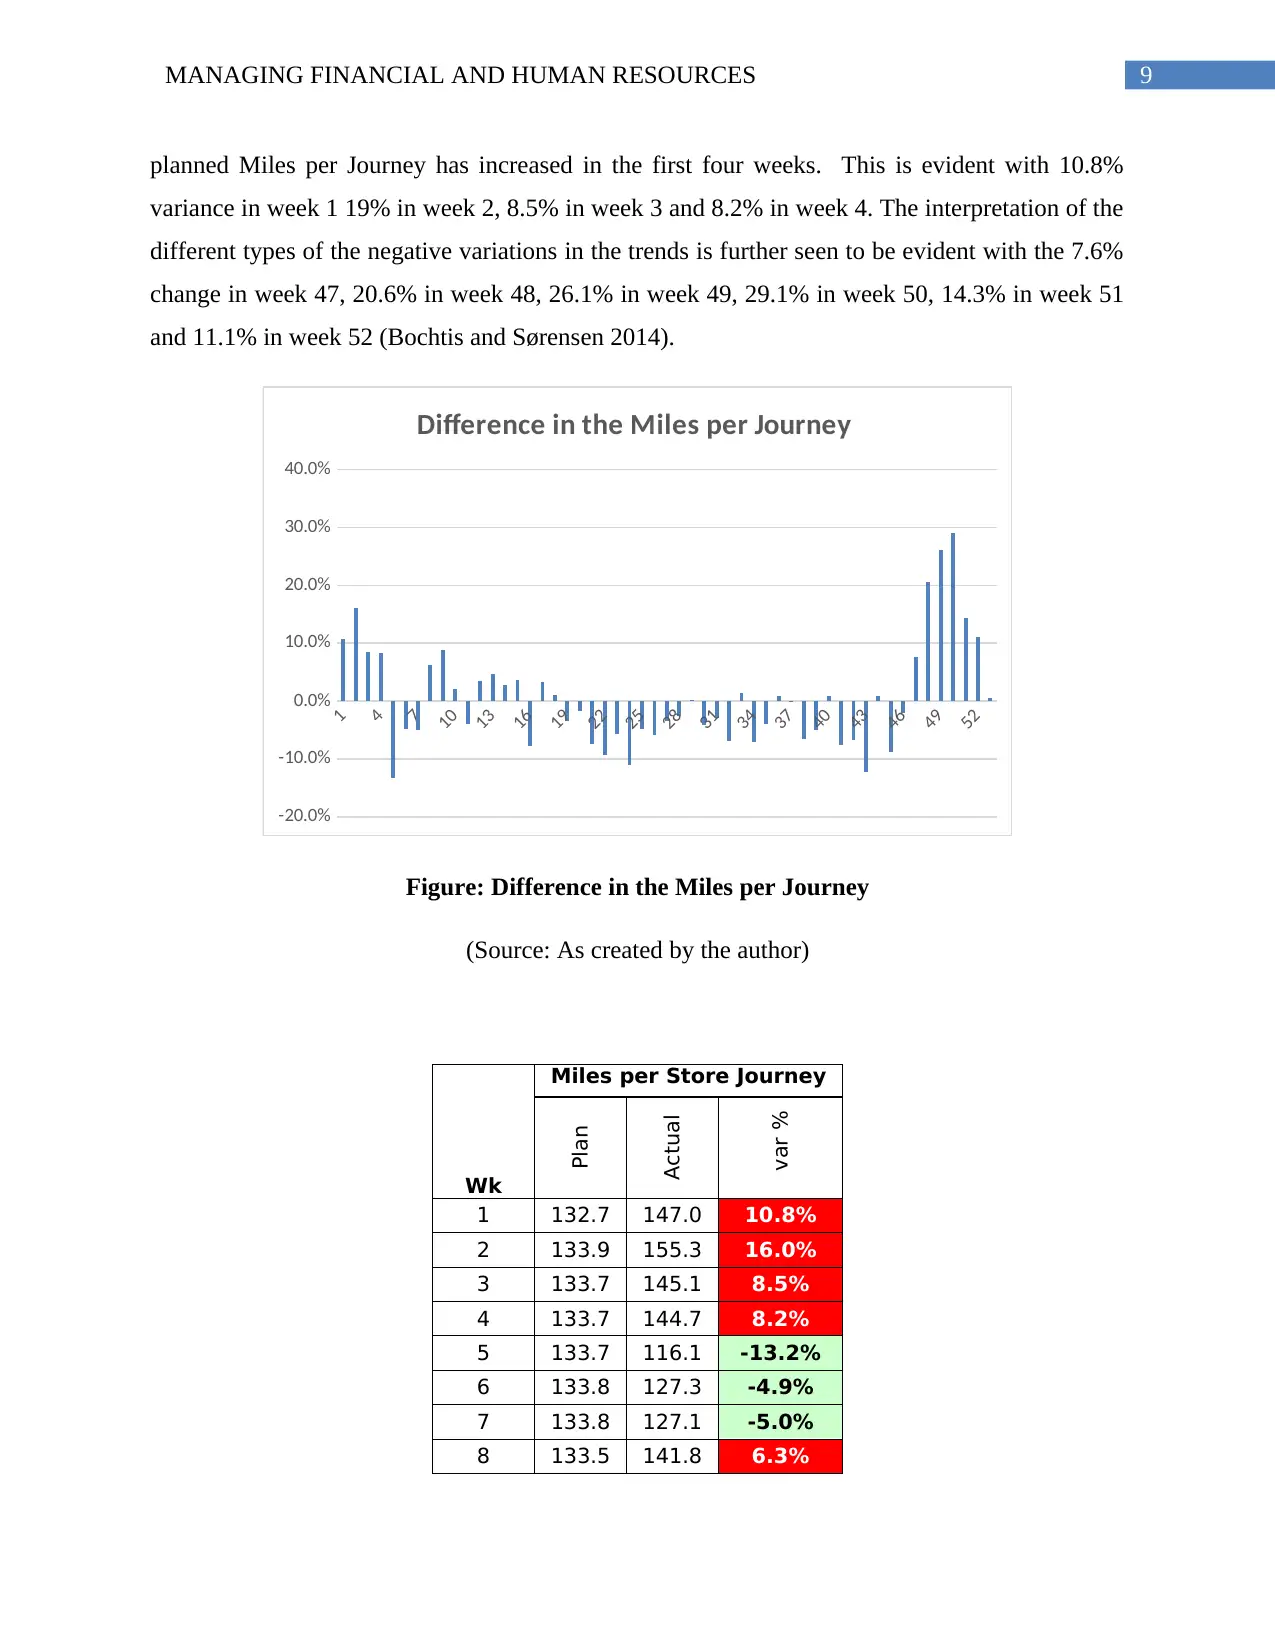
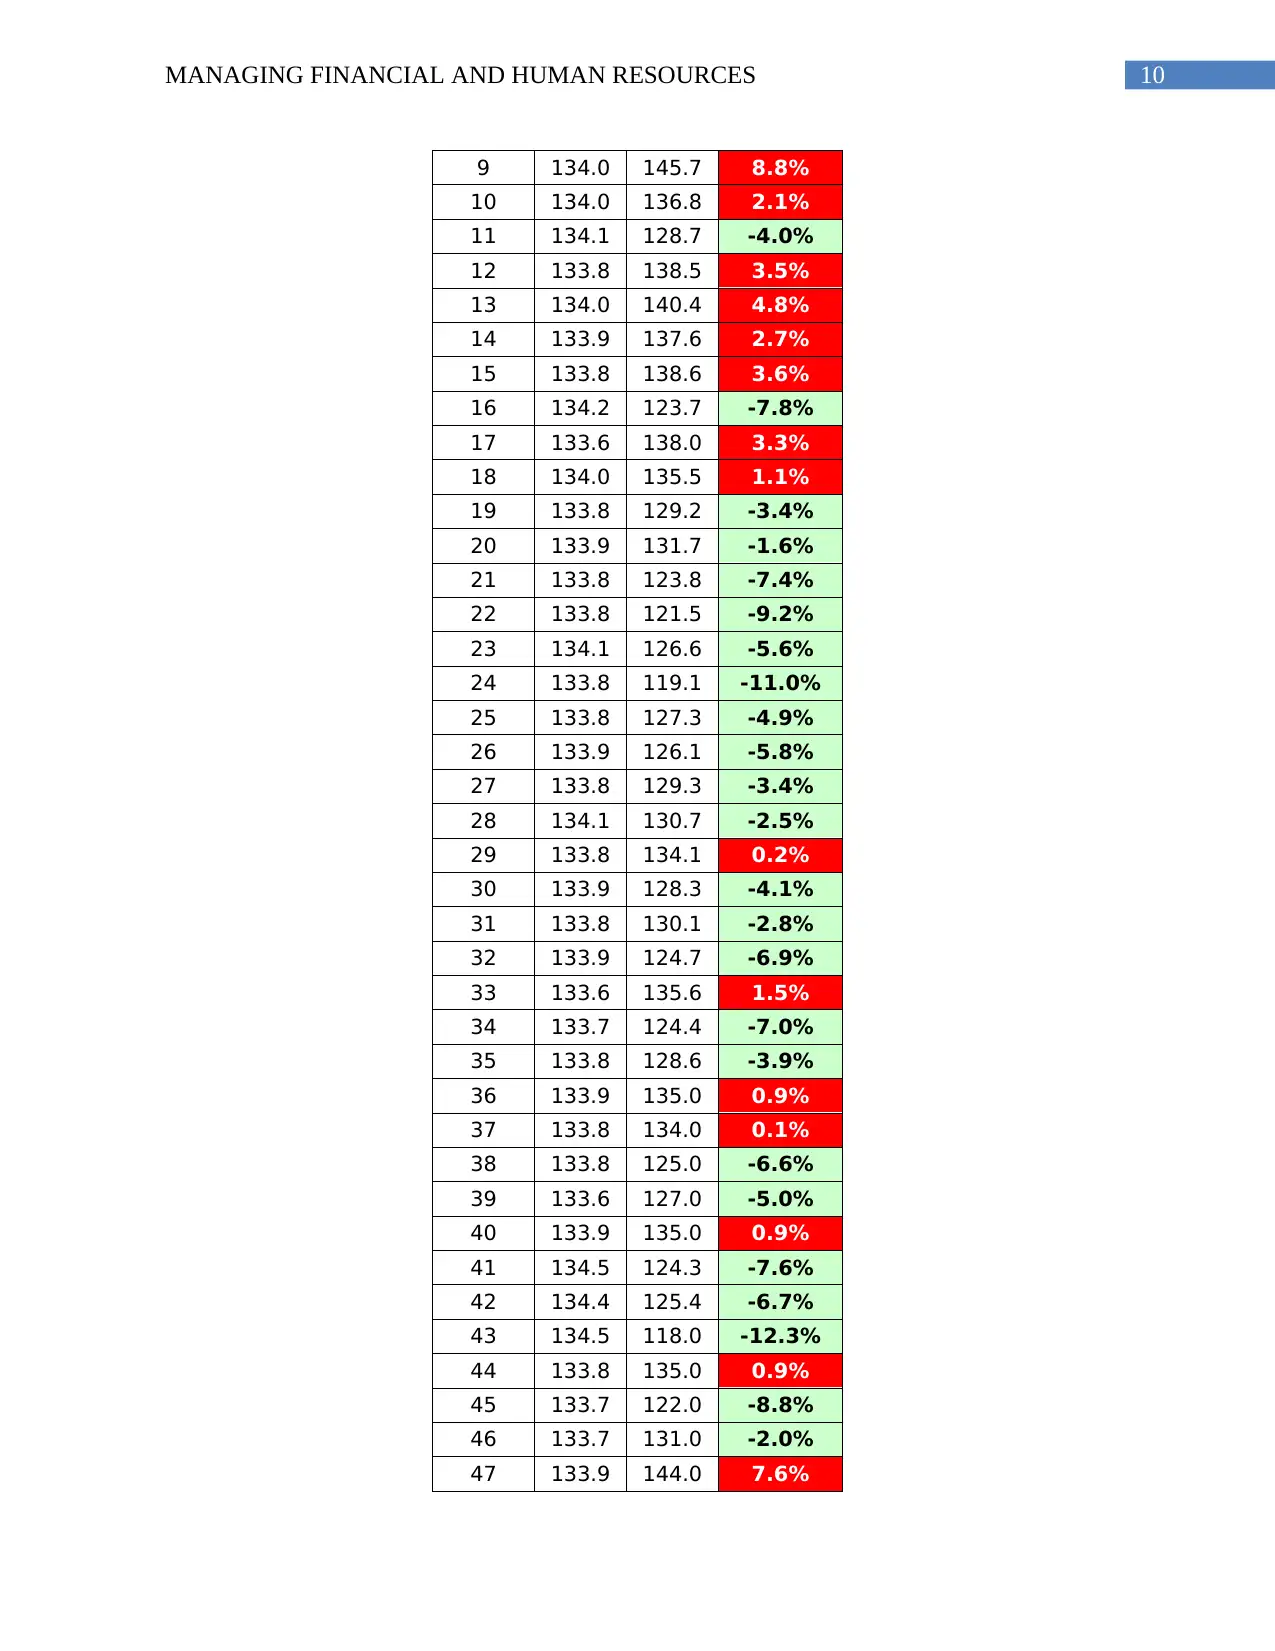
planned Miles per Journey has increased in the first four weeks. This is evident with 10.8%
variance in week 1 19% in week 2, 8.5% in week 3 and 8.2% in week 4. The interpretation of the
different types of the negative variations in the trends is further seen to be evident with the 7.6%
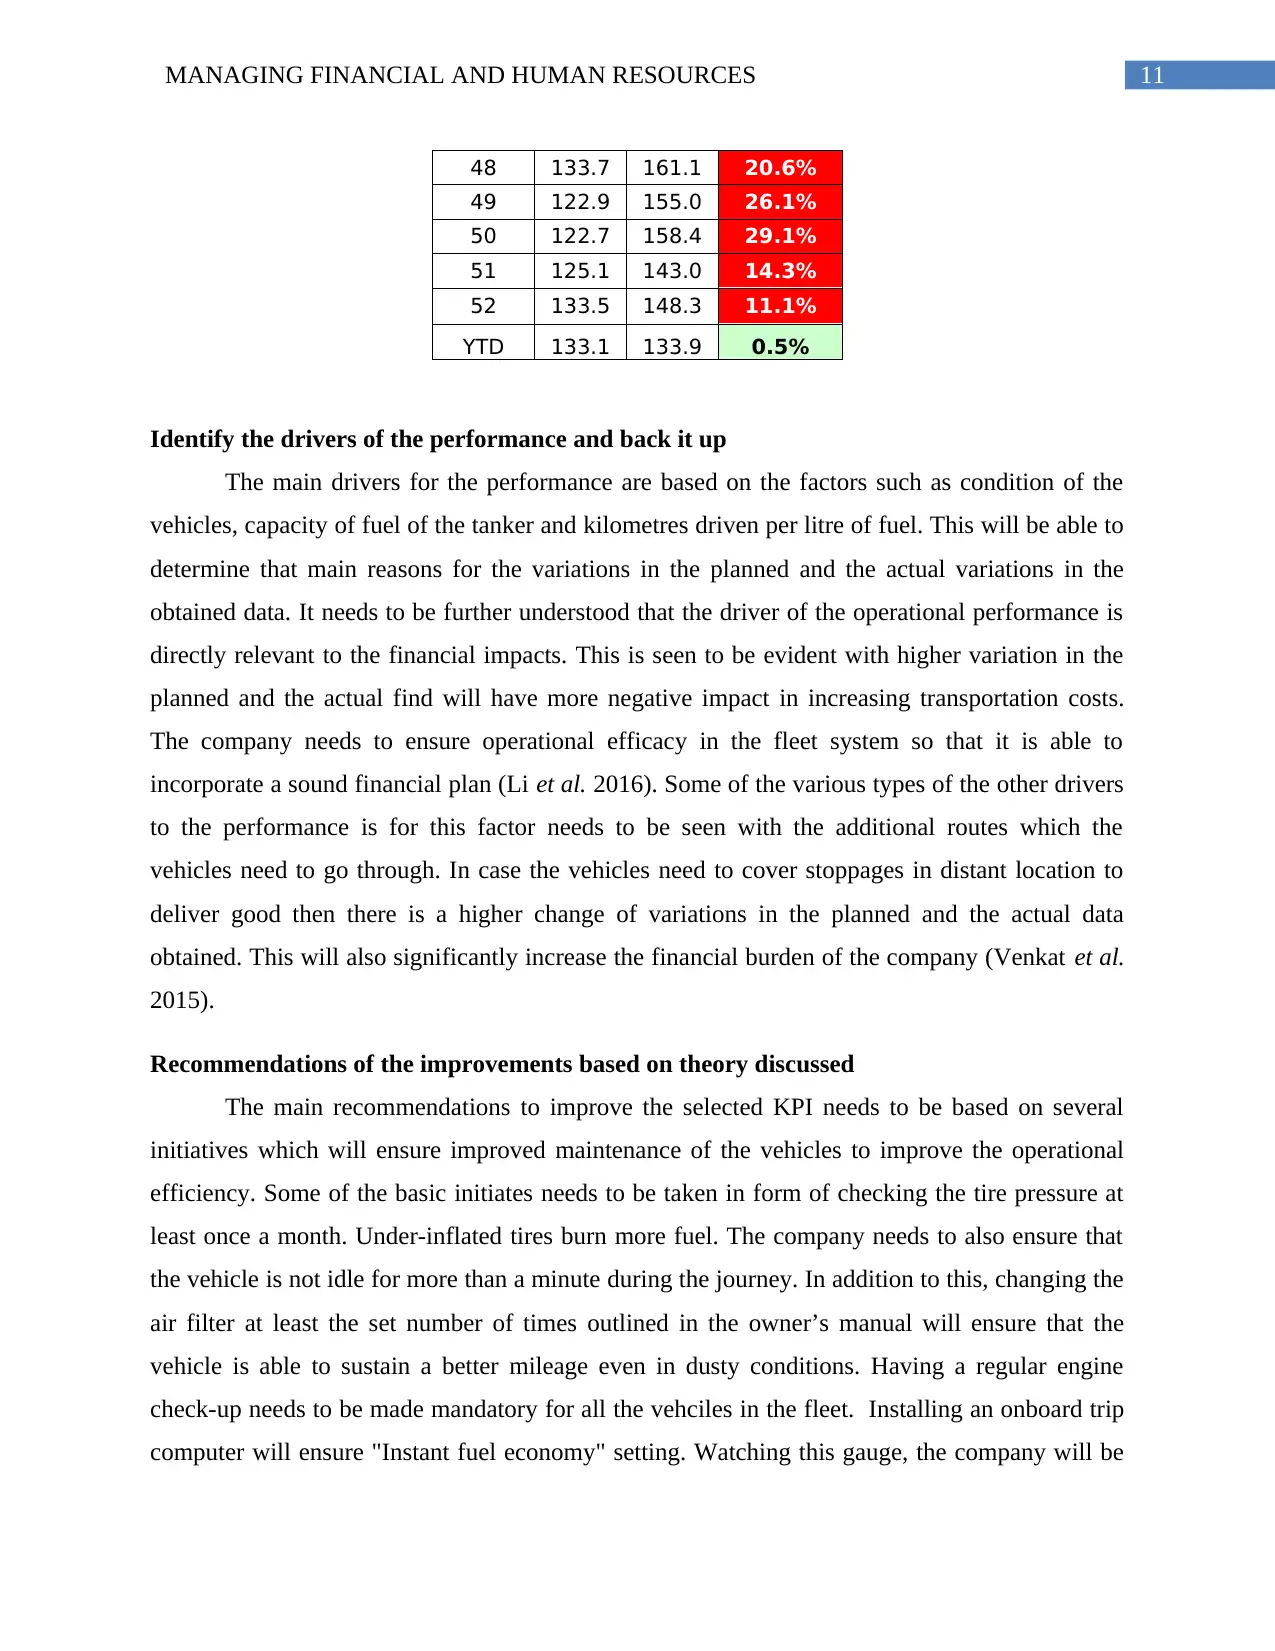
change in week 47, 20.6% in week 48, 26.1% in week 49, 29.1% in week 50, 14.3% in week 51
and 11.1% in week 52 (Bochtis and Sørensen 2014).
1
4
7
10
13
16
19
22
25
28
31
34
37
40
43
46
49
52
-20.0%
-10.0%
0.0%
10.0%
20.0%
30.0%
40.0%
Difference in the Miles per Journey
Figure: Difference in the Miles per Journey
(Source: As created by the author)
Wk
Miles per Store Journey
Plan
Actual
var %
1 132.7 147.0 10.8%
2 133.9 155.3 16.0%
3 133.7 145.1 8.5%
4 133.7 144.7 8.2%
5 133.7 116.1 -13.2%
6 133.8 127.3 -4.9%
7 133.8 127.1 -5.0%
8 133.5 141.8 6.3%
planned Miles per Journey has increased in the first four weeks. This is evident with 10.8%
variance in week 1 19% in week 2, 8.5% in week 3 and 8.2% in week 4. The interpretation of the
different types of the negative variations in the trends is further seen to be evident with the 7.6%
change in week 47, 20.6% in week 48, 26.1% in week 49, 29.1% in week 50, 14.3% in week 51
and 11.1% in week 52 (Bochtis and Sørensen 2014).
1
4
7
10
13
16
19
22
25
28
31
34
37
40
43
46
49
52
-20.0%
-10.0%
0.0%
10.0%
20.0%
30.0%
40.0%
Difference in the Miles per Journey
Figure: Difference in the Miles per Journey
(Source: As created by the author)
Wk
Miles per Store Journey
Plan
Actual
var %
1 132.7 147.0 10.8%
2 133.9 155.3 16.0%
3 133.7 145.1 8.5%
4 133.7 144.7 8.2%
5 133.7 116.1 -13.2%
6 133.8 127.3 -4.9%
7 133.8 127.1 -5.0%
8 133.5 141.8 6.3%
Paraphrase This Document
Need a fresh take? Get an instant paraphrase of this document with our AI Paraphraser
10MANAGING FINANCIAL AND HUMAN RESOURCES
9 134.0 145.7 8.8%
10 134.0 136.8 2.1%
11 134.1 128.7 -4.0%
12 133.8 138.5 3.5%
13 134.0 140.4 4.8%
14 133.9 137.6 2.7%
15 133.8 138.6 3.6%
16 134.2 123.7 -7.8%
17 133.6 138.0 3.3%
18 134.0 135.5 1.1%
19 133.8 129.2 -3.4%
20 133.9 131.7 -1.6%
21 133.8 123.8 -7.4%
22 133.8 121.5 -9.2%
23 134.1 126.6 -5.6%
24 133.8 119.1 -11.0%
25 133.8 127.3 -4.9%
26 133.9 126.1 -5.8%
27 133.8 129.3 -3.4%
28 134.1 130.7 -2.5%
29 133.8 134.1 0.2%
30 133.9 128.3 -4.1%
31 133.8 130.1 -2.8%
32 133.9 124.7 -6.9%
33 133.6 135.6 1.5%
34 133.7 124.4 -7.0%
35 133.8 128.6 -3.9%
36 133.9 135.0 0.9%
37 133.8 134.0 0.1%
38 133.8 125.0 -6.6%
39 133.6 127.0 -5.0%
40 133.9 135.0 0.9%
41 134.5 124.3 -7.6%
42 134.4 125.4 -6.7%
43 134.5 118.0 -12.3%
44 133.8 135.0 0.9%
45 133.7 122.0 -8.8%
46 133.7 131.0 -2.0%
47 133.9 144.0 7.6%
11MANAGING FINANCIAL AND HUMAN RESOURCES
48 133.7 161.1 20.6%
49 122.9 155.0 26.1%
50 122.7 158.4 29.1%
51 125.1 143.0 14.3%
52 133.5 148.3 11.1%
YTD 133.1 133.9 0.5%
Identify the drivers of the performance and back it up
The main drivers for the performance are based on the factors such as condition of the
vehicles, capacity of fuel of the tanker and kilometres driven per litre of fuel. This will be able to
determine that main reasons for the variations in the planned and the actual variations in the
obtained data. It needs to be further understood that the driver of the operational performance is
directly relevant to the financial impacts. This is seen to be evident with higher variation in the
planned and the actual find will have more negative impact in increasing transportation costs.
The company needs to ensure operational efficacy in the fleet system so that it is able to
incorporate a sound financial plan (Li et al. 2016). Some of the various types of the other drivers
to the performance is for this factor needs to be seen with the additional routes which the
vehicles need to go through. In case the vehicles need to cover stoppages in distant location to
deliver good then there is a higher change of variations in the planned and the actual data
obtained. This will also significantly increase the financial burden of the company (Venkat et al.
2015).
Recommendations of the improvements based on theory discussed
The main recommendations to improve the selected KPI needs to be based on several
initiatives which will ensure improved maintenance of the vehicles to improve the operational
efficiency. Some of the basic initiates needs to be taken in form of checking the tire pressure at
least once a month. Under-inflated tires burn more fuel. The company needs to also ensure that
the vehicle is not idle for more than a minute during the journey. In addition to this, changing the
air filter at least the set number of times outlined in the owner’s manual will ensure that the
vehicle is able to sustain a better mileage even in dusty conditions. Having a regular engine
check-up needs to be made mandatory for all the vehciles in the fleet. Installing an onboard trip
computer will ensure "Instant fuel economy" setting. Watching this gauge, the company will be
⊘ This is a preview!⊘
Do you want full access?
Subscribe today to unlock all pages.
Trusted by 1+ million students worldwide
1 out of 19
Related Documents


Your All-in-One AI-Powered Toolkit for Academic Success.
+13062052269
info@desklib.com
Available 24*7 on WhatsApp / Email
![[object Object]](/_next/static/media/star-bottom.7253800d.svg)
Unlock your academic potential
Copyright © 2020–2026 A2Z Services. All Rights Reserved. Developed and managed by ZUCOL.