Operations Management Assignment - Manufacturing and Service
VerifiedAdded on 2022/11/29
|14
|5225
|463
Homework Assignment
AI Summary
This assignment delves into the application of operations management principles across both manufacturing and service sectors. It begins by examining the fundamental concept that all businesses involved in production, whether tangible or intangible, engage in operational activities. The assignment then explores the core functions of operations management, including planning, organizing, and supervising business processes to optimize efficiency and meet customer requirements. The analysis encompasses the transformation role of operations management in converting inputs into outputs and highlights the differences and similarities in its application between the manufacturing and service industries. Furthermore, the assignment includes practical applications of exponential smoothing techniques for forecasting and utilizes decision tree analysis to evaluate design options for a new product line, providing a comprehensive overview of key operations management concepts and their practical implications.
Application of Operations Management in Manufacturing Sector vis-à-vis Service Sector
Answer 1
Yes, I agree with the above statement that every business engaged in production activity of
producing goods whether tangible or intangible has operating activity.
Any production industry producing goods or any service industry providing services to
customers has operational activity wherein the process flow is determined by application of
operation management. For understanding this, we first need to understand the definition of
operation management. Operations Management is an area of management which involves
planning, organising and supervising the business processes undertaken in a business for
production of goods or services and make necessary changes or alterations in the process and
ensure that the business operations are efficiently functioning with limited use of resources as
needed for the process and effectively matching the requirements of the customers.
Operations Management is now a multidisciplinary functional area in the company along with
finance, supply chain, marketing and human resources for meeting the goals and achieving the
vision and mission of the organisation. The functioning of Operations management makes sure
that the inputs like material, labour and any other inputs used in the production of goods or
services are used in the most effective and efficient manner so that to maximise the output or
result of the organisation.
Operations Management plays the transformation role in the process of conversion of inputs
into finished goods or services. Like at a manufacturing plant, the transformation is the
physical change of raw materials into products such as transforming steel into automobiles,
clothes into shirts and many other conversions. Like at a service sector in airlines, the
transforming role encompasses the function of transporting passengers and their belongings
from one location to another. Nowadays, this transformation role of Operations management
makes it the “engine” of the organisation.
Further, it can be seen that every business engaged in producing goods has a process flow
starting form procurement of raw materials to ultimate delivery of finished goods to ultimate
customers. Further, under tertiary sector there is operations involved in the way the services
will be delivered. For instance, the method of scheduling of flights and other ancillary
activities.
Thus, it can be stated that every business engaged in production activity of producing goods
whether tangible or intangible has operating activity.
Answer 2
Introduction
Operations Management is an area of management which involves planning, organising and
supervising the business processes undertaken in a business for production of goods or services
and make necessary changes or alterations in the process and ensure that the business
operations are efficiently functioning with limited use of resources as needed for the process
and effectively matching the requirements of the customers.
Paraphrase This Document
Need a fresh take? Get an instant paraphrase of this document with our AI Paraphraser
Operations Management is now a multidisciplinary functional area in the company along with
finance, supply chain, marketing and human resources for meeting the goals and achieving the
vision and mission of the organisation. The functioning of Operations management makes sure
that the inputs like material, labour and any other inputs used in the production of goods or
services are used in the most effective and efficient manner so that to maximise the output or
result of the organisation.
Operations Management plays the transformation role in the process of conversion of inputs
into finished goods or services. Like at a manufacturing plant, the transformation is the
physical change of raw materials into products such as transforming steel into automobiles,
clothes into shirts and many other conversions. Like at a service sector in airlines, the
transforming role encompasses the function of transporting passengers and their belongings
from one location to another. Nowadays, this transformation role of Operations management
makes it the “engine” of the organisation.
Operations Management in Manufacturing Industry
Nowadays, all manufacturers set out to perform the function to transform resources into the
finished goods with more operational efficiency and effectiveness. The process involves
various step by step processes which includes Planning of the production process and how the
facilities for manufacturing will be laid out, Controlling the production process by monitoring
and follow-up with the processes and responding to the feedback and making necessary
adjustments in the processes where possible for efficient functioning and Controlling the
quality of the goods produced and monitoring whether the same adheres to the requirement of
the customers.
Operations Management in Service Industry
Operation Management has a deep impact in the service industry with every now and then
techniques of operation management are applied to smoothen the business process and flow of
services. For instance, in aviation industry, operation management find its application on
procurement of aviation fuel, scheduling of flights, passenger seating arrangement etc. Thus,
operation management finds a core position in the heart of planning cost and increasing profit
of company. Let take another example of call centre wherein the wait time of a client is
managed through operation management in a manner that total wait time for a caller is reduced
to minimum and quality of service to consumer increases to maximum. Further, operation
management in service industry finds its hand in planning of service, execution of service and
delivering of service. Thus, in short it can be seen that service industry is deeply driven by
operation management where in the entire flow of activity is channelized through management
of operation and tools of operation management.
Differences in manufacturing v/s Service Operations
In the present generation, we don’t find much difference in the application of operation
management tools in service vis a vis manufacturing sector. Under both the sectors i.e.
secondary and tertiary sectors, operation management helps in controlling cost, maximising
revenue and as an outcome increasing profits of the company. The two major difference that
has been identified in the manufacturing vis a vis service sector has been detailed here-in-
below:
(a) Under manufacturing industry, there is standardisation of products wherein similar goods
are produced in a lot through machinery while under the service sector there is
customisation of services delivered every time as there is involvement of human being to a
large extent who cannot emulate to 100% the last delivered service (Operations
Management in Manufacturing and Service Industries, 2019). In the manufacturing
industry, products are produced in bulk with machines with a standardised parameter set.
For instance, production of biscuits in a factory with similar ingredient and in bulk while
on the other hand delivering of service by a beautician or by a hair dresser cannot be
standardised, there shall always be an element of customisation involved in the same;
(CSCMP and Nada Senders, 2019)
(b) The second major difference identified between the manufacturing and service sector is the
focus element under both the industry. In the manufacturing operation, the focus is on the
manufacturing layout while on the other hand service sector has focus on the environment
to focus on the customers. For instance, under the production operations manufacturing
layout focus can be on fixed, process focussed or on product focussed (Manufacturing
versus Service Operations, 2019). While for service sector the focus is generally how the
ambience shall be for the customers. Thus, dimension of service management shall
generally focus on layout of furnishings, arrangement of signs and tangible cues, such as
colors and sounds designed to enhance the customer experience (Schieltz, 2019)
Answer 3 part A
For answering the question 3 part A, one needs to first understand the smoothing factor.
Exponential smoothing is a rule of thumb technique used for the purpose of smoothing the data
of time series and uses the function of exponential window. This technique uses exponential
function instead of simple moving average or weighted moving average for the purpose of
predicting the future variable based on achieved result in the past. Under this method, the
weights decrease over time as compared to average which has equal weight over the time
series.
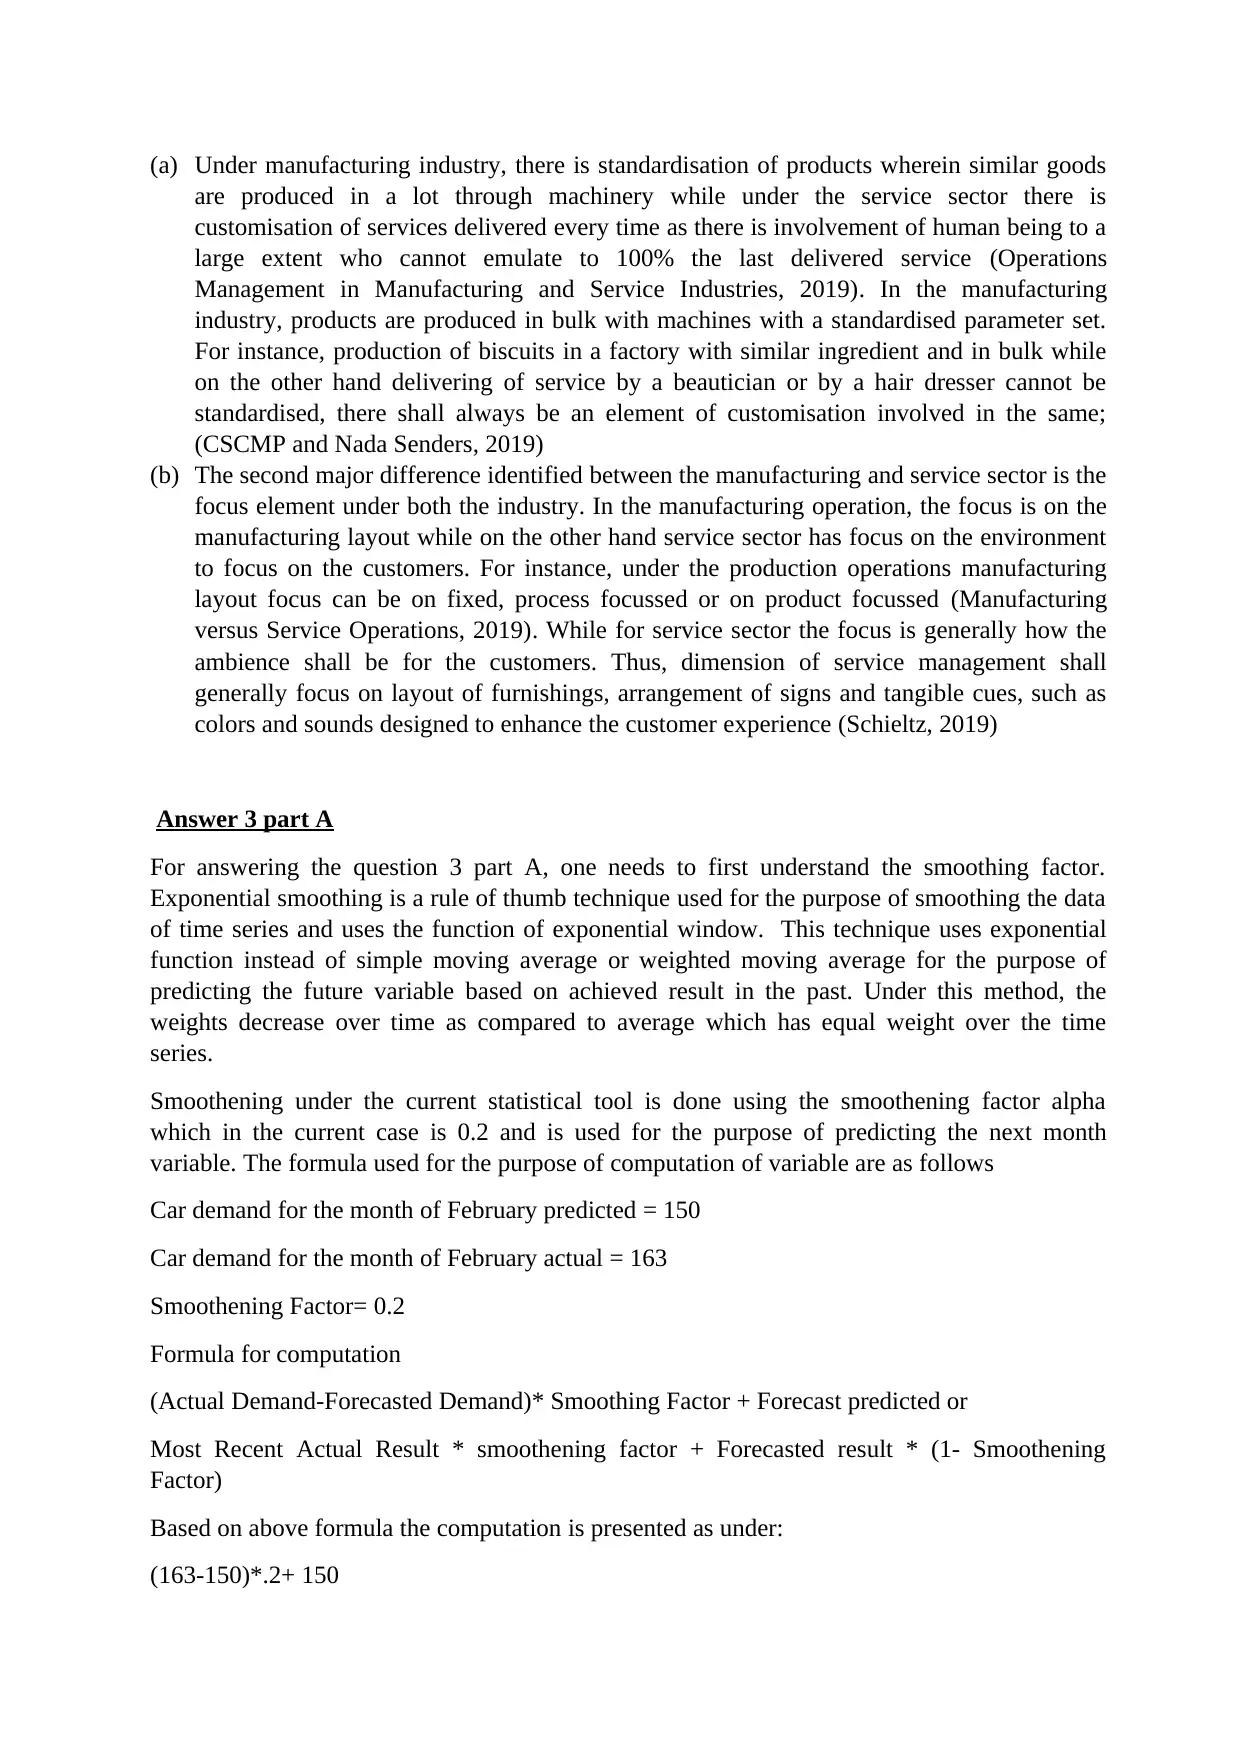
Smoothening under the current statistical tool is done using the smoothening factor alpha
which in the current case is 0.2 and is used for the purpose of predicting the next month
variable. The formula used for the purpose of computation of variable are as follows
Car demand for the month of February predicted = 150
Car demand for the month of February actual = 163
Smoothening Factor= 0.2
Formula for computation
(Actual Demand-Forecasted Demand)* Smoothing Factor + Forecast predicted or
Most Recent Actual Result * smoothening factor + Forecasted result * (1- Smoothening
Factor)
Based on above formula the computation is presented as under:
(163-150)*.2+ 150
are produced in a lot through machinery while under the service sector there is
customisation of services delivered every time as there is involvement of human being to a
large extent who cannot emulate to 100% the last delivered service (Operations
Management in Manufacturing and Service Industries, 2019). In the manufacturing
industry, products are produced in bulk with machines with a standardised parameter set.
For instance, production of biscuits in a factory with similar ingredient and in bulk while
on the other hand delivering of service by a beautician or by a hair dresser cannot be
standardised, there shall always be an element of customisation involved in the same;
(CSCMP and Nada Senders, 2019)
(b) The second major difference identified between the manufacturing and service sector is the
focus element under both the industry. In the manufacturing operation, the focus is on the
manufacturing layout while on the other hand service sector has focus on the environment
to focus on the customers. For instance, under the production operations manufacturing
layout focus can be on fixed, process focussed or on product focussed (Manufacturing
versus Service Operations, 2019). While for service sector the focus is generally how the
ambience shall be for the customers. Thus, dimension of service management shall
generally focus on layout of furnishings, arrangement of signs and tangible cues, such as
colors and sounds designed to enhance the customer experience (Schieltz, 2019)
Answer 3 part A
For answering the question 3 part A, one needs to first understand the smoothing factor.
Exponential smoothing is a rule of thumb technique used for the purpose of smoothing the data
of time series and uses the function of exponential window. This technique uses exponential
function instead of simple moving average or weighted moving average for the purpose of
predicting the future variable based on achieved result in the past. Under this method, the
weights decrease over time as compared to average which has equal weight over the time
series.
Smoothening under the current statistical tool is done using the smoothening factor alpha
which in the current case is 0.2 and is used for the purpose of predicting the next month
variable. The formula used for the purpose of computation of variable are as follows
Car demand for the month of February predicted = 150
Car demand for the month of February actual = 163
Smoothening Factor= 0.2
Formula for computation
(Actual Demand-Forecasted Demand)* Smoothing Factor + Forecast predicted or
Most Recent Actual Result * smoothening factor + Forecasted result * (1- Smoothening
Factor)
Based on above formula the computation is presented as under:
(163-150)*.2+ 150
⊘ This is a preview!⊘
Do you want full access?
Subscribe today to unlock all pages.
Trusted by 1+ million students worldwide
152.6 or 153
Answer 3 part B
For answering the question 3 part B, one needs to first understand the smoothing factor.
Exponential smoothing is a rule of thumb technique used for the purpose of smoothing the data
of time series and uses the function of exponential window. This technique uses exponential
function instead of simple moving average or weighted moving average for the purpose of
predicting the future variable based on achieved result in the past. Under this method, the
weights decrease over time as compared to average which has equal weight over the time
series.
Smoothening under the current statistical tool is done using the smoothening factor alpha
which in the current case is 0.3 and is used for the purpose of predicting the next month
variable. (Piaseck, 2019)The formula used for the purpose of computation of variable are as
follows
Car demand for the month of February predicted = 150
Car demand for the month of February actual = 163
Smoothening Factor= 0.3
Formula for computation
(Actual Demand-Forecasted Demand)* Smoothing Factor + Forecast predicted or
Most Recent Actual Result * smoothening factor + Forecasted result * (1- Smoothening
Factor)
Based on above formula the computation is presented as under:
(163-150)*.3+ 150
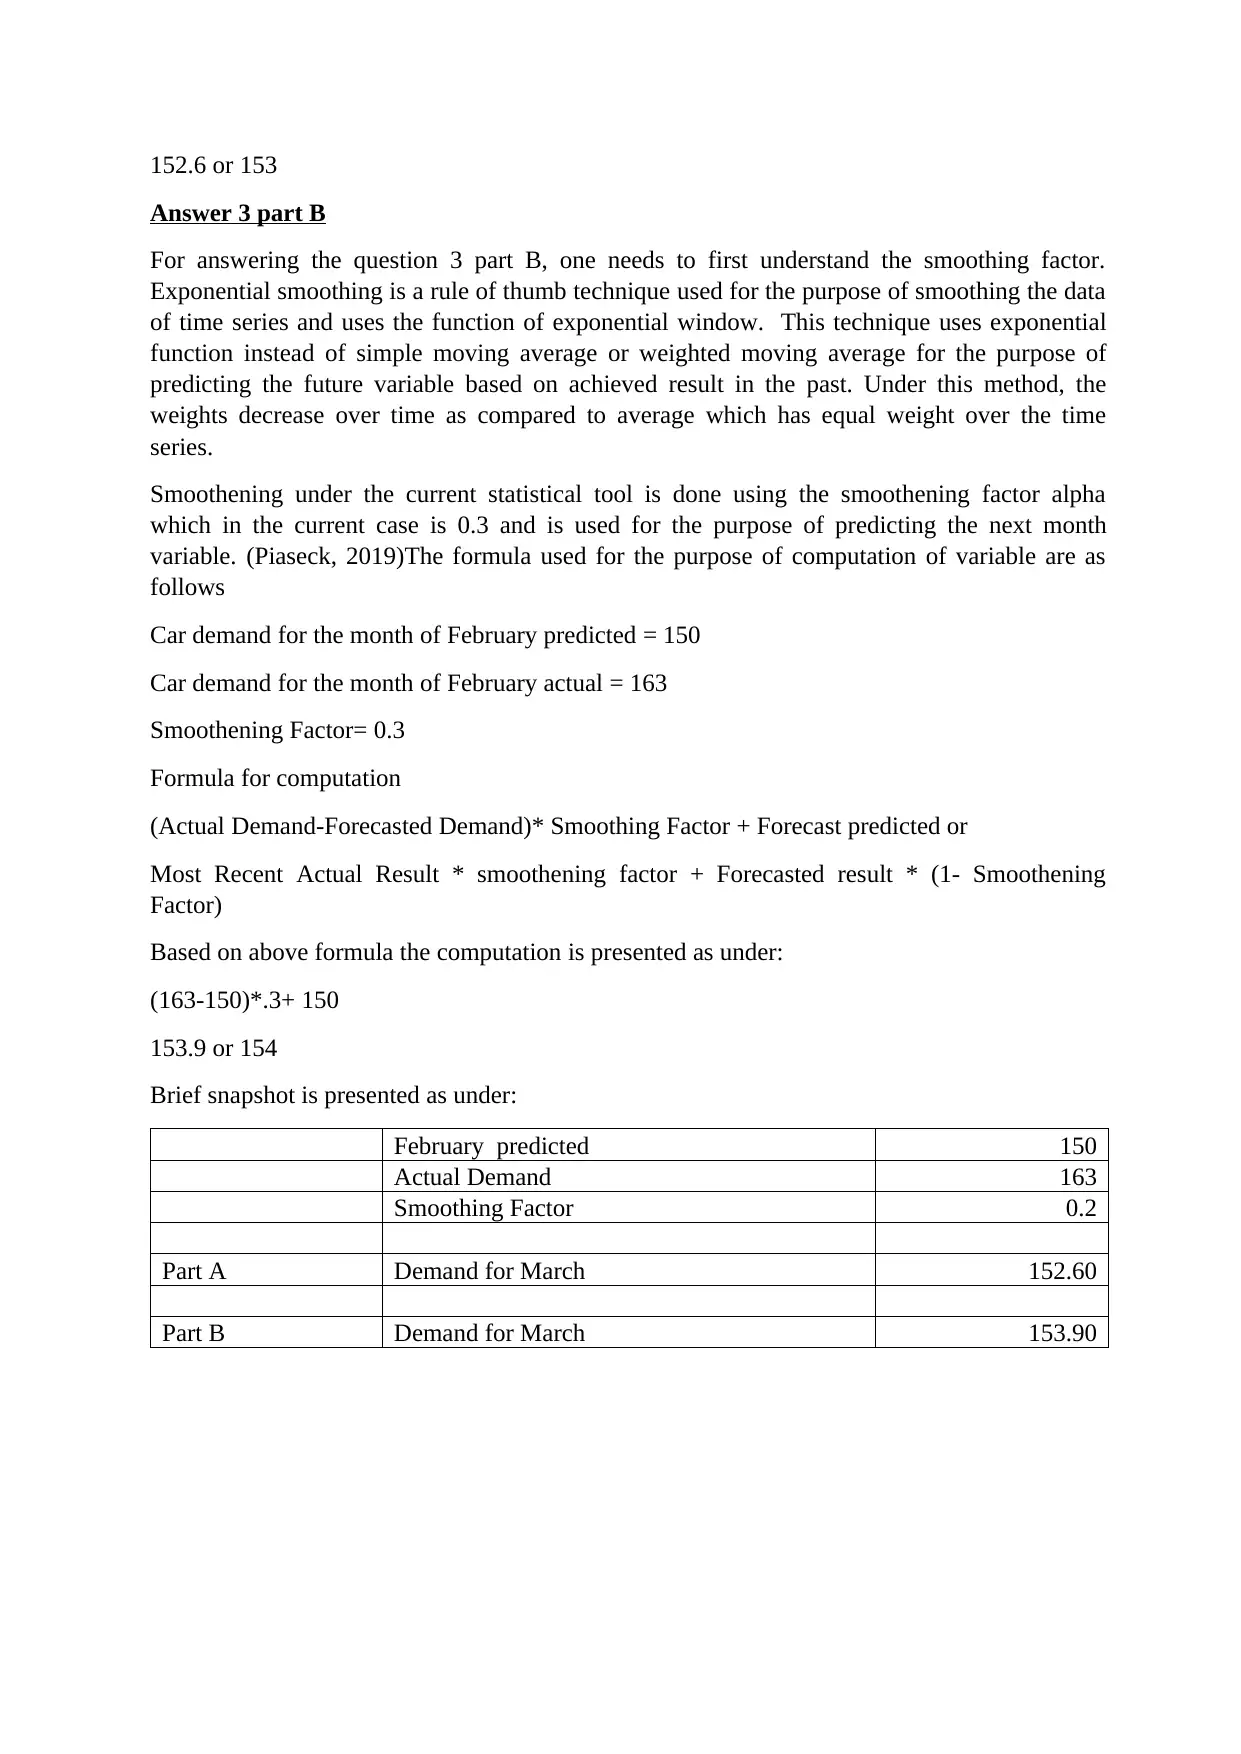
153.9 or 154
Brief snapshot is presented as under:
February predicted 150
Actual Demand 163
Smoothing Factor 0.2
Part A Demand for March 152.60
Part B Demand for March 153.90
Answer 3 part B
For answering the question 3 part B, one needs to first understand the smoothing factor.
Exponential smoothing is a rule of thumb technique used for the purpose of smoothing the data
of time series and uses the function of exponential window. This technique uses exponential
function instead of simple moving average or weighted moving average for the purpose of
predicting the future variable based on achieved result in the past. Under this method, the
weights decrease over time as compared to average which has equal weight over the time
series.
Smoothening under the current statistical tool is done using the smoothening factor alpha
which in the current case is 0.3 and is used for the purpose of predicting the next month
variable. (Piaseck, 2019)The formula used for the purpose of computation of variable are as
follows
Car demand for the month of February predicted = 150
Car demand for the month of February actual = 163
Smoothening Factor= 0.3
Formula for computation
(Actual Demand-Forecasted Demand)* Smoothing Factor + Forecast predicted or
Most Recent Actual Result * smoothening factor + Forecasted result * (1- Smoothening
Factor)
Based on above formula the computation is presented as under:
(163-150)*.3+ 150
153.9 or 154
Brief snapshot is presented as under:
February predicted 150
Actual Demand 163
Smoothing Factor 0.2
Part A Demand for March 152.60
Part B Demand for March 153.90
Paraphrase This Document
Need a fresh take? Get an instant paraphrase of this document with our AI Paraphraser
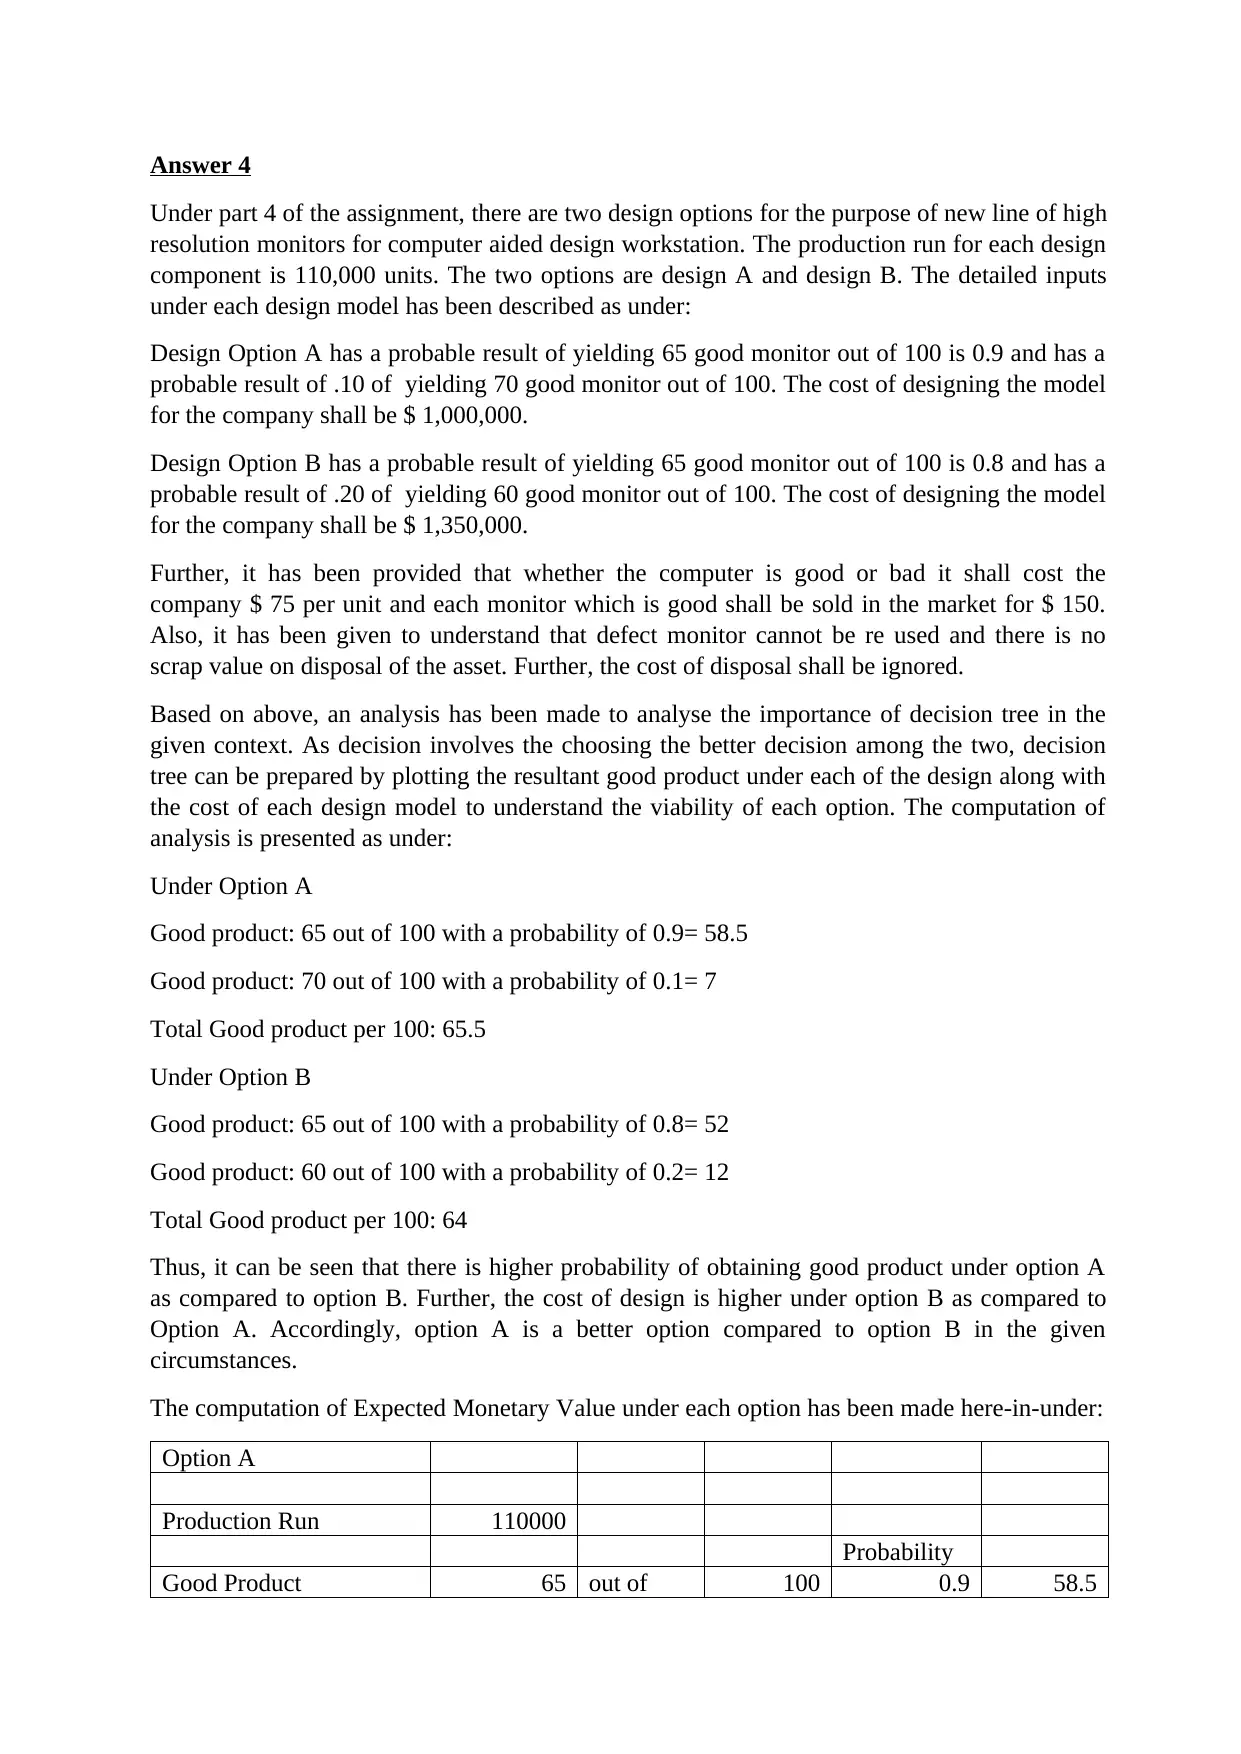
Answer 4
Under part 4 of the assignment, there are two design options for the purpose of new line of high
resolution monitors for computer aided design workstation. The production run for each design
component is 110,000 units. The two options are design A and design B. The detailed inputs
under each design model has been described as under:
Design Option A has a probable result of yielding 65 good monitor out of 100 is 0.9 and has a
probable result of .10 of yielding 70 good monitor out of 100. The cost of designing the model
for the company shall be $ 1,000,000.
Design Option B has a probable result of yielding 65 good monitor out of 100 is 0.8 and has a
probable result of .20 of yielding 60 good monitor out of 100. The cost of designing the model
for the company shall be $ 1,350,000.
Further, it has been provided that whether the computer is good or bad it shall cost the
company $ 75 per unit and each monitor which is good shall be sold in the market for $ 150.
Also, it has been given to understand that defect monitor cannot be re used and there is no
scrap value on disposal of the asset. Further, the cost of disposal shall be ignored.
Based on above, an analysis has been made to analyse the importance of decision tree in the
given context. As decision involves the choosing the better decision among the two, decision
tree can be prepared by plotting the resultant good product under each of the design along with
the cost of each design model to understand the viability of each option. The computation of
analysis is presented as under:
Under Option A
Good product: 65 out of 100 with a probability of 0.9= 58.5
Good product: 70 out of 100 with a probability of 0.1= 7
Total Good product per 100: 65.5
Under Option B
Good product: 65 out of 100 with a probability of 0.8= 52
Good product: 60 out of 100 with a probability of 0.2= 12
Total Good product per 100: 64
Thus, it can be seen that there is higher probability of obtaining good product under option A
as compared to option B. Further, the cost of design is higher under option B as compared to
Option A. Accordingly, option A is a better option compared to option B in the given
circumstances.
The computation of Expected Monetary Value under each option has been made here-in-under:
Option A
Production Run 110000
Probability
Good Product 65 out of 100 0.9 58.5
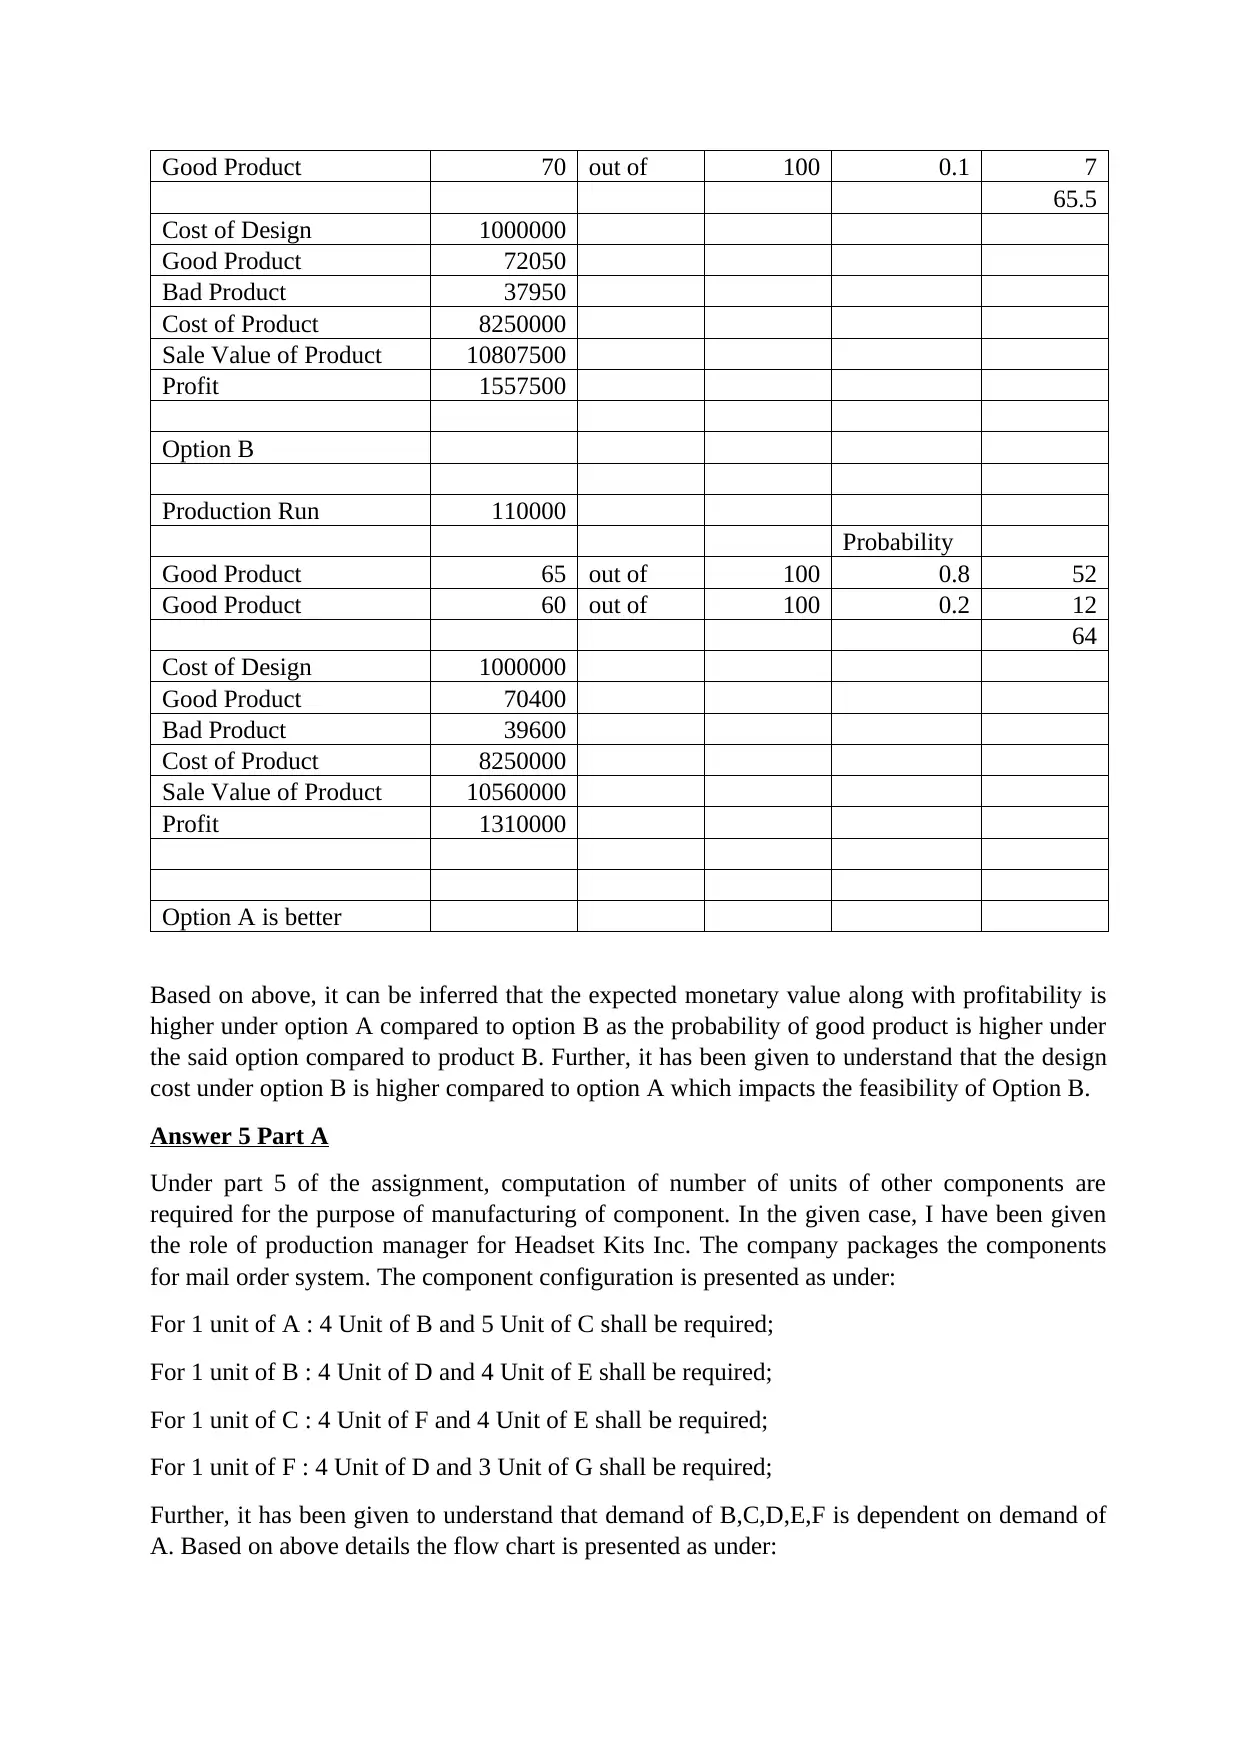
Good Product 70 out of 100 0.1 7
65.5
Cost of Design 1000000
Good Product 72050
Bad Product 37950
Cost of Product 8250000
Sale Value of Product 10807500
Profit 1557500
Option B
Production Run 110000
Probability
Good Product 65 out of 100 0.8 52
Good Product 60 out of 100 0.2 12
64
Cost of Design 1000000
Good Product 70400
Bad Product 39600
Cost of Product 8250000
Sale Value of Product 10560000
Profit 1310000
Option A is better
Based on above, it can be inferred that the expected monetary value along with profitability is
higher under option A compared to option B as the probability of good product is higher under
the said option compared to product B. Further, it has been given to understand that the design
cost under option B is higher compared to option A which impacts the feasibility of Option B.
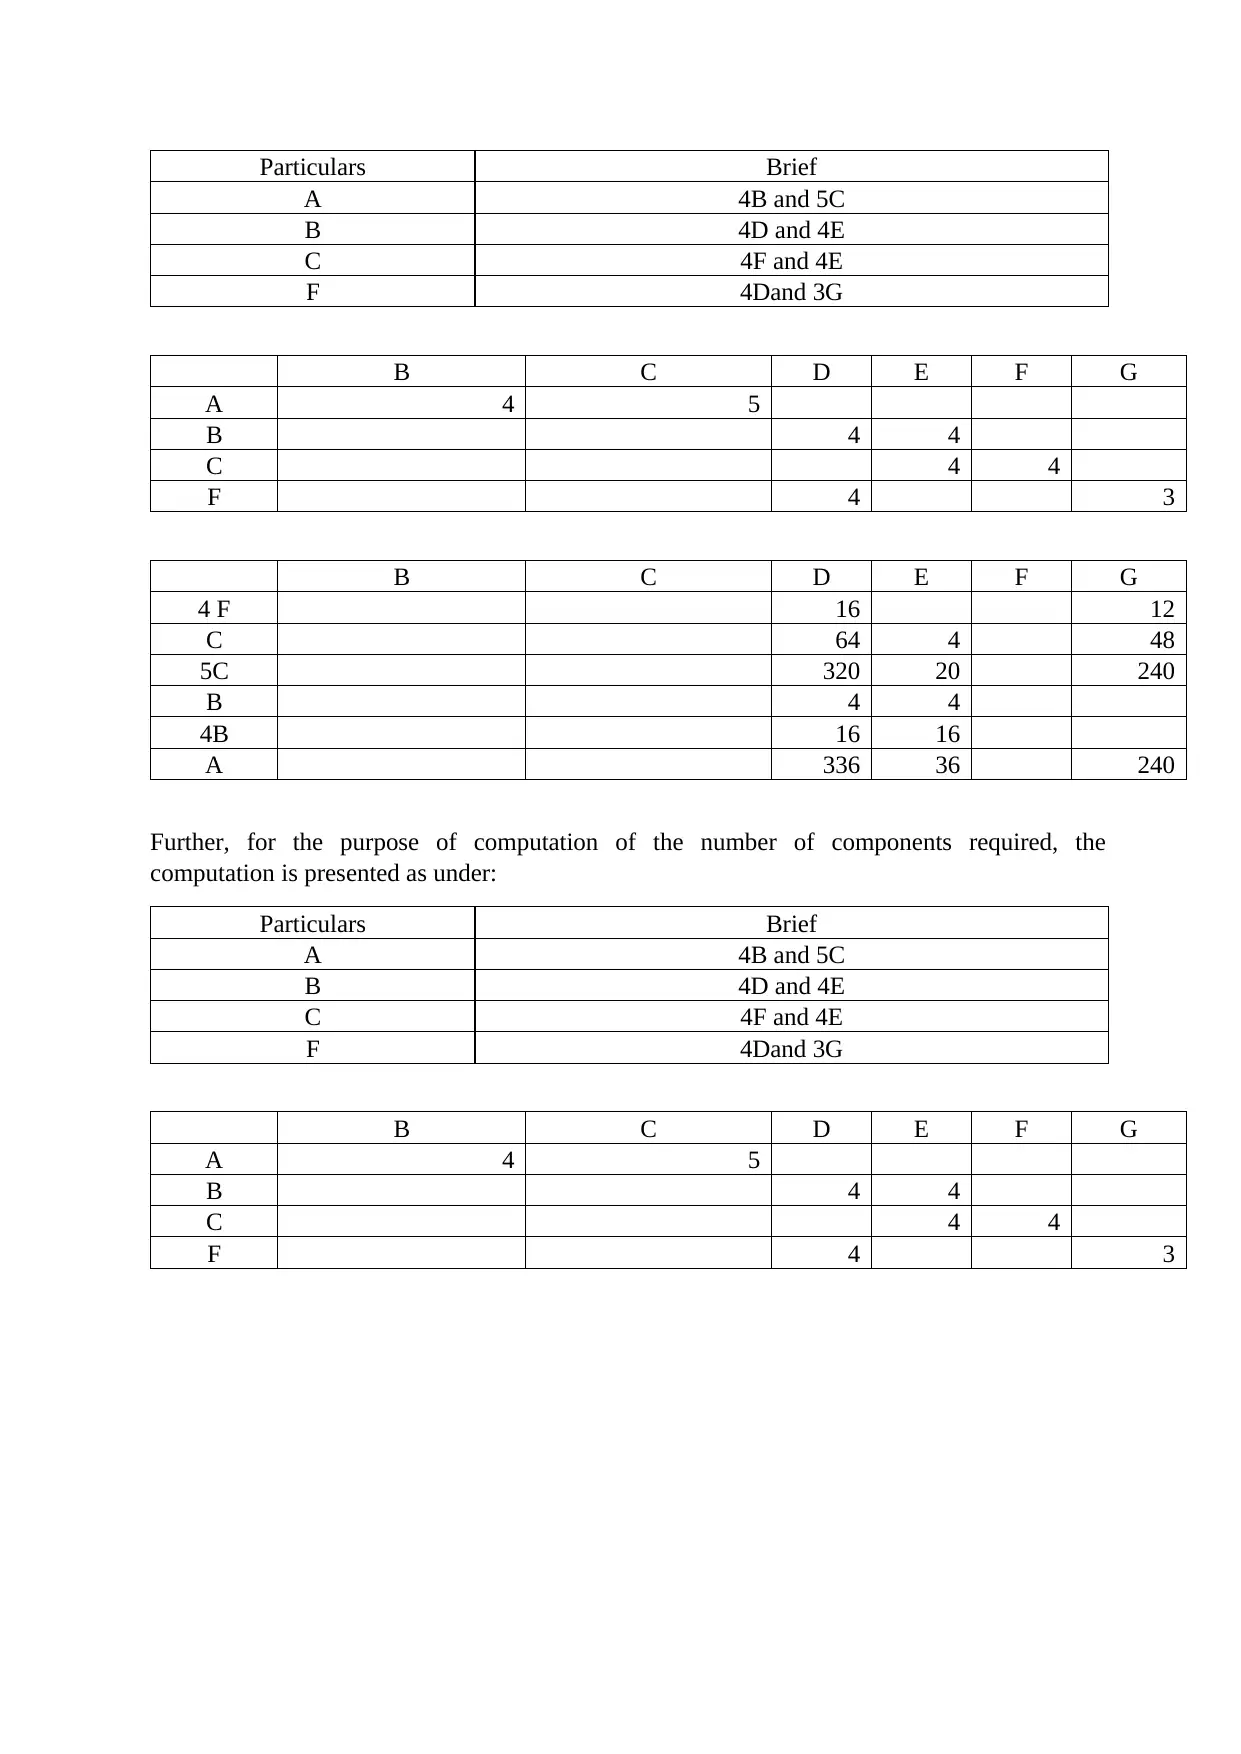
Answer 5 Part A
Under part 5 of the assignment, computation of number of units of other components are
required for the purpose of manufacturing of component. In the given case, I have been given
the role of production manager for Headset Kits Inc. The company packages the components
for mail order system. The component configuration is presented as under:
For 1 unit of A : 4 Unit of B and 5 Unit of C shall be required;
For 1 unit of B : 4 Unit of D and 4 Unit of E shall be required;
For 1 unit of C : 4 Unit of F and 4 Unit of E shall be required;
For 1 unit of F : 4 Unit of D and 3 Unit of G shall be required;
Further, it has been given to understand that demand of B,C,D,E,F is dependent on demand of
A. Based on above details the flow chart is presented as under:
65.5
Cost of Design 1000000
Good Product 72050
Bad Product 37950
Cost of Product 8250000
Sale Value of Product 10807500
Profit 1557500
Option B
Production Run 110000
Probability
Good Product 65 out of 100 0.8 52
Good Product 60 out of 100 0.2 12
64
Cost of Design 1000000
Good Product 70400
Bad Product 39600
Cost of Product 8250000
Sale Value of Product 10560000
Profit 1310000
Option A is better
Based on above, it can be inferred that the expected monetary value along with profitability is
higher under option A compared to option B as the probability of good product is higher under
the said option compared to product B. Further, it has been given to understand that the design
cost under option B is higher compared to option A which impacts the feasibility of Option B.
Answer 5 Part A
Under part 5 of the assignment, computation of number of units of other components are
required for the purpose of manufacturing of component. In the given case, I have been given
the role of production manager for Headset Kits Inc. The company packages the components
for mail order system. The component configuration is presented as under:
For 1 unit of A : 4 Unit of B and 5 Unit of C shall be required;
For 1 unit of B : 4 Unit of D and 4 Unit of E shall be required;
For 1 unit of C : 4 Unit of F and 4 Unit of E shall be required;
For 1 unit of F : 4 Unit of D and 3 Unit of G shall be required;
Further, it has been given to understand that demand of B,C,D,E,F is dependent on demand of
A. Based on above details the flow chart is presented as under:
⊘ This is a preview!⊘
Do you want full access?
Subscribe today to unlock all pages.
Trusted by 1+ million students worldwide
Particulars Brief
A 4B and 5C
B 4D and 4E
C 4F and 4E
F 4Dand 3G
B C D E F G
A 4 5
B 4 4
C 4 4
F 4 3
B C D E F G
4 F 16 12
C 64 4 48
5C 320 20 240
B 4 4
4B 16 16
A 336 36 240
Further, for the purpose of computation of the number of components required, the
computation is presented as under:
Particulars Brief
A 4B and 5C
B 4D and 4E
C 4F and 4E
F 4Dand 3G
B C D E F G
A 4 5
B 4 4
C 4 4
F 4 3
A 4B and 5C
B 4D and 4E
C 4F and 4E
F 4Dand 3G
B C D E F G
A 4 5
B 4 4
C 4 4
F 4 3
B C D E F G
4 F 16 12
C 64 4 48
5C 320 20 240
B 4 4
4B 16 16
A 336 36 240
Further, for the purpose of computation of the number of components required, the
computation is presented as under:
Particulars Brief
A 4B and 5C
B 4D and 4E
C 4F and 4E
F 4Dand 3G
B C D E F G
A 4 5
B 4 4
C 4 4
F 4 3
Paraphrase This Document
Need a fresh take? Get an instant paraphrase of this document with our AI Paraphraser
B C D E F G
4 F 16 12
C 64 4 48
5C 320 20 240
B 4 4
4B 16 16
A 336 36 240
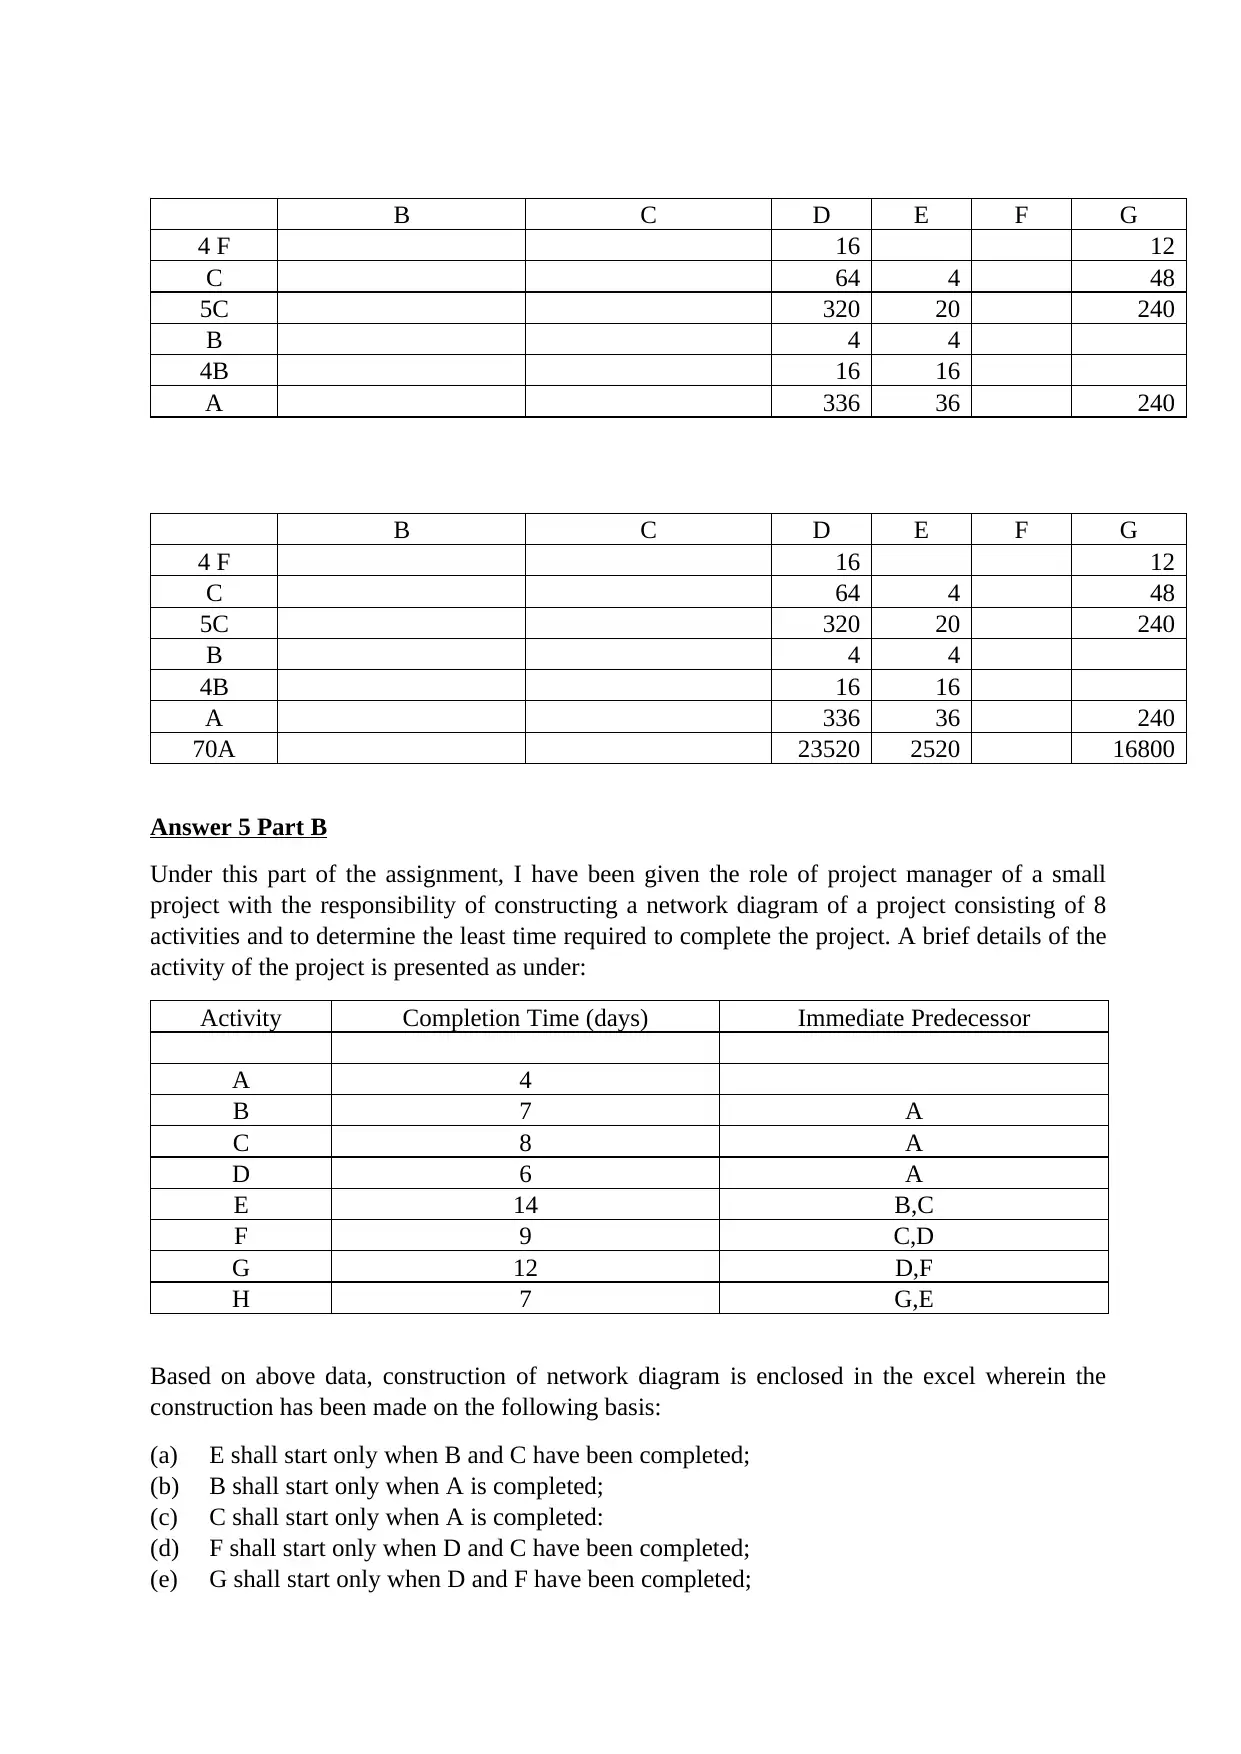
B C D E F G
4 F 16 12
C 64 4 48
5C 320 20 240
B 4 4
4B 16 16
A 336 36 240
70A 23520 2520 16800
Answer 5 Part B
Under this part of the assignment, I have been given the role of project manager of a small
project with the responsibility of constructing a network diagram of a project consisting of 8
activities and to determine the least time required to complete the project. A brief details of the
activity of the project is presented as under:
Activity Completion Time (days) Immediate Predecessor
A 4
B 7 A
C 8 A
D 6 A
E 14 B,C
F 9 C,D
G 12 D,F
H 7 G,E
Based on above data, construction of network diagram is enclosed in the excel wherein the
construction has been made on the following basis:
(a) E shall start only when B and C have been completed;
(b) B shall start only when A is completed;
(c) C shall start only when A is completed:
(d) F shall start only when D and C have been completed;
(e) G shall start only when D and F have been completed;
4 F 16 12
C 64 4 48
5C 320 20 240
B 4 4
4B 16 16
A 336 36 240
B C D E F G
4 F 16 12
C 64 4 48
5C 320 20 240
B 4 4
4B 16 16
A 336 36 240
70A 23520 2520 16800
Answer 5 Part B
Under this part of the assignment, I have been given the role of project manager of a small
project with the responsibility of constructing a network diagram of a project consisting of 8
activities and to determine the least time required to complete the project. A brief details of the
activity of the project is presented as under:
Activity Completion Time (days) Immediate Predecessor
A 4
B 7 A
C 8 A
D 6 A
E 14 B,C
F 9 C,D
G 12 D,F
H 7 G,E
Based on above data, construction of network diagram is enclosed in the excel wherein the
construction has been made on the following basis:
(a) E shall start only when B and C have been completed;
(b) B shall start only when A is completed;
(c) C shall start only when A is completed:
(d) F shall start only when D and C have been completed;
(e) G shall start only when D and F have been completed;
(f) H shall start only when G and E have been completed.
Based on above analysis, the critical path method for the above diagram have been identified as
under:
A-B-E-H= 32 days;
A-C-F-G-H= 40 days;
A-C-E-H= 33 days;
A-D-F-G-H= 38 days;
A-D-G-H= 29 days.
Based on above it has been identified that critical path method for the current network diagram
shall be 40 days with the following path A, C, F , G, H.
Answer 6
Total Quality Management (TQM) may be defined as a structured approach through which a
management aims to continuously improve, reduce and detect any errors under the
manufacturing process, streamlining of supply chain, experience improvement of customers or
to ensure that employees of the organisation are in a speed which is alignment with the speed
of training. Under this system of quality management all the parties are held accountable for
the purpose of maintaining the quality of the final product or service in the production chain.
The concept was developed by William Deming, a management consultant whose work in the
field of management had left an indelible imprint in the Japanese manufacturing industry.
Though, Total Quality Management approaches are similar to Six Sigma but in overall it is
different from six sigma. Further, Total Quality Management guidelines works on both internal
guidelines as well as guidelines stated by the industry.
Further, TQM is a customer focussed process which aims for continuous improvement of the
business process. It strives to achieve a common goal for all the employees associated with a
production process, supply chain etc. The aim is to provide better product/ service to ultimate
customer.
On the other hand, Just in time is an inventory management technique that is based on an
objective to ensure supply the raw material as and when required without any production
schedules of delivery from supplier. This type of management of inventory helps an
organisation to reduce the cost of wastage and improve efficiency of utilisation of raw
materials. Further, under the said mechanism of inventory management cost of holding is
inventory is minimum as there is no cost for holding the inventory. However, there might be
cost of ordering of inventory which can have bearing on the total cost of inventory. The Just in
Time system of inventory management has several advantages over traditional method of
inventory management. Further, under this system of inventory management production run is
short implying that producer of good can move from one product to another product quickly.
The leading usage of Just-in-time concept has been felt in the field of car manufacturing
wherein the manufacturer operates with a lower level of inventory but it heavily dependent on
its supply chain for quick delivery of its product to build the car as and when required or on a
need basis. Accordingly, for a Just in time concept to succeed the company is required to have
⊘ This is a preview!⊘
Do you want full access?
Subscribe today to unlock all pages.
Trusted by 1+ million students worldwide
steady production, high quality workmanship, plant and machinery which are glitch free and
suppliers are reliable. This is very difficult to be found in any company as on date. (Research
Gate , 2019)
A recent report published by MDPI of the impact of Total Quality Management and Just in
Time production practices on improvement of process has been duly affirmed. (TQM and JIT,
2019)
Also, let us analyse the real life examples of improvement achieved by companies on
application of Total Quality Management techniques in the production process is the example
of Toyota one of the leading world car manufacturer. The company follows the total quality
management techniques which has help the company to develop flawless products and capture
a large segment of customers from the market. The products of the company have a very high
resale value. (ResearchGate 2019., 2019)
Another example could be of Tesco, UK retail industry supermarket chain has also adopted the
total quality management techniques to improve the business process and provision of maintain
highest quality services for their customer was their top priority. The term quality was used as
strategic weapon by the company to deliver quality and promising services to their end
customers. The product offered them competitive advantage in the market. The consumers
were highly pleased with the service of the company further the company was able to achieve a
position where the company was able to influence its cost and achieve internal effectiveness of
production.
Tesco started as super market chain in 1920 and has seen a very strong growth on the basis of
its ideology of Total Quality Management and striving to maintain quality in its production
process along with in deliverables to customers. The company had a dedicated human resource
management system for maintaining the quality of service. (WriteMyPapers.org , 2019)
The successful example of Just in Time inventory system of management can be witnessed in
companies like Toyota, Dell, Harley Davidson etc. This system of lean manufacturing has
created a deep impact in the inventory management system of these companies and have
helped the companies to improve their production process drastically. Toyota has always been
considered as a poster child for the success of concept of Just in Time and under Toyota
inventory management system raw materials are not bought to floor until an order has been
received and the product is ready for manufacturing process. Further, no product were ready at
any node unless they are required at the next node. Thus, this mechanism of maintaining lower
inventory at each node of the production process to reduce the cost of inventory holding to
minimum. Further, this system of inventory management has helped Toyota to quickly to adapt
to any change in demand without having any worry regarding disposing of expensive
inventory.
Another example could be of Dell, a leading manufacturer globally. The method of JIT applied
by Dell is a bit different. Dell has leveraged their suppliers to achieve the goal of JIT. Under
this method, Dell has ask their supplier to maintain the inventory on their behalf instead of
them. The said system of management led to shorter lead time of obtaining inventory for Dell.
The shorter lead time allowed Dell to quickly assemble and deliver product to their customer
helping them to achieve a strong customer base along with a wide market. The critical factor to
Paraphrase This Document
Need a fresh take? Get an instant paraphrase of this document with our AI Paraphraser
Dell success has been reliable suppliers, short lead time coupled with seamless system and the
strong contract with the supplier whereby they maintained inventory.
https://www.brighthubpm.com/methods-strategies/71540-real-life-examples-of-successful-jit-
systems/
Thus, seeing the above successful cases we can reach a conclusion that JIT and TQM has a
deep impact on the success of many business by innovating business process, focussing on
quality, quick inventory management and reducing errors along with improvement of internal
effectiveness.
Answer 7
Under the last question of the assignment, research on recent approach of management Industry
4.0 is required to deal with the changes in the global market primarily due to market
uncertainty, international competition and highly demand on product and services.
Industry 4.0 may be interpreted as a subset of the 4th industrial revolution. Under the fourth
category of industrial revolution, areas are not classified as industry rather classification is
made on the basis of cities. Under this revolution, the machines are automated with wireless
connectivity and sensors. Further, the process of production are linked to a computer system
which has Artificial Intelligence to take decision of its own. Thus, the entire production process
shall be managed by a computer system with minimal to no human intervention. Thus, this new
revolution aims at automation of production and manufacturing process and enables data
exchange between systems which includes Internet of Things, Cyber Physical Systems and
industrial Internet of Things. Other techniques encompass cloud computing, cognitive
computing and artificial intelligence. Thus, under these technology factory shall be seen as
smart factory and the impact of such change in the manufacturing process shall further
standardise the process and shall remove the impact of emotions in the decision making.
The impact of industry 4.0 on the supply chain management and inventory management has
been detailed as under:
Industry 4.0 fast transformation into the manufacturing process of companies have left no stone
untouched. There has been a drastic improvement in the supply chain from industry 4.0 as the
supply chain process has gone digital which has aided the supply chain. Further, various
research by scholars have suggested that supply chain under 4.0 has help the supply chain to
lower the cost of operation by more than 30 per cent. Further, there has been drastic reduction
in the lost sales opportunities by 60 percent by adopting the change and even there has been
research stating that there has been 70% reduction in inventory on account of digitalisation of
supply chain process. This change has made the companies quick, agile, granular, improved
efficiency and has made them accurate.
The above process required huge investment on the part of the company with a fully inter
connected supply chain. Further, the expected pay off from such huge investment shall be high
in the long term as technology is the next future. The key benefits in the supply chain on
account of industry 4.0 is as under:
(a) Greater increase in accuracy and transparency of business: The advent of industry 4.0 has
enable companies to maintain track of entire supply chain process digitally thereby
reducing chances of disruption, lost sales and unnecessary cost on the part of the company.
The tracking of process in real time can help the company to ensure transparency and
accuracy. Further, Advanced solutions easily track inventory by combing updates from
supply chain partners with IoT data. This improves order accuracy and ETAs (minimizing
out-of-stock situations), enhances lot and batch control, optimizes inventory, and lowers
associated costs;
(b) Decision Making Based on data which shall help in cost savings of the company:
Advanced digital technology and artificial intelligence can help to predict the future sales
of the company with a greater accuracy as a series of algorithms can predict future market.
This step shall help the company to estimate the amount of inventory beforehand, thereby
reducing the cost of inventory holding and avoiding any undue cost on account of lost
sales of the company;
(c) Increased collaboration and interconnectedness: A full integrated supply chain and digital
shall help to flow the information among different members of supply chain starting from
manufacturer to ultimate customer. This flow of information shall improve the level of
communication among different intermediaries and reduce any bottleneck or silos among
them. Further, Stakeholders can choose to carry out supply chain-related activities together
to not only save costs, but to share best practices and learn from each other.
(d) Improved Warehouse Management: Digitalisation of process can help the companies to
improve warehouse management capability of the company. This improvement can be
highly seen in the area of supply chain inventory and transportation logistics. For instance,
usage of sensor for the purpose of tracking the goods in real time is an ideal way of
tracking the goods; ( GEP , 2019)
(e) Intelligent Supply Chain: Supply chain can learn by itself to mitigate any risk in the
process. The process shall continuously improve and innovate, thereby further improve the
process and reduce cost in the process;
(f) Greater Agility in the business chain.
Conclusion
The above report presents a view on operational management, various techniques of
operational management and how recent technologies have a drastic improvement in the supply
chain process.
⊘ This is a preview!⊘
Do you want full access?
Subscribe today to unlock all pages.
Trusted by 1+ million students worldwide
1 out of 14
Related Documents


Your All-in-One AI-Powered Toolkit for Academic Success.
+13062052269
info@desklib.com
Available 24*7 on WhatsApp / Email
![[object Object]](/_next/static/media/star-bottom.7253800d.svg)
Unlock your academic potential
Copyright © 2020–2026 A2Z Services. All Rights Reserved. Developed and managed by ZUCOL.