BUS-FP4014 - Operations Management: Manufacturing Decisions

Verified

Added on  2022/08/27

|7
|864
|21
Homework Assignment
AI Summary
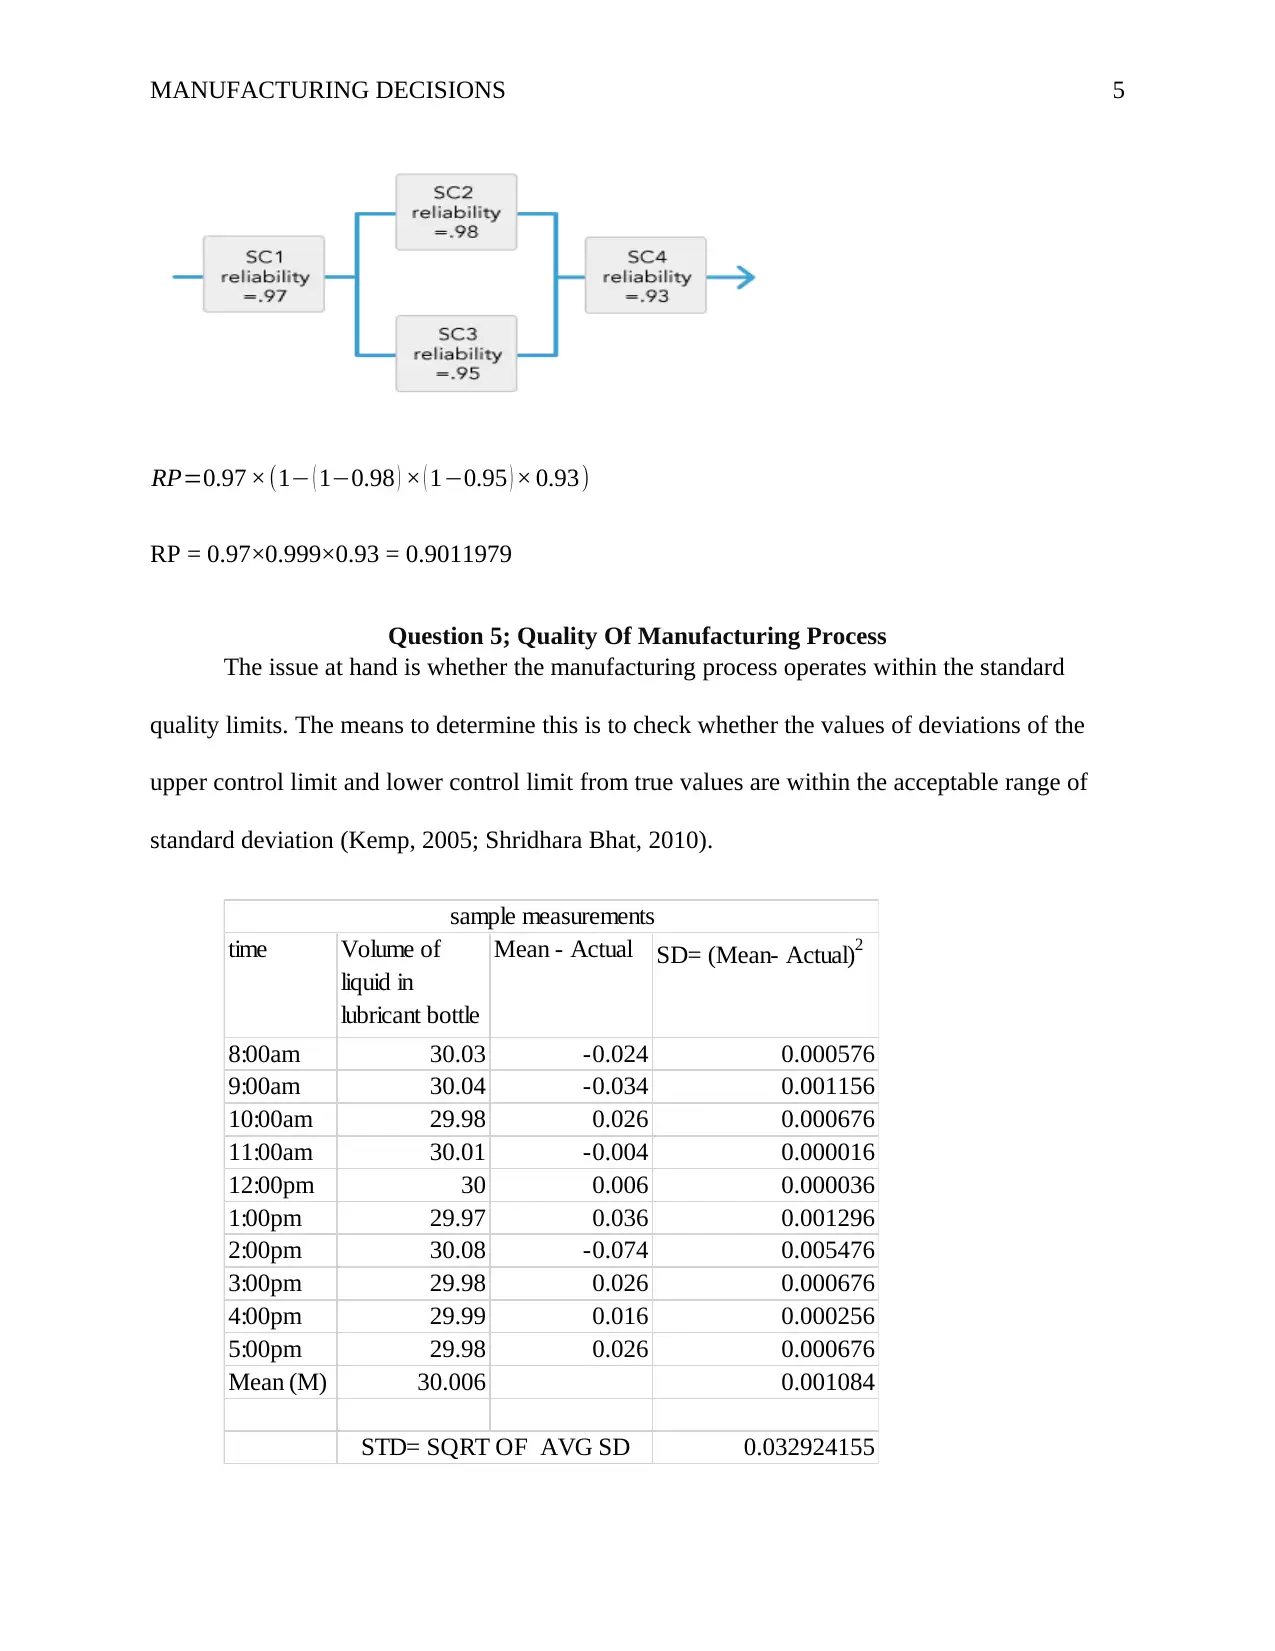
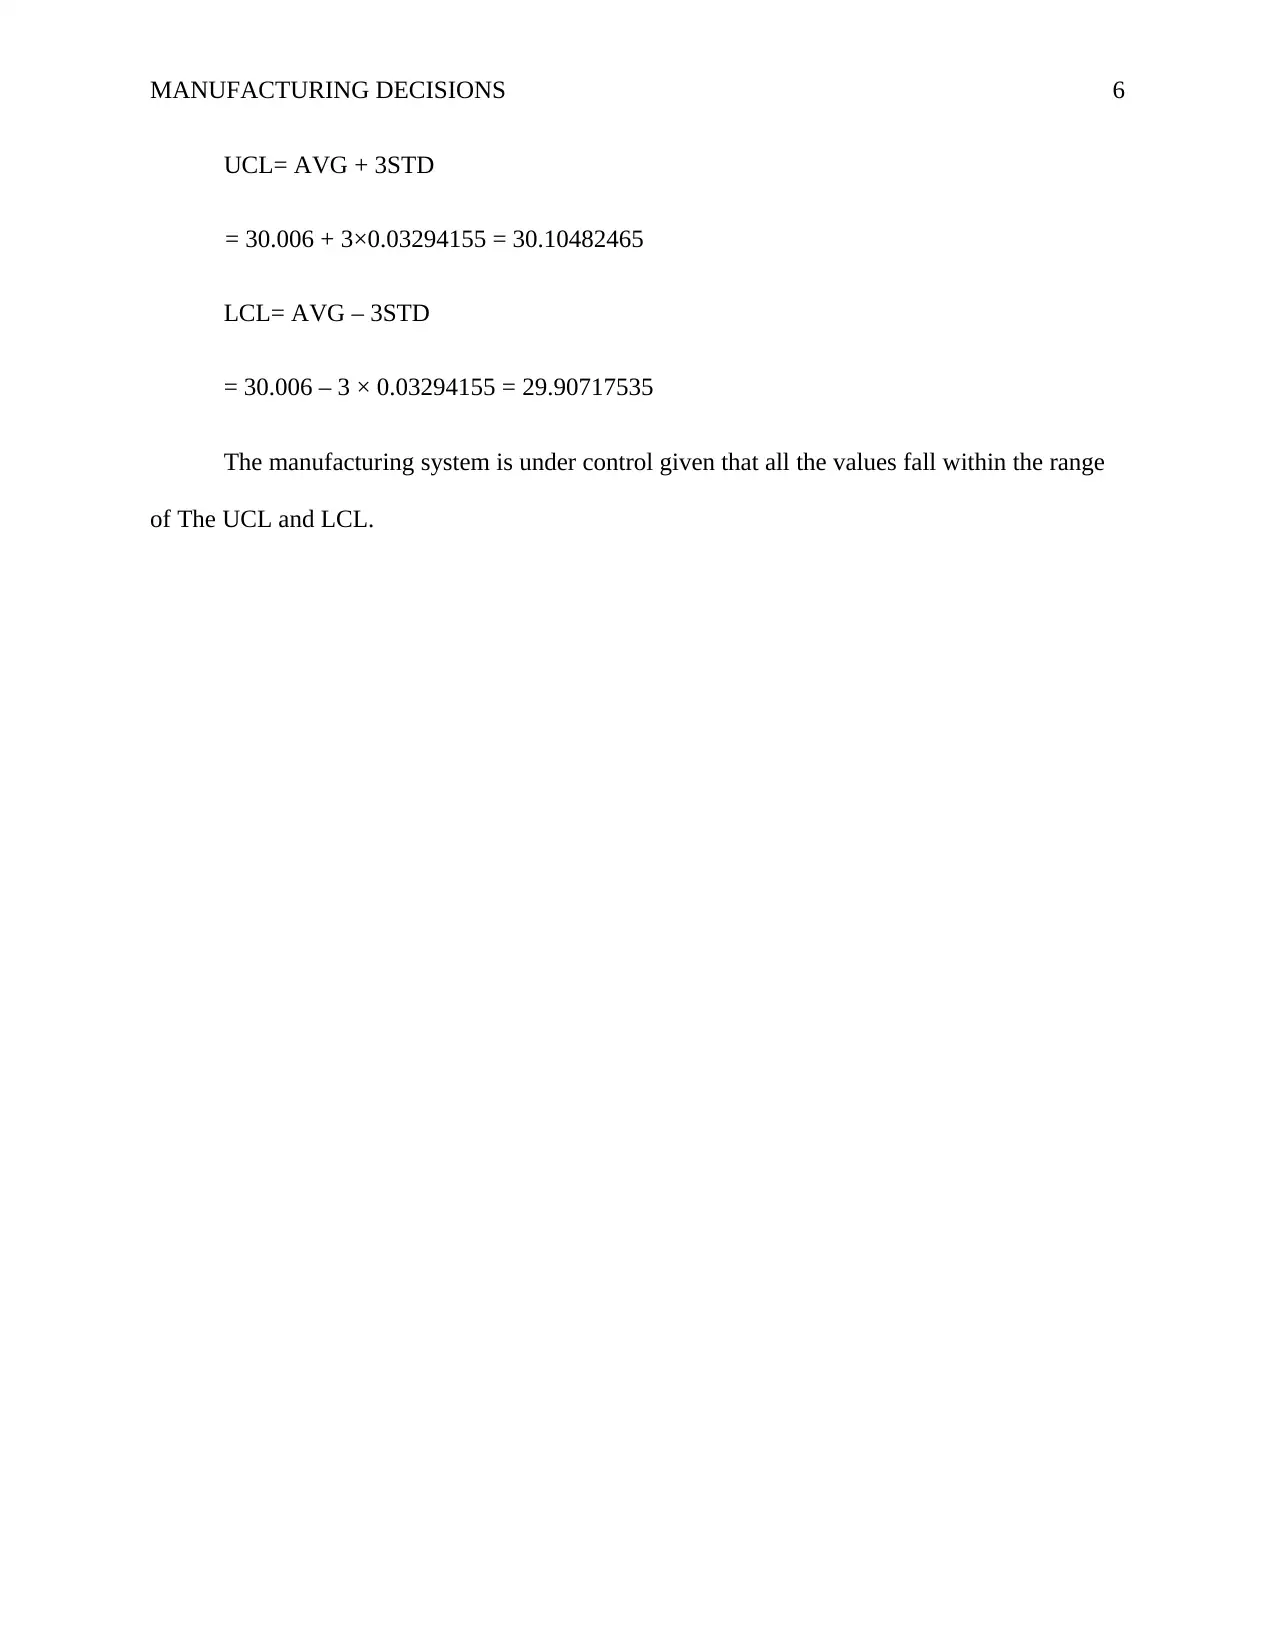
This assignment delves into key aspects of manufacturing decisions within an operations management context. It begins with a break-even analysis to determine the sales volume required to recover production costs, considering fixed and variable costs, and selling prices. The analysis then explores competitive pricing strategies, evaluating the impact of different price points on profitability. Furthermore, the assignment assesses product reliability, calculating the overall reliability of pump assemblies and other products with parallel components. Finally, it addresses quality management by evaluating whether the manufacturing process operates within acceptable quality limits, using control limits and standard deviations. The assignment utilizes algebraic equations and real-world scenarios to illustrate these concepts, providing a comprehensive overview of critical manufacturing decisions.
Document Page
Running head: MANUFACTURING DECISIONS 1
MANUFACTURING DECISIONS
Name
Institution
tabler-icon-diamond-filled.svg

Paraphrase This Document

Need a fresh take? Get an instant paraphrase of this document with our AI Paraphraser
Document Page
MANUFACTURING DECISIONS 2
MANUFACTURING DECISIONS
Question 1: Break-Even Analysis
The critical challenge in the discussed scenario is to determine the volume of sales that
the company needs to recover the production cost considering the quality of the products and the
price that customers would be willing to pay for the product. The company needs to ensure a
certain threshold is realized in terms of units sold. The break-even analysis determines the point
at which sales equal to the cost incurred in production. As such, it computes the number of units
that must be sold to recover the cost incurred in availing the goods to the customers (Reid &
Sanders, 2016).
For ABC producing a pump is associated with the following costs;
Fixed costs = $100000
Variable costs = $50 per unit
Selling price = $100
Algebraic equation for BEU
BEU = FC
PVC , where; FC = Fixed Costs, P = Selling Price, VC = variable costs
Therefore;
BEU = 100000
10050 = 2000 units.
Document Page
MANUFACTURING DECISIONS 3
Question 2: Competitive Pricing
In cases where a business faces stiff competition, it usually's strategically logical to
reduce the price of its products to gain a competitive advantage. ABC faces stiff competition
from other pump dealers, and the president has to decide whether or not to change the price at
which the company sells the pumps. Selling the pump at a reduced price will increase the
number of sales but may result in less revenue for the company. Selling at a heightened price
may attract fewer customers, and it has the potential to result in either reduced or increased
revenues. To decide which is a better option, a mathematical computation for Contribution to
profits is done for either scenario (King, 2013).
If the company sells pumps at $100, 3600 units will be sold
If the company sells pumps at $110, 2900 units will be sold
Algebraic equation
CP=UV (PV C), Where; CP = Contribution to profit, UV = Unit Volume, P = selling Price,
VC = variable cost (50)
If P is $110,
CP=2900(11050) = $174000
If P is $100
CP=3600(10050) = $180000
In this scenario, the price point of $100 is better since it will generate more profits.
Document Page
MANUFACTURING DECISIONS 4
Question 3: reliability of products
In quality management, a company must know the overall safety of its products.
Reliability is a critical factor in customer satisfaction. ABC needs to understand how reliable its
pumps are, and this can be done by combining the reliabilities of individual parts of the pump
(Mustafa & Sarhan, 2007). The operations management team needs to know the overall
reliability of the entire pump assembly.
Algebraic equation
Rt =R 1 × R 2 × R 3 .× Rn, where Rt = Total reliability, Rn = reliability of parts
1,2, 3……up to part n where n is the total number of components.
In this case, R1 = 0.997, R2 = 0.998, R3 = 0.995, R4 = 0.999, R5 = 0.990
Rt =0.997 ×0.998 ×0.99 5 ×0.999 × 0.990=0.97915
Question 4: Reliability of another product
The challenge for this scenario is the production of another product in which two parts
are used in parallel. There is need to know the overall reliability value (Mustafa & Sarhan, 2007;
Saravanan, 2013).
Equation
RP=SCR 1 ×(1 ( 1SCR 2 ) × ( 1SCR 3 ) × SCR 4),
Where the reliabilities are as shown in the diagram
tabler-icon-diamond-filled.svg

Paraphrase This Document

Need a fresh take? Get an instant paraphrase of this document with our AI Paraphraser
Document Page
MANUFACTURING DECISIONS 5
RP=0.97 ×(1 ( 10.98 ) × ( 10.95 ) × 0.93)
RP = 0.97×0.999×0.93 = 0.9011979
Question 5; Quality Of Manufacturing Process
The issue at hand is whether the manufacturing process operates within the standard
quality limits. The means to determine this is to check whether the values of deviations of the
upper control limit and lower control limit from true values are within the acceptable range of
standard deviation (Kemp, 2005; Shridhara Bhat, 2010).
time Volume of
liquid in
lubricant bottle
Mean - Actual SD= (Mean- Actual)2
8:00am 30.03 -0.024 0.000576
9:00am 30.04 -0.034 0.001156
10:00am 29.98 0.026 0.000676
11:00am 30.01 -0.004 0.000016
12:00pm 30 0.006 0.000036
1:00pm 29.97 0.036 0.001296
2:00pm 30.08 -0.074 0.005476
3:00pm 29.98 0.026 0.000676
4:00pm 29.99 0.016 0.000256
5:00pm 29.98 0.026 0.000676
Mean (M) 30.006 0.001084
0.032924155
sample measurements
STD= SQRT OF AVG SD
Document Page
MANUFACTURING DECISIONS 6
UCL= AVG + 3STD
= 30.006 + 3×0.03294155 = 30.10482465
LCL= AVG – 3STD
= 30.006 – 3 × 0.03294155 = 29.90717535
The manufacturing system is under control given that all the values fall within the range
of The UCL and LCL.
Document Page
MANUFACTURING DECISIONS 7
References
Kemp, S. (2005). Quality Management demystified. Blacklick, OH: McGraw-Hill.
Methods and systems for investment appraisal for manufacturing decisions. (2013). Google
Patents.
Mustafa, A., & Sarhan, A. M. (2007). Reliability Equivalence of a Parallel- Series System.
Pakistan Journal of Statistics, 219-230.
Reid, R., & Sanders, N. (2016). Operations Management: An Integrated Approach (6th ed.).
Hoboken, NJ: Wiley.
Saravanan, A. a. (2013). Implementation of Quality Control Charts in Bottle Manufacturing
Industry. International Journal of Engineering Science and Technology (IJEST), vol,
335-340.
Shridhara Bhat, K. (2010). Total Quality Management: texts and Cases. Mumbai: Global Media.
chevron_up_icon
1 out of 7
circle_padding
hide_on_mobile
zoom_out_icon
[object Object]