Operations Management: Strategic and Environmental Analysis Homework

Verified

Added on  2020/03/16

|6
|511
|87
Homework Assignment
AI Summary
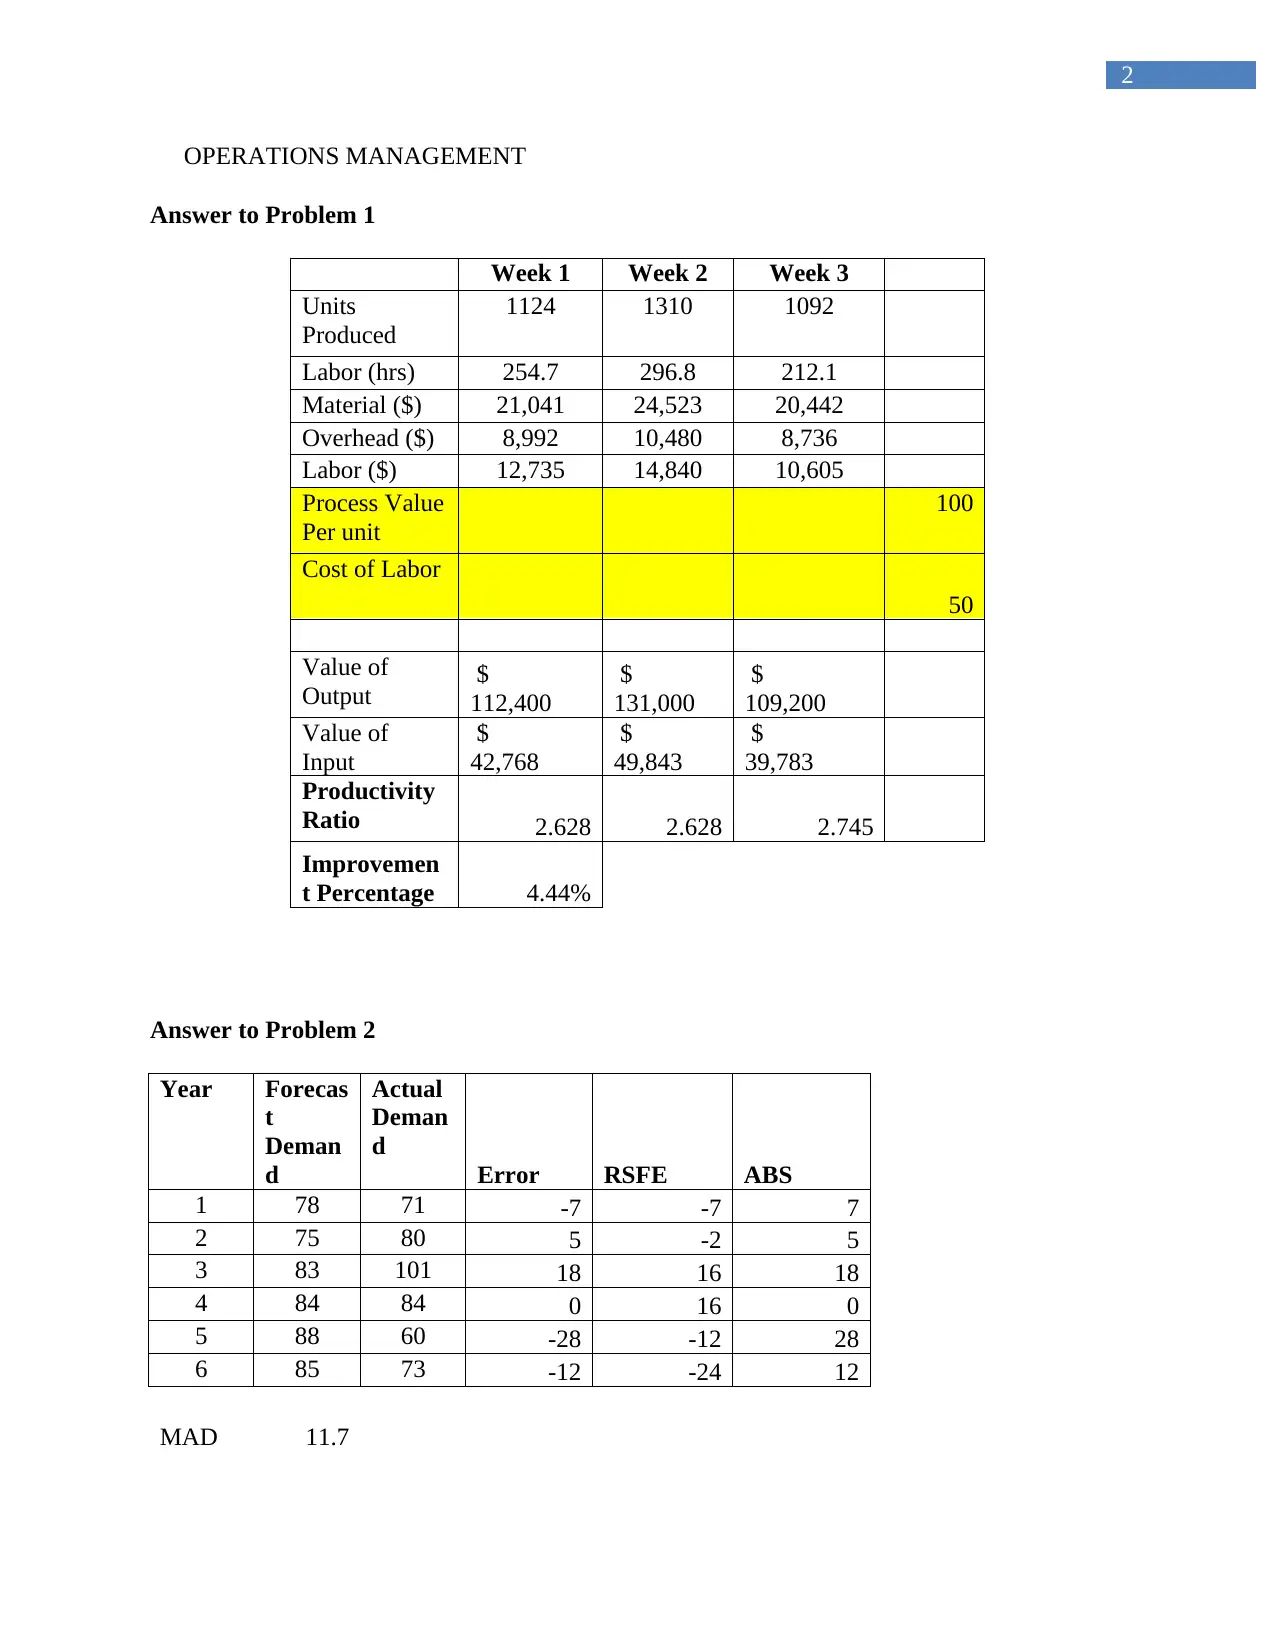
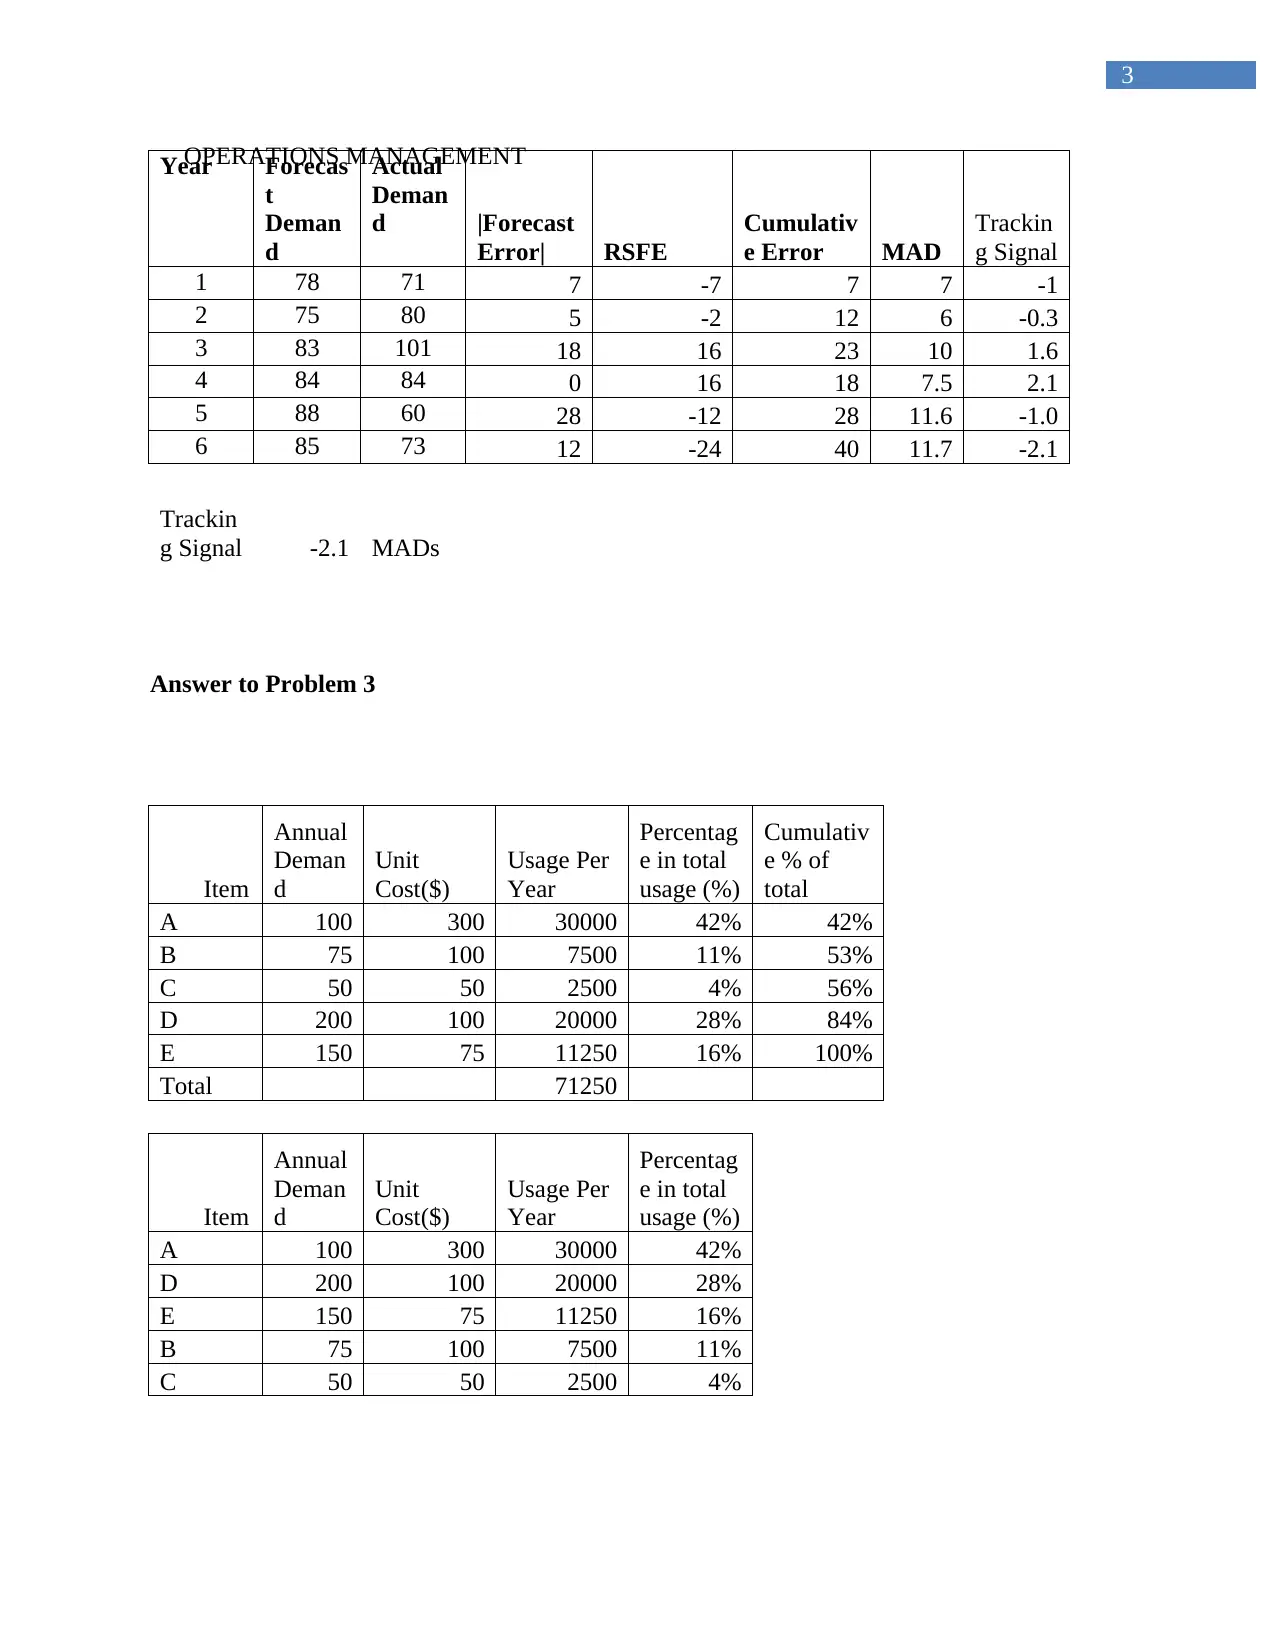
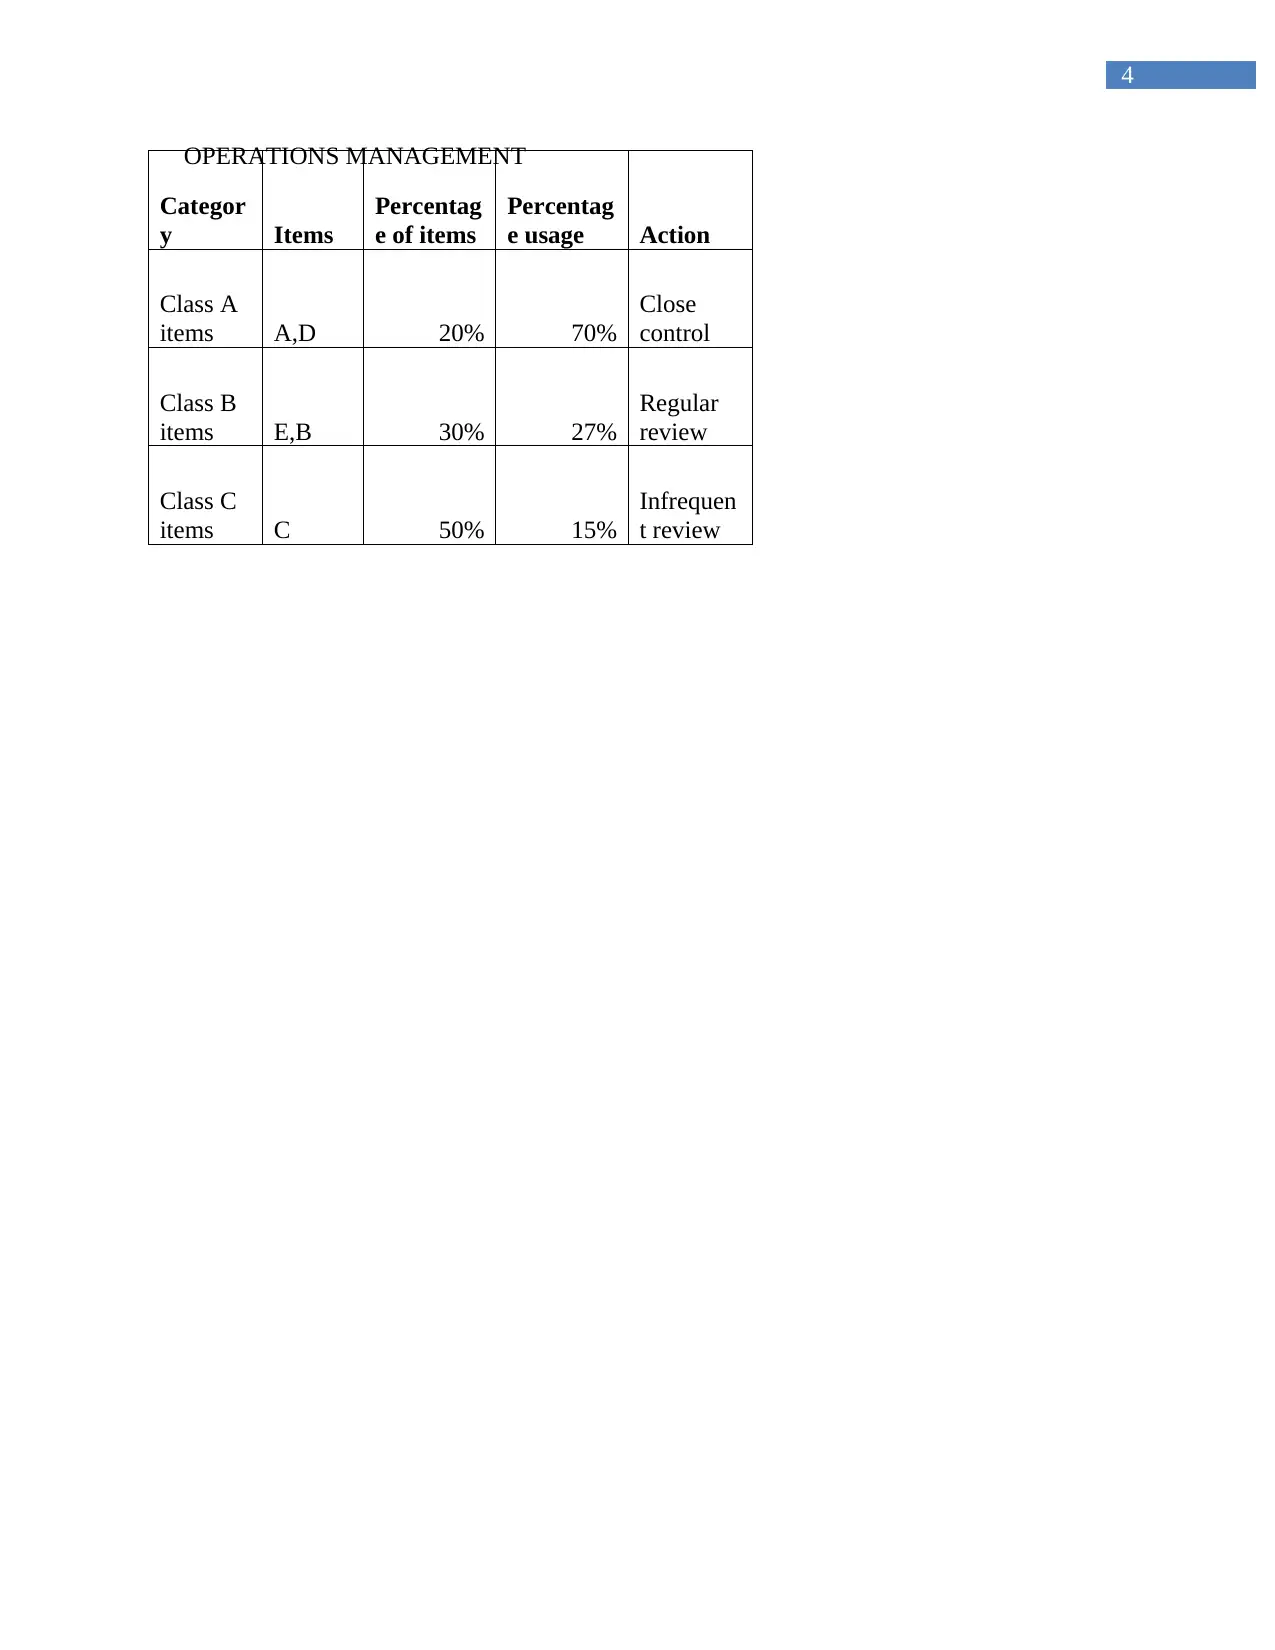
This document presents a solved operations management homework assignment. The solution includes detailed answers to three problems. Problem 1 focuses on productivity analysis, calculating productivity ratios and improvement percentages across three weeks. Problem 2 involves forecasting, calculating forecast errors (RSFE, MAD, and tracking signal) for a given dataset. Problem 3 covers ABC inventory management, categorizing items based on their annual demand and unit cost to determine appropriate inventory control strategies. The assignment references several key operations management textbooks and provides a comprehensive analysis of the problems.
Document Page
Running head: OPERATIONS MANAGEMENT
Strategic and Environmental Analysis
Name of Student:
Name of University:
Author’s Note:
tabler-icon-diamond-filled.svg

Secure Best Marks with AI Grader

Need help grading? Try our AI Grader for instant feedback on your assignments.
Document Page
1
OPERATIONS MANAGEMENT
Table of Contents
Answer to Problem 1.......................................................................................................................2
Answer to Problem 2.......................................................................................................................2
Answer to Problem 3.......................................................................................................................3
Document Page
2
OPERATIONS MANAGEMENT
Answer to Problem 1
Week 1 Week 2 Week 3
Units
Produced
1124 1310 1092
Labor (hrs) 254.7 296.8 212.1
Material ($) 21,041 24,523 20,442
Overhead ($) 8,992 10,480 8,736
Labor ($) 12,735 14,840 10,605
Process Value
Per unit
100
Cost of Labor
50
Value of
Output $
112,400
$
131,000
$
109,200
Value of
Input
$
42,768
$
49,843
$
39,783
Productivity
Ratio 2.628 2.628 2.745
Improvemen
t Percentage 4.44%
Answer to Problem 2
Year Forecas
t
Deman
d
Actual
Deman
d
Error RSFE ABS
1 78 71 -7 -7 7
2 75 80 5 -2 5
3 83 101 18 16 18
4 84 84 0 16 0
5 88 60 -28 -12 28
6 85 73 -12 -24 12
MAD 11.7
Document Page
3
OPERATIONS MANAGEMENTYear Forecas
t
Deman
d
Actual
Deman
d |Forecast
Error| RSFE
Cumulativ
e Error MAD
Trackin
g Signal
1 78 71 7 -7 7 7 -1
2 75 80 5 -2 12 6 -0.3
3 83 101 18 16 23 10 1.6
4 84 84 0 16 18 7.5 2.1
5 88 60 28 -12 28 11.6 -1.0
6 85 73 12 -24 40 11.7 -2.1
Trackin
g Signal -2.1 MADs
Answer to Problem 3
Item
Annual
Deman
d
Unit
Cost($)
Usage Per
Year
Percentag
e in total
usage (%)
Cumulativ
e % of
total
A 100 300 30000 42% 42%
B 75 100 7500 11% 53%
C 50 50 2500 4% 56%
D 200 100 20000 28% 84%
E 150 75 11250 16% 100%
Total 71250
Item
Annual
Deman
d
Unit
Cost($)
Usage Per
Year
Percentag
e in total
usage (%)
A 100 300 30000 42%
D 200 100 20000 28%
E 150 75 11250 16%
B 75 100 7500 11%
C 50 50 2500 4%
tabler-icon-diamond-filled.svg

Secure Best Marks with AI Grader

Need help grading? Try our AI Grader for instant feedback on your assignments.
Document Page
4
OPERATIONS MANAGEMENT
Categor
y Items
Percentag
e of items
Percentag
e usage Action
Class A
items A,D 20% 70%
Close
control
Class B
items E,B 30% 27%
Regular
review
Class C
items C 50% 15%
Infrequen
t review
Document Page
5
OPERATIONS MANAGEMENT
Reference
Heizer, J., 2016. Operations Management, 11/e. Pearson Education India.
Jacobs, R. and Chase, R., 2013. Operations and supply chain management. McGraw-Hill Higher
Education.
Krajewski, L.J., Ritzman, L.P. and Malhotra, M.K., 2013. Operations management: processes
and supply chains (Vol. 1). New York, NY: Pearson.
Slack, N., 2015. Operations strategy. John Wiley & Sons, Ltd.
Slack, N., Brandon-Jones, A. and Johnston, R., 2013. Operations management. Pearson.
Zurich, L.B., 2017. Service Operations and Management.
chevron_up_icon
1 out of 6
circle_padding
hide_on_mobile
zoom_out_icon
[object Object]