Operations Management Report: Friendly Courier Inc. Analysis

Verified

Added on  2023/05/29

|7
|1184
|172
Report
AI Summary
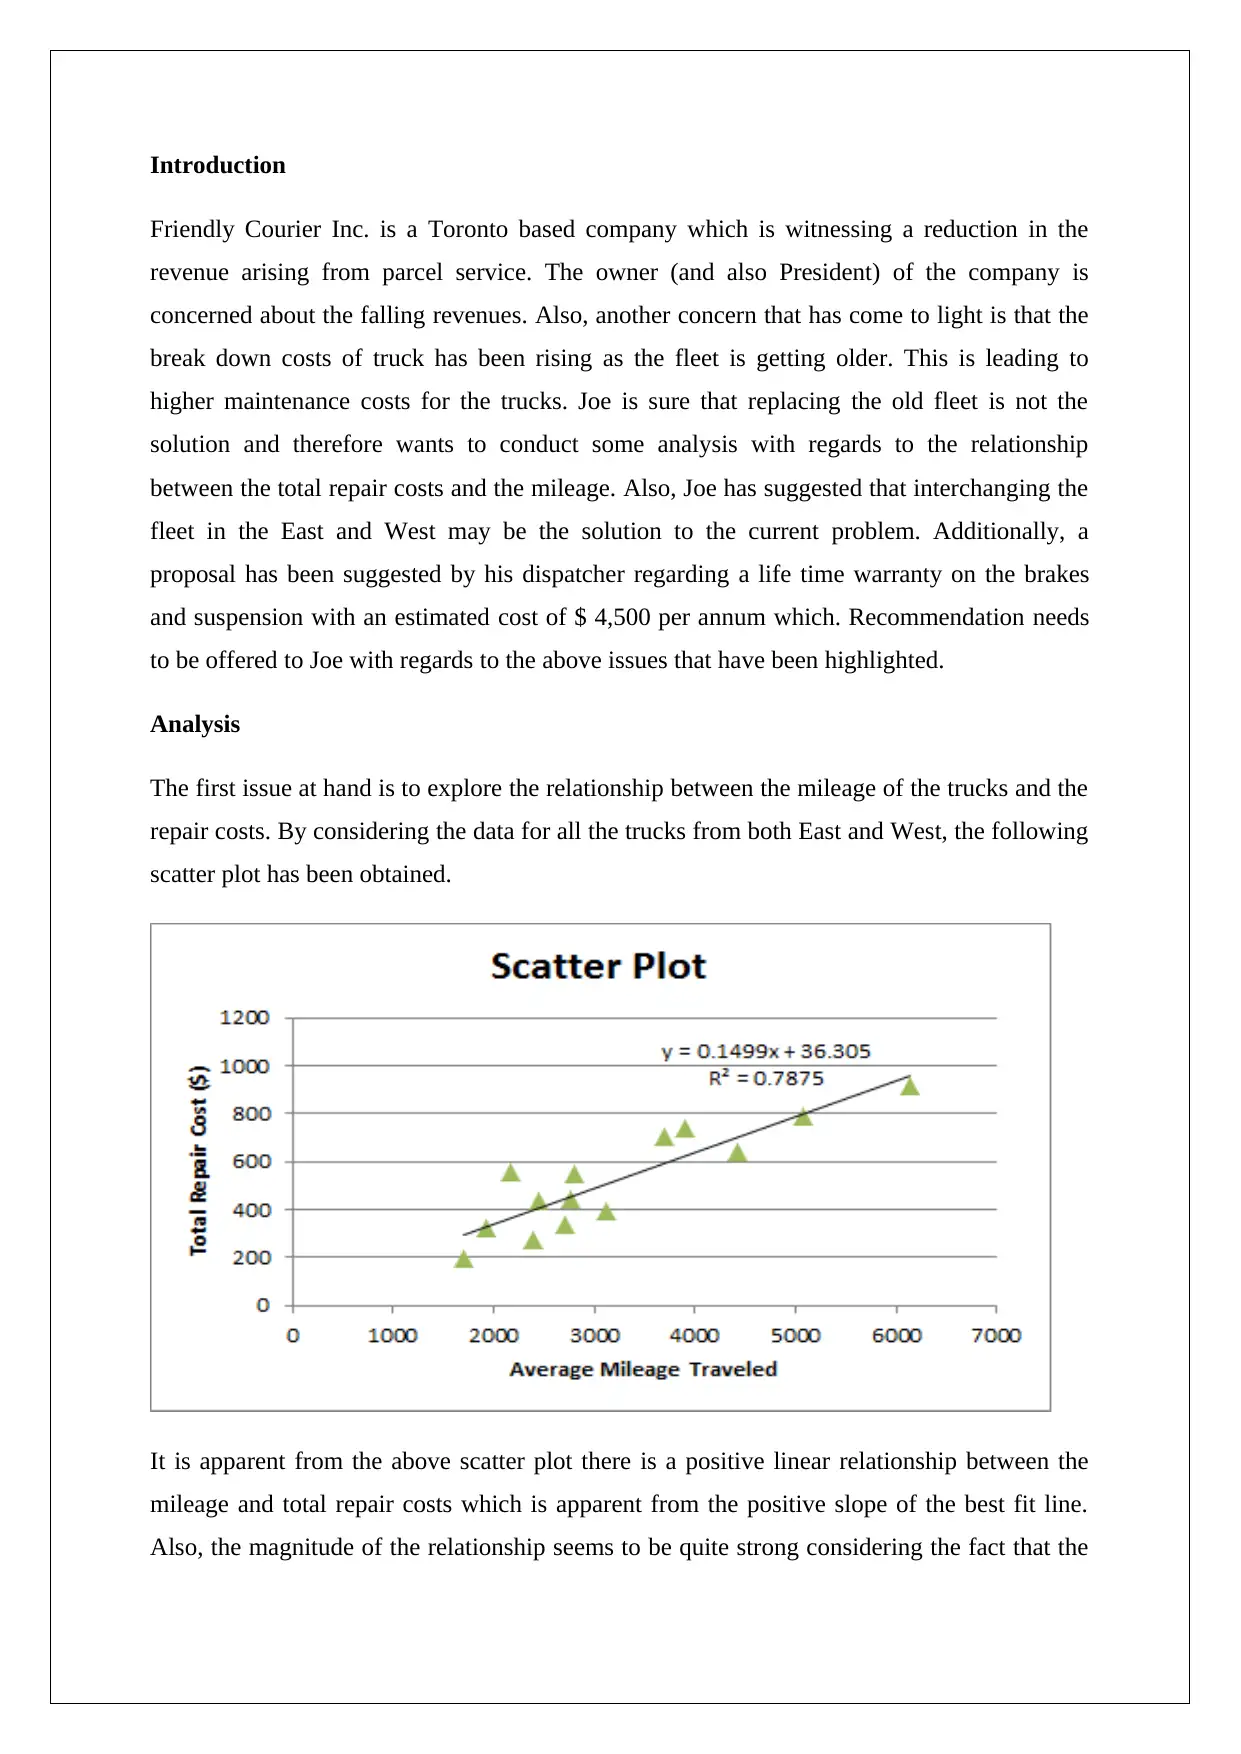
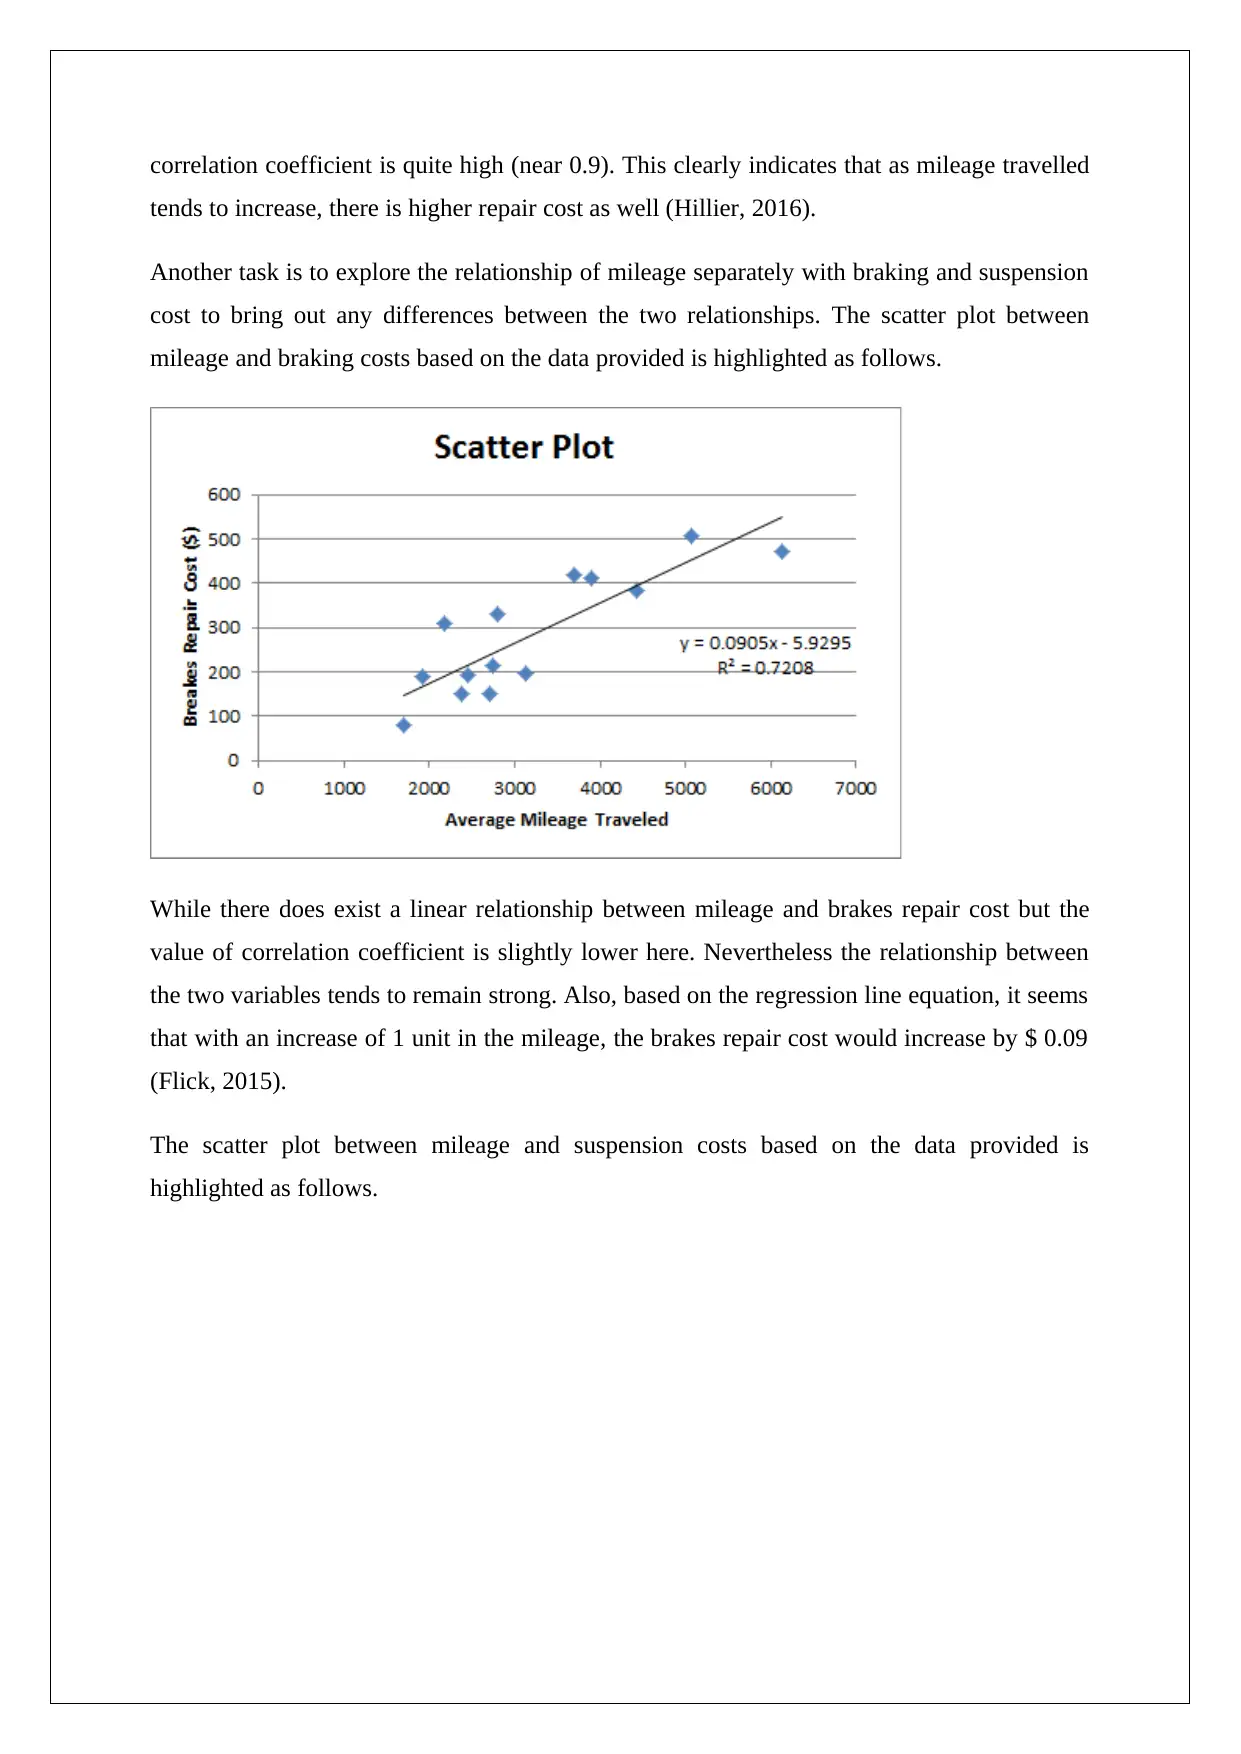
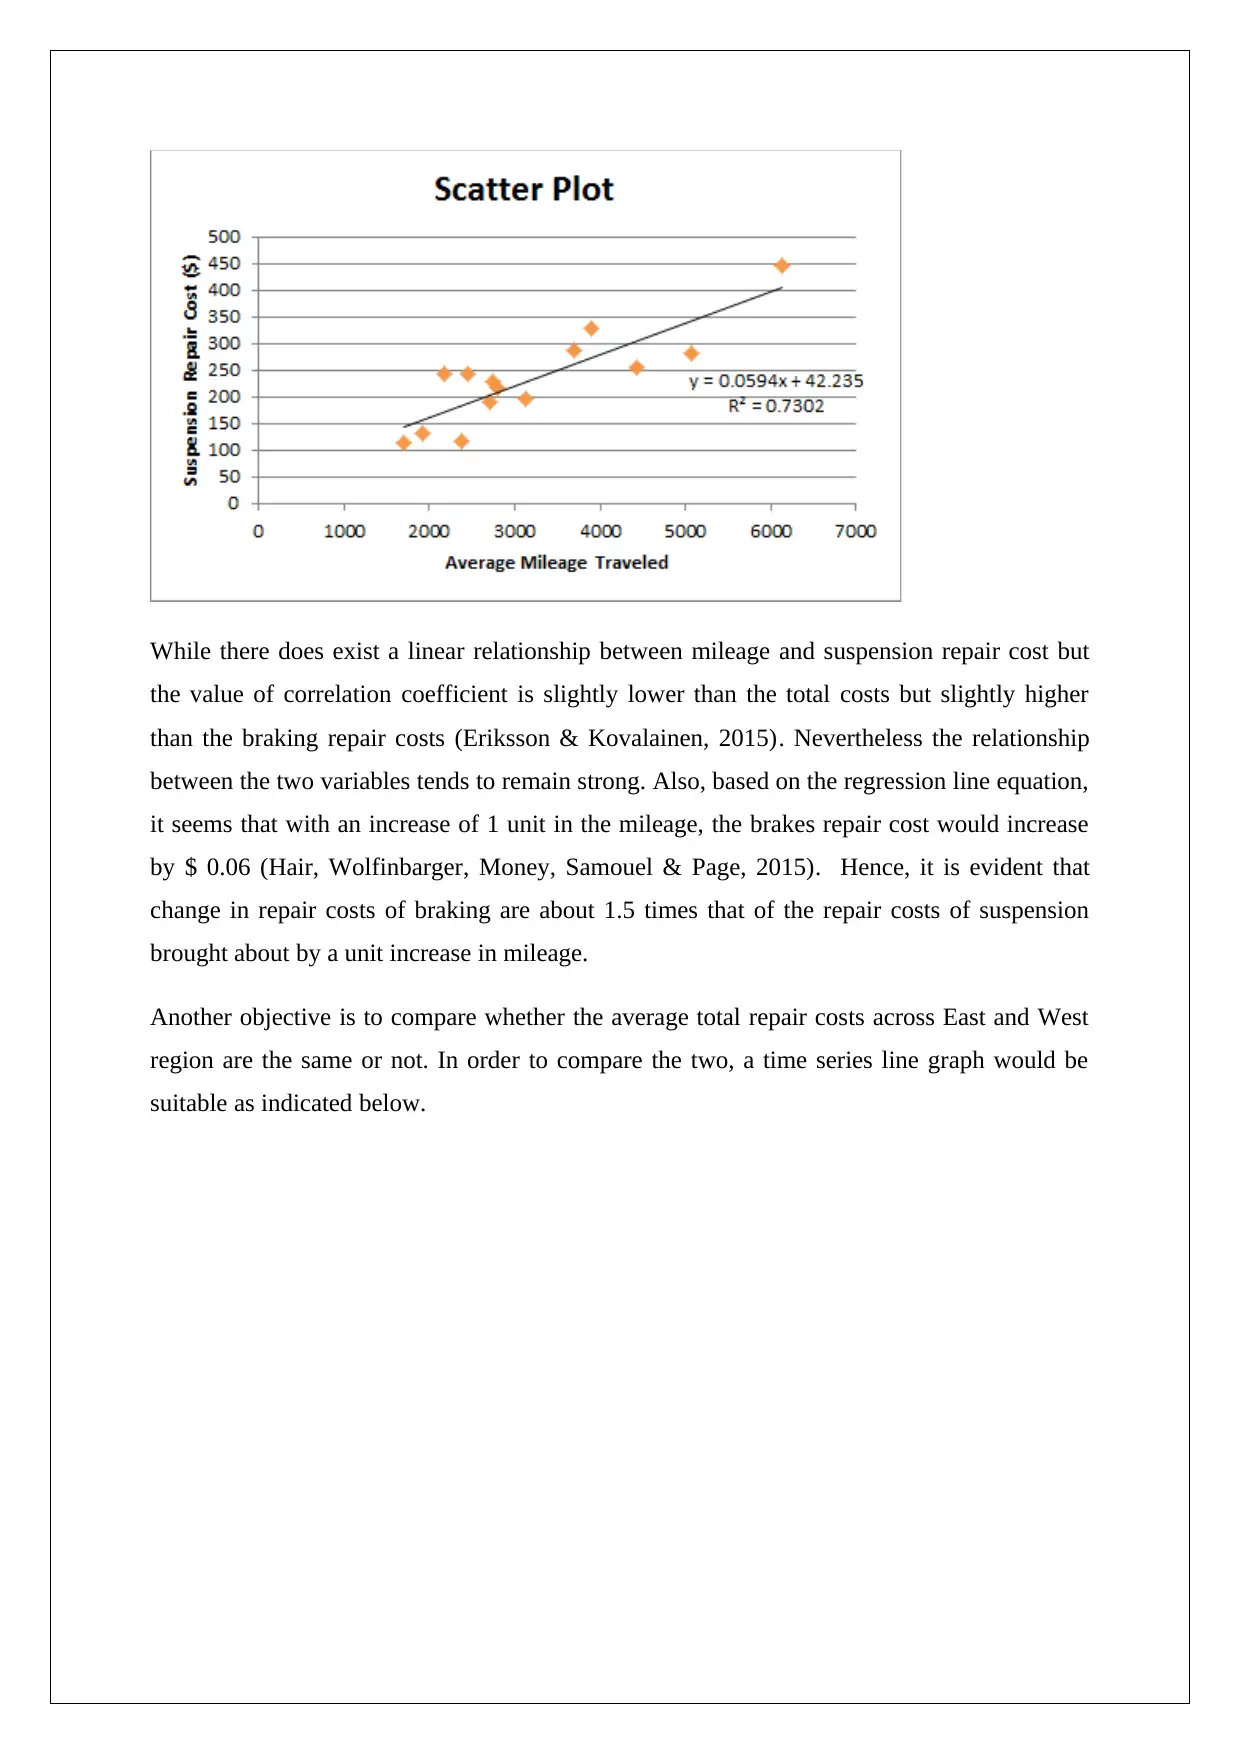
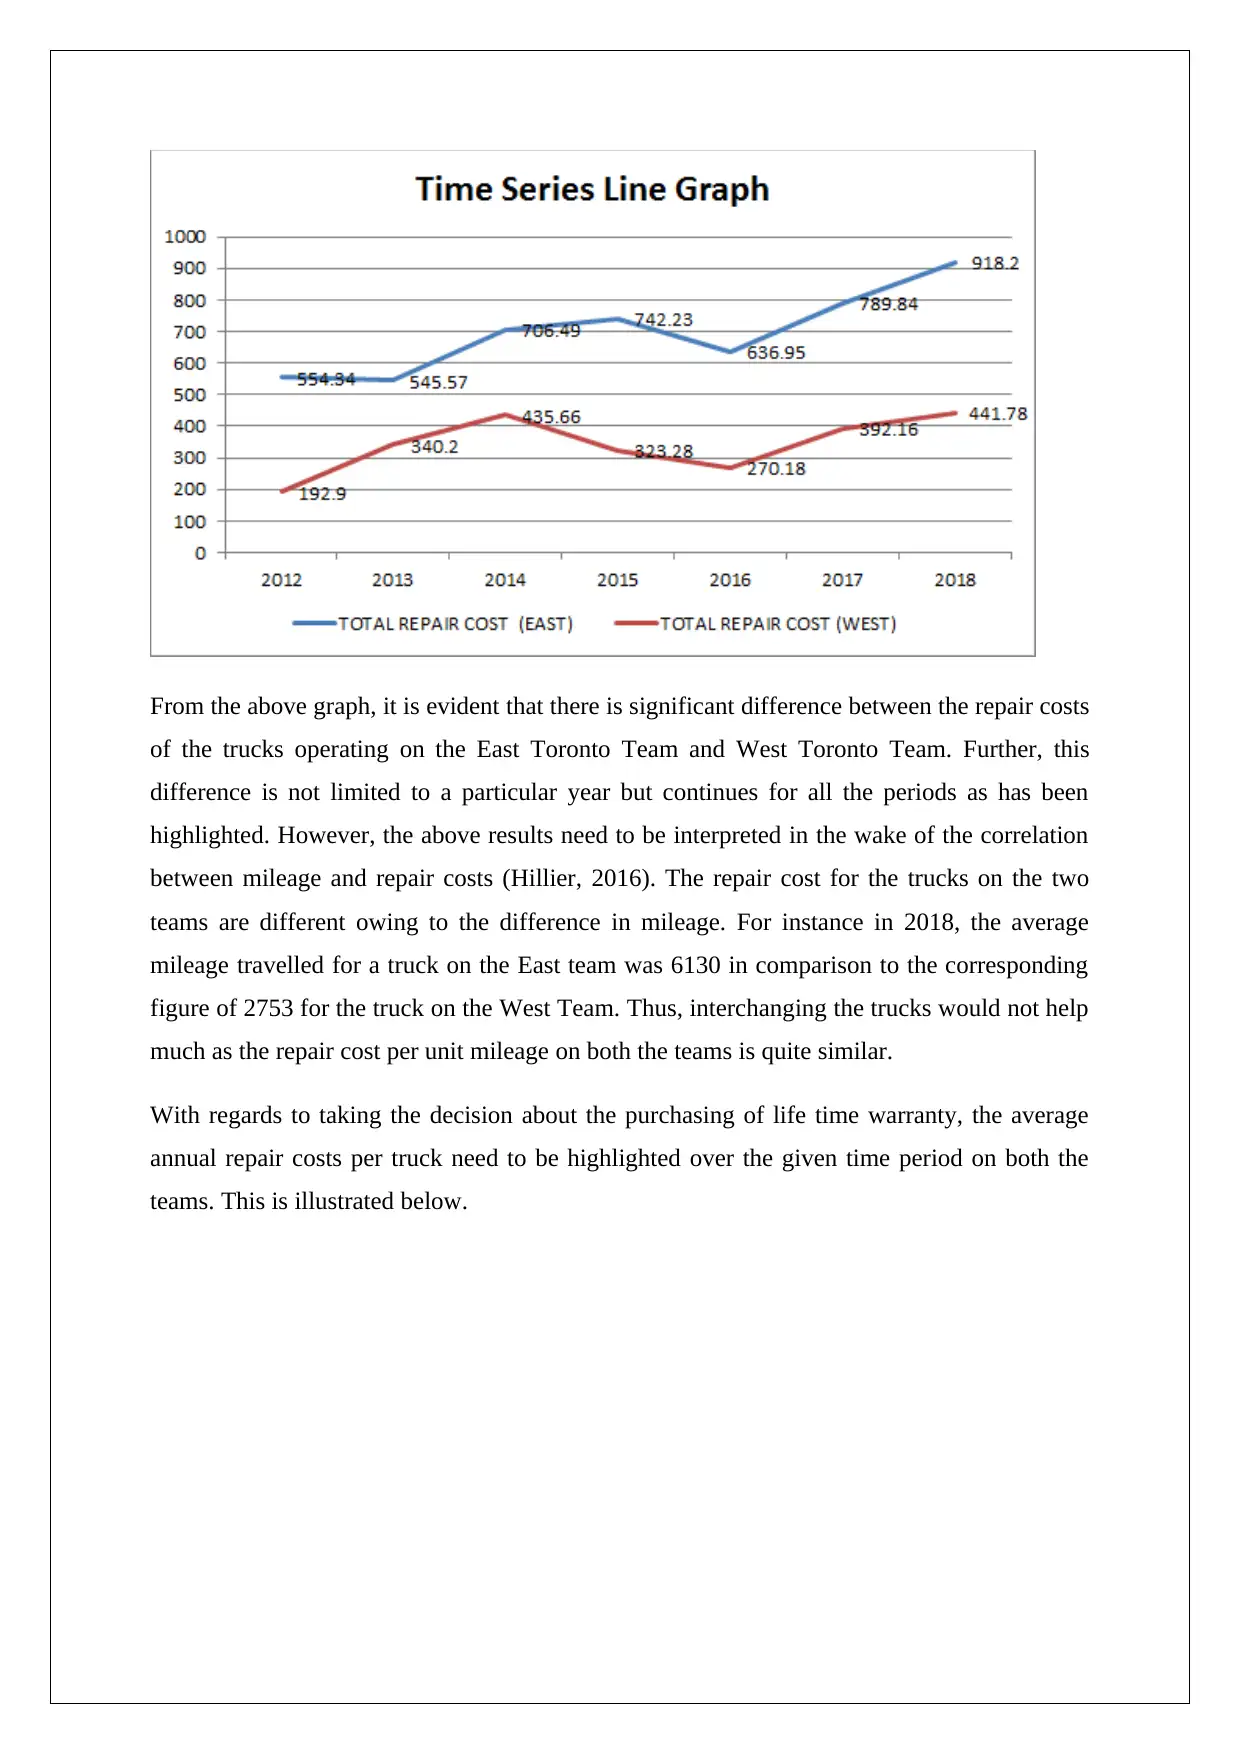
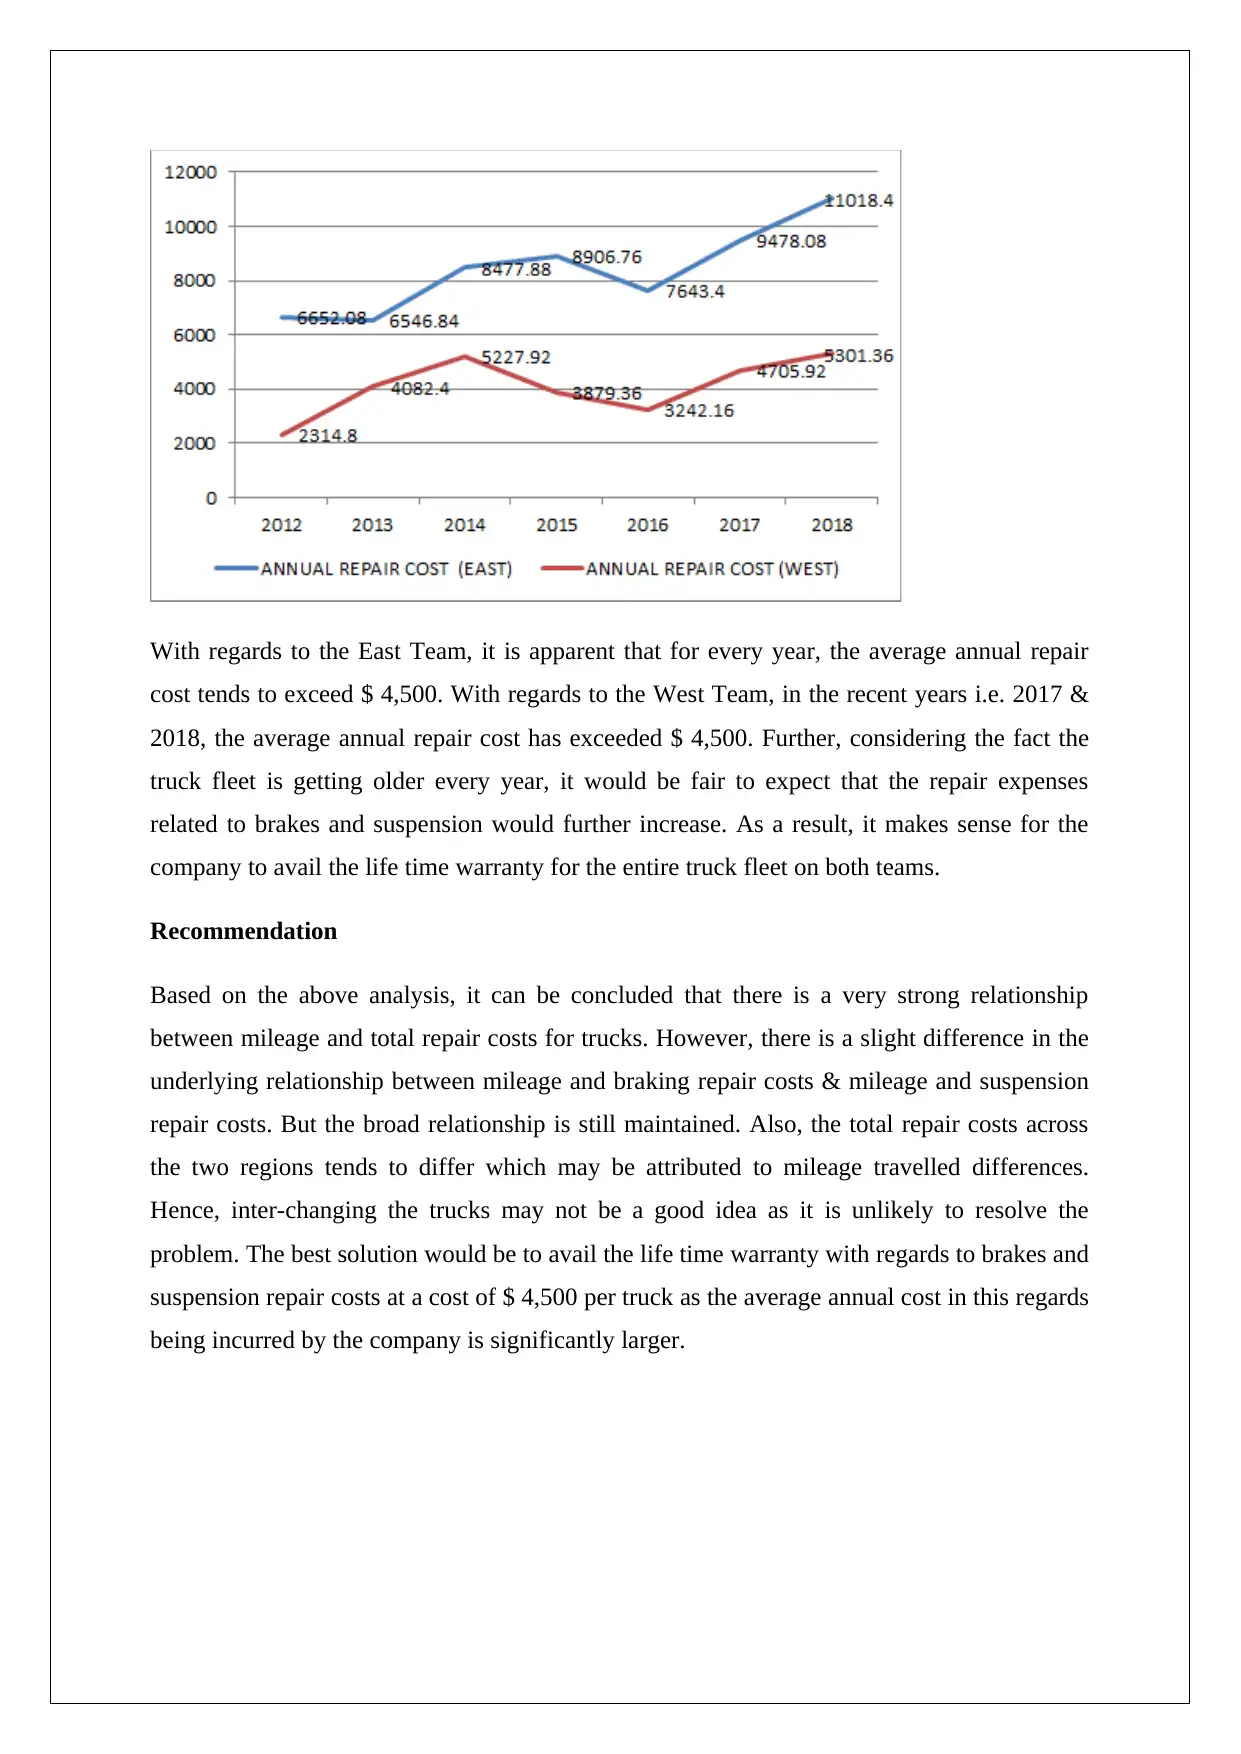
This operations management report analyzes the relationship between truck mileage and repair costs for Friendly Courier Inc. The analysis includes scatter plots to demonstrate the positive linear relationship between mileage and total repair costs, as well as a breakdown of braking and suspension repair costs. The report compares repair costs between the East and West teams, highlighting differences attributed to mileage variations. It assesses the viability of a lifetime warranty for brakes and suspension, considering the average annual repair costs. The report recommends availing the lifetime warranty due to the high average annual costs and concludes that interchanging the trucks between the East and West teams would not be beneficial. The report uses references to support its findings.
Document Page
OPERATIONS MANAGEMENT
STUDENT ID:
[Pick the date]
tabler-icon-diamond-filled.svg

Secure Best Marks with AI Grader

Need help grading? Try our AI Grader for instant feedback on your assignments.
Document Page
Introduction
Friendly Courier Inc. is a Toronto based company which is witnessing a reduction in the
revenue arising from parcel service. The owner (and also President) of the company is
concerned about the falling revenues. Also, another concern that has come to light is that the
break down costs of truck has been rising as the fleet is getting older. This is leading to
higher maintenance costs for the trucks. Joe is sure that replacing the old fleet is not the
solution and therefore wants to conduct some analysis with regards to the relationship
between the total repair costs and the mileage. Also, Joe has suggested that interchanging the
fleet in the East and West may be the solution to the current problem. Additionally, a
proposal has been suggested by his dispatcher regarding a life time warranty on the brakes
and suspension with an estimated cost of $ 4,500 per annum which. Recommendation needs
to be offered to Joe with regards to the above issues that have been highlighted.
Analysis
The first issue at hand is to explore the relationship between the mileage of the trucks and the
repair costs. By considering the data for all the trucks from both East and West, the following
scatter plot has been obtained.
It is apparent from the above scatter plot there is a positive linear relationship between the
mileage and total repair costs which is apparent from the positive slope of the best fit line.
Also, the magnitude of the relationship seems to be quite strong considering the fact that the
Document Page
correlation coefficient is quite high (near 0.9). This clearly indicates that as mileage travelled
tends to increase, there is higher repair cost as well (Hillier, 2016).
Another task is to explore the relationship of mileage separately with braking and suspension
cost to bring out any differences between the two relationships. The scatter plot between
mileage and braking costs based on the data provided is highlighted as follows.
While there does exist a linear relationship between mileage and brakes repair cost but the
value of correlation coefficient is slightly lower here. Nevertheless the relationship between
the two variables tends to remain strong. Also, based on the regression line equation, it seems
that with an increase of 1 unit in the mileage, the brakes repair cost would increase by $ 0.09
(Flick, 2015).
The scatter plot between mileage and suspension costs based on the data provided is
highlighted as follows.
Document Page
While there does exist a linear relationship between mileage and suspension repair cost but
the value of correlation coefficient is slightly lower than the total costs but slightly higher
than the braking repair costs (Eriksson & Kovalainen, 2015). Nevertheless the relationship
between the two variables tends to remain strong. Also, based on the regression line equation,
it seems that with an increase of 1 unit in the mileage, the brakes repair cost would increase
by $ 0.06 (Hair, Wolfinbarger, Money, Samouel & Page, 2015). Hence, it is evident that
change in repair costs of braking are about 1.5 times that of the repair costs of suspension
brought about by a unit increase in mileage.
Another objective is to compare whether the average total repair costs across East and West
region are the same or not. In order to compare the two, a time series line graph would be
suitable as indicated below.
tabler-icon-diamond-filled.svg

Secure Best Marks with AI Grader

Need help grading? Try our AI Grader for instant feedback on your assignments.
Document Page
From the above graph, it is evident that there is significant difference between the repair costs
of the trucks operating on the East Toronto Team and West Toronto Team. Further, this
difference is not limited to a particular year but continues for all the periods as has been
highlighted. However, the above results need to be interpreted in the wake of the correlation
between mileage and repair costs (Hillier, 2016). The repair cost for the trucks on the two
teams are different owing to the difference in mileage. For instance in 2018, the average
mileage travelled for a truck on the East team was 6130 in comparison to the corresponding
figure of 2753 for the truck on the West Team. Thus, interchanging the trucks would not help
much as the repair cost per unit mileage on both the teams is quite similar.
With regards to taking the decision about the purchasing of life time warranty, the average
annual repair costs per truck need to be highlighted over the given time period on both the
teams. This is illustrated below.
Document Page
With regards to the East Team, it is apparent that for every year, the average annual repair
cost tends to exceed $ 4,500. With regards to the West Team, in the recent years i.e. 2017 &
2018, the average annual repair cost has exceeded $ 4,500. Further, considering the fact the
truck fleet is getting older every year, it would be fair to expect that the repair expenses
related to brakes and suspension would further increase. As a result, it makes sense for the
company to avail the life time warranty for the entire truck fleet on both teams.
Recommendation
Based on the above analysis, it can be concluded that there is a very strong relationship
between mileage and total repair costs for trucks. However, there is a slight difference in the
underlying relationship between mileage and braking repair costs & mileage and suspension
repair costs. But the broad relationship is still maintained. Also, the total repair costs across
the two regions tends to differ which may be attributed to mileage travelled differences.
Hence, inter-changing the trucks may not be a good idea as it is unlikely to resolve the
problem. The best solution would be to avail the life time warranty with regards to brakes and
suspension repair costs at a cost of $ 4,500 per truck as the average annual cost in this regards
being incurred by the company is significantly larger.
Document Page
References
Eriksson, P. & Kovalainen, A. (2015). Quantitative methods in business research London:
Sage Publications.
Flick, U. (2015). Introducing research methodology: A beginner's guide to doing a research
project New York: Sage Publications.
Hair, J. F., Wolfinbarger, M., Money, A. H., Samouel, P., & Page, M. J. (2015). Essentials of
business research methods New York: Routledge.
Hillier, F. (2016). Introduction to Operations Research.New York: McGraw Hill
Publications.
chevron_up_icon
1 out of 7
circle_padding
hide_on_mobile
zoom_out_icon
[object Object]