Case Study: Operations Management BSOM046 - SPC in Effluent Control
VerifiedAdded on 2024/06/21
|9
|2435
|132
Report
AI Summary
This report provides a literature review of Statistical Process Control (SPC), its history, techniques, and applications across various industries. It includes a case study analysis of Waterside Leather Limited (WLL), focusing on temperature control in effluent discharge. The analysis employs control charts (X-Bar Chart) and descriptive statistics to assess temperature variations over 120 days, determining whether the effluent process is statistically controlled. The report discusses management decisions for quality improvement, suggesting the use of Six-Sigma DMAIC approach and multivariate SPC methods to address special cause variations. It concludes with recommendations for WLL to enhance plant performance and maintain effluent quality, with references to relevant research and studies.

Assignment - Operations
Management
2020
BSOM046 – Assignmnet 1
Management
2020
BSOM046 – Assignmnet 1
Paraphrase This Document
Need a fresh take? Get an instant paraphrase of this document with our AI Paraphraser

1
Table of Contents
LITERATURE REVIEW.............................................................................................................................2
ANALYSIS AND EVALUATION – A CASE STUDY.....................................................................................4
REFERENCES..........................................................................................................................................7
2
LITERATURE REVIEW
Introduction to SPC: Statistics is the process of collecting the data to infer the business
insights (Ryan, 2011). However, Statistical Process is the use of statistical tools and
techniques employed in the statistical model. And when these tool are used to ensure
quality control measures during the manufacturing process, known as Statistical Process
Control (SPC). The ultimate goal is to identify the real problem and taking corrective
measures to improve efficiency (Bunney and Dale, 1997).
History: A seasoned statistician “Walter. A, Shewhart” discovered the process of controlling
the quality of products during manufacturing processess in 1920 and termed it as “Statistical
Process Control”. Later on, in 1924, Shewhart unleashes the graphical presentation
identifying the problems in quality control, labelled them as “control charts”. The interesting
fact is that the applications of SPC were also used by the ordnance of the US Army during
the World War II. The Army corps were trained in using these tools to examine the variables
such as war equipments, guns, artillery etc. Later on, they also formed “American Society
for Quality Control” in 1945.
An extensive literature is available on SPC and its tool. Lizarelli et al., (2016) performed a
seminal systematic literature review on statistical process control researches undertaken in
the last 50 years. He founds that due to competitive industry and continuous improvement
in technology, SPC is in the limelight of total quality management. He also found that 90% of
the literature exists after 1990 which depicts that the concept gain more attention in last 20
– 30 years of continuous technology improvemenet and competition. He found three
renown associated terms “Control Charts”, “Multivariate Methods” and “non-parametric
methods” for the process quality control and monitoring.
SPC Approach and Techniques: Numerous tools have been introduced up till now as the
concept is an old one but keeping in view the enhanced global competitiveness, the tools
are refining continuously as all the variables in a process has statistical variability (Berger et
al., 2020). Control Charts are one of the oldest tool introduced by Shewhart, the pioneer of
SPC. Control charts are used for 2 purposes, (i) for the variable (ii) for attributes. The
exquisiteness of SPC is that it deals with the variation which is critical (Noor-ul-Amin, Tariq
and Hanif, 2019). One of the approaches is to deal with multiple variables in monitoring
using multivariate methods (Yeong et al., 2016). Apart from the statistical tools such as X-
⊘ This is a preview!⊘
Do you want full access?
Subscribe today to unlock all pages.
Trusted by 1+ million students worldwide
3
Bar charts, histogram, graphs, visual presentation, Lean Six-Sigma, and Business statistical
intelligence tools, the literature also shed light on various approaches imparting the SPC,
depending on the industry. For instance, Zhao and del Castillo, (2020) introduced an intrinsic
geometric approach for SPC in manifolding the surface. Sikder, Panja and Mukherjee, (2017)
suggested the multivariate SPC (MSPC) approach to determine and diagnose the out of
control points in manufacturing processes.
SPC Application: Various research has proven Statistical Process Control (SPC) as the
powerful statistical tool to improve the quality not only the manufacturing sector but also in
non-manufacturing sector. Abdul Halim Lim et al., (2017) found the productive usability of
SPC tools in the UK food industry to improve the food quality. (Sunder M and Antony, 2018)
proposed Lean Six Sigma tool to improve the education services. Moreover, (Gupta et al.,
2020) in his seminal research, was able to determine the causes behind the student's
dropout in higher education by using the SIX Sigma - SPC tool. Keeping in view the change in
customer’s demand, Gupta et al., (2018) used Six Sigma – DMAIC approach to curb the
issues in a tire-manufacturing company. Ilbeigi, (2019) proposed quantitative approach to
developing the transportation network by using SPC to detect the deviation points.
SPC in today’s Era: In today’s era, SPC has high significance in smart manufacturing
industries using big data analytics (He and Wang, 2018). However, few researchers and
statisticians are of the view that few SPC models need to be modified to get better results
(Qiu, 2017). With a rapid advancement of technology, the statistical model has to deal with
multiple variables, for that purpose that advance process deal with (MSPC) Multivariate
Statistical Process Control (Peres and Fogliatto, 2018) and coefficient of variaions (Guo and
Wang, 2018).
SPC Biggest Challenge: The input of the data is very important before using any statistical
tool and above all that the most important is the understanding of data. The world is
heading towards big data and it has been observed by the practitioners and researchers that
there is a lack of capability in understanding the complex big data (Fosso Wamba and Akter,
2019).
Paraphrase This Document
Need a fresh take? Get an instant paraphrase of this document with our AI Paraphraser
4
ANALYSIS AND EVALUATION – A CASE STUDY
Scenario: Waterside Leather Limited (WLL) has provided data over the four months (120
days) explains the temperature movement of effluent discharged by the tannery. It is
mentioned that the temperature is normally controlled in between the 25° C (Lower ranger
provided) and 30° C (Upper range). The maximum permitted limit of the temperature is 40°
C.
Background: In a manufacturing industry, Effluent discharge is liquid waste, not including
the domestic liquid waste such as toilet kitchen etc. To neutralize the pH of effluent, the
discharge is heated, for that purpose the temperature is need to be controlled. It is
pertinent to understand the impact of temperature here. The rise in temperature can kill
the microorganisms which are an issue for WLL. On the other hand, the lower temperature
can cause the slow-motion of bacteria which will slow down the manufacturing process.
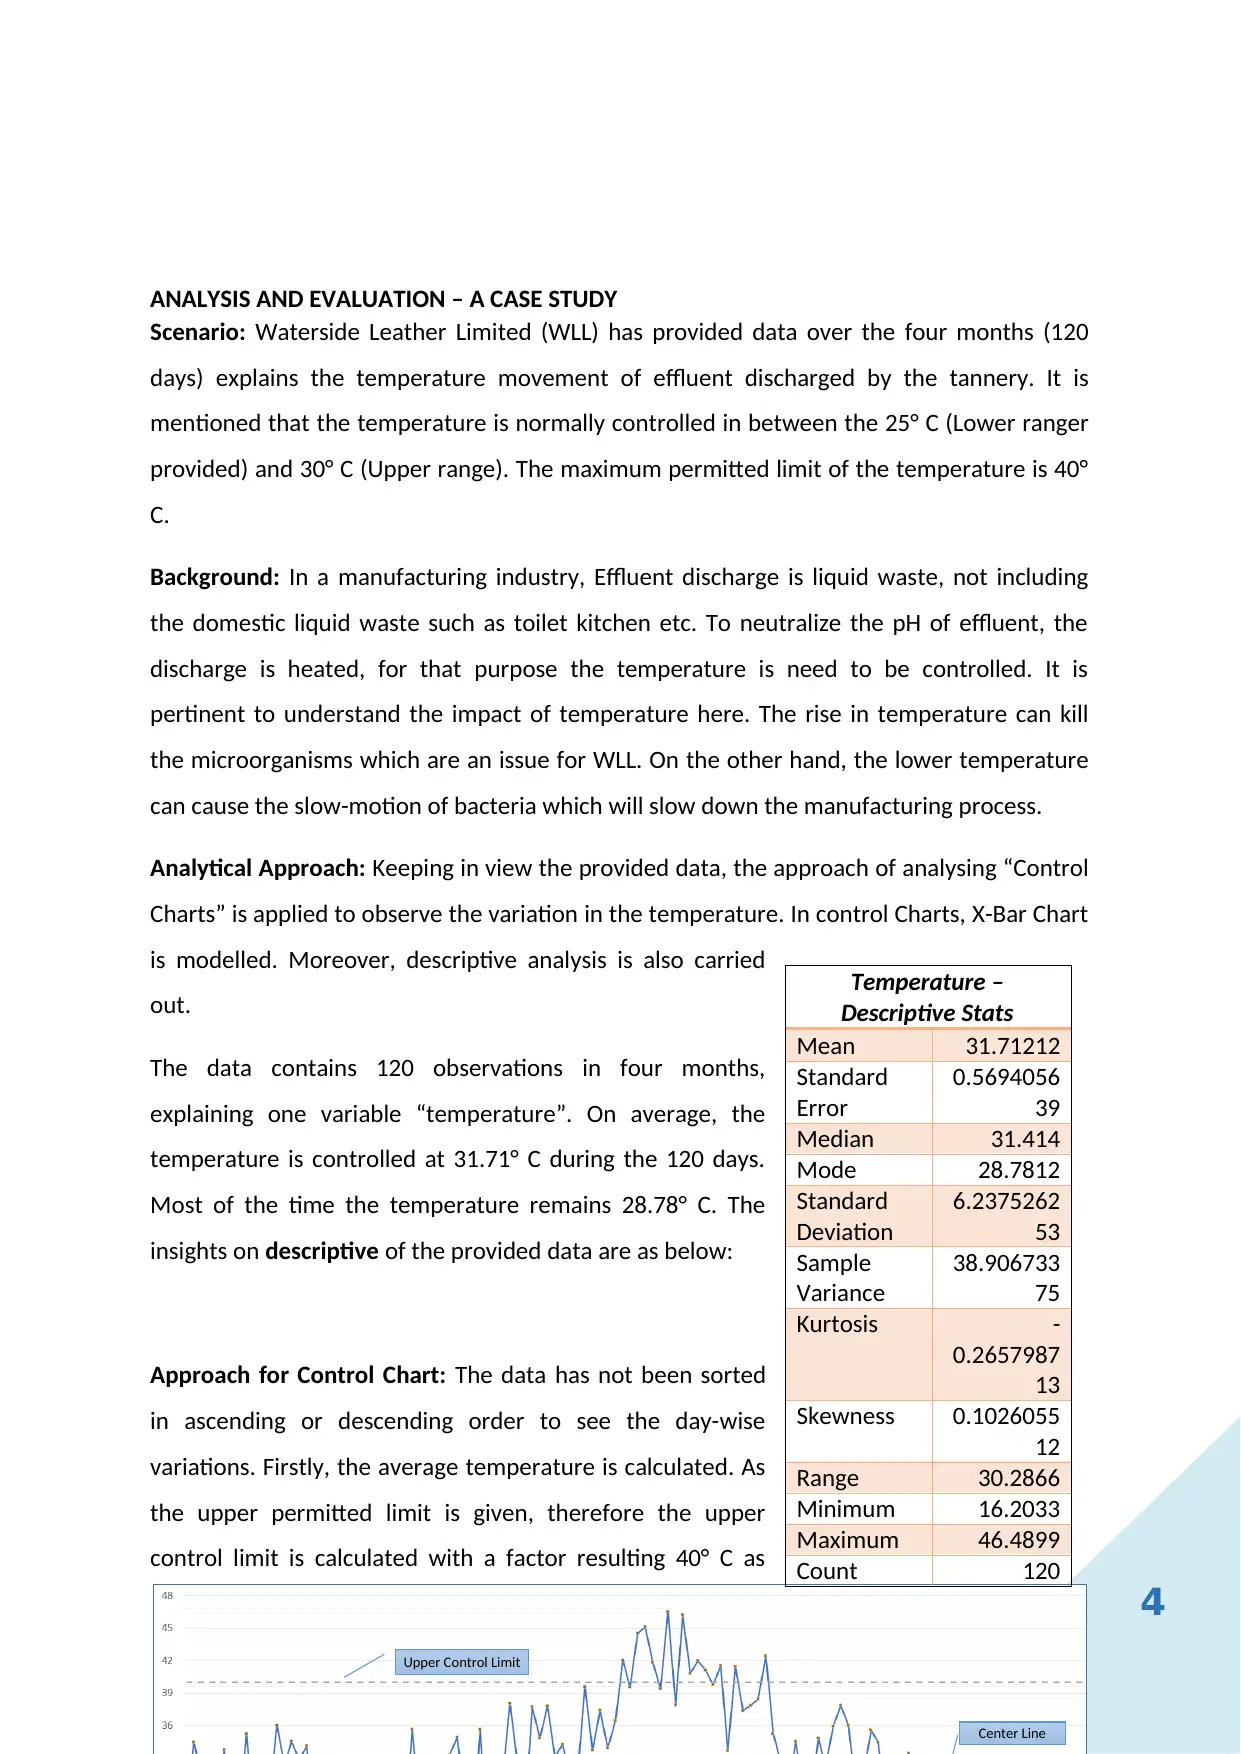
Analytical Approach: Keeping in view the provided data, the approach of analysing “Control
Charts” is applied to observe the variation in the temperature. In control Charts, X-Bar Chart
is modelled. Moreover, descriptive analysis is also carried
out.
The data contains 120 observations in four months,
explaining one variable “temperature”. On average, the
temperature is controlled at 31.71° C during the 120 days.
Most of the time the temperature remains 28.78° C. The
insights on descriptive of the provided data are as below:
Approach for Control Chart: The data has not been sorted
in ascending or descending order to see the day-wise
variations. Firstly, the average temperature is calculated. As
the upper permitted limit is given, therefore the upper
control limit is calculated with a factor resulting 40° C as
Upper Control Limit
Center Line
Temperature –
Descriptive Stats
Mean 31.71212
Standard
Error
0.5694056
39
Median 31.414
Mode 28.7812
Standard
Deviation
6.2375262
53
Sample
Variance
38.906733
75
Kurtosis -
0.2657987
13
Skewness 0.1026055
12
Range 30.2866
Minimum 16.2033
Maximum 46.4899
Count 120
ANALYSIS AND EVALUATION – A CASE STUDY
Scenario: Waterside Leather Limited (WLL) has provided data over the four months (120
days) explains the temperature movement of effluent discharged by the tannery. It is
mentioned that the temperature is normally controlled in between the 25° C (Lower ranger
provided) and 30° C (Upper range). The maximum permitted limit of the temperature is 40°
C.
Background: In a manufacturing industry, Effluent discharge is liquid waste, not including
the domestic liquid waste such as toilet kitchen etc. To neutralize the pH of effluent, the
discharge is heated, for that purpose the temperature is need to be controlled. It is
pertinent to understand the impact of temperature here. The rise in temperature can kill
the microorganisms which are an issue for WLL. On the other hand, the lower temperature
can cause the slow-motion of bacteria which will slow down the manufacturing process.
Analytical Approach: Keeping in view the provided data, the approach of analysing “Control
Charts” is applied to observe the variation in the temperature. In control Charts, X-Bar Chart
is modelled. Moreover, descriptive analysis is also carried
out.
The data contains 120 observations in four months,
explaining one variable “temperature”. On average, the
temperature is controlled at 31.71° C during the 120 days.
Most of the time the temperature remains 28.78° C. The
insights on descriptive of the provided data are as below:
Approach for Control Chart: The data has not been sorted
in ascending or descending order to see the day-wise
variations. Firstly, the average temperature is calculated. As
the upper permitted limit is given, therefore the upper
control limit is calculated with a factor resulting 40° C as
Upper Control Limit
Center Line
Temperature –
Descriptive Stats
Mean 31.71212
Standard
Error
0.5694056
39
Median 31.414
Mode 28.7812
Standard
Deviation
6.2375262
53
Sample
Variance
38.906733
75
Kurtosis -
0.2657987
13
Skewness 0.1026055
12
Range 30.2866
Minimum 16.2033
Maximum 46.4899
Count 120
5
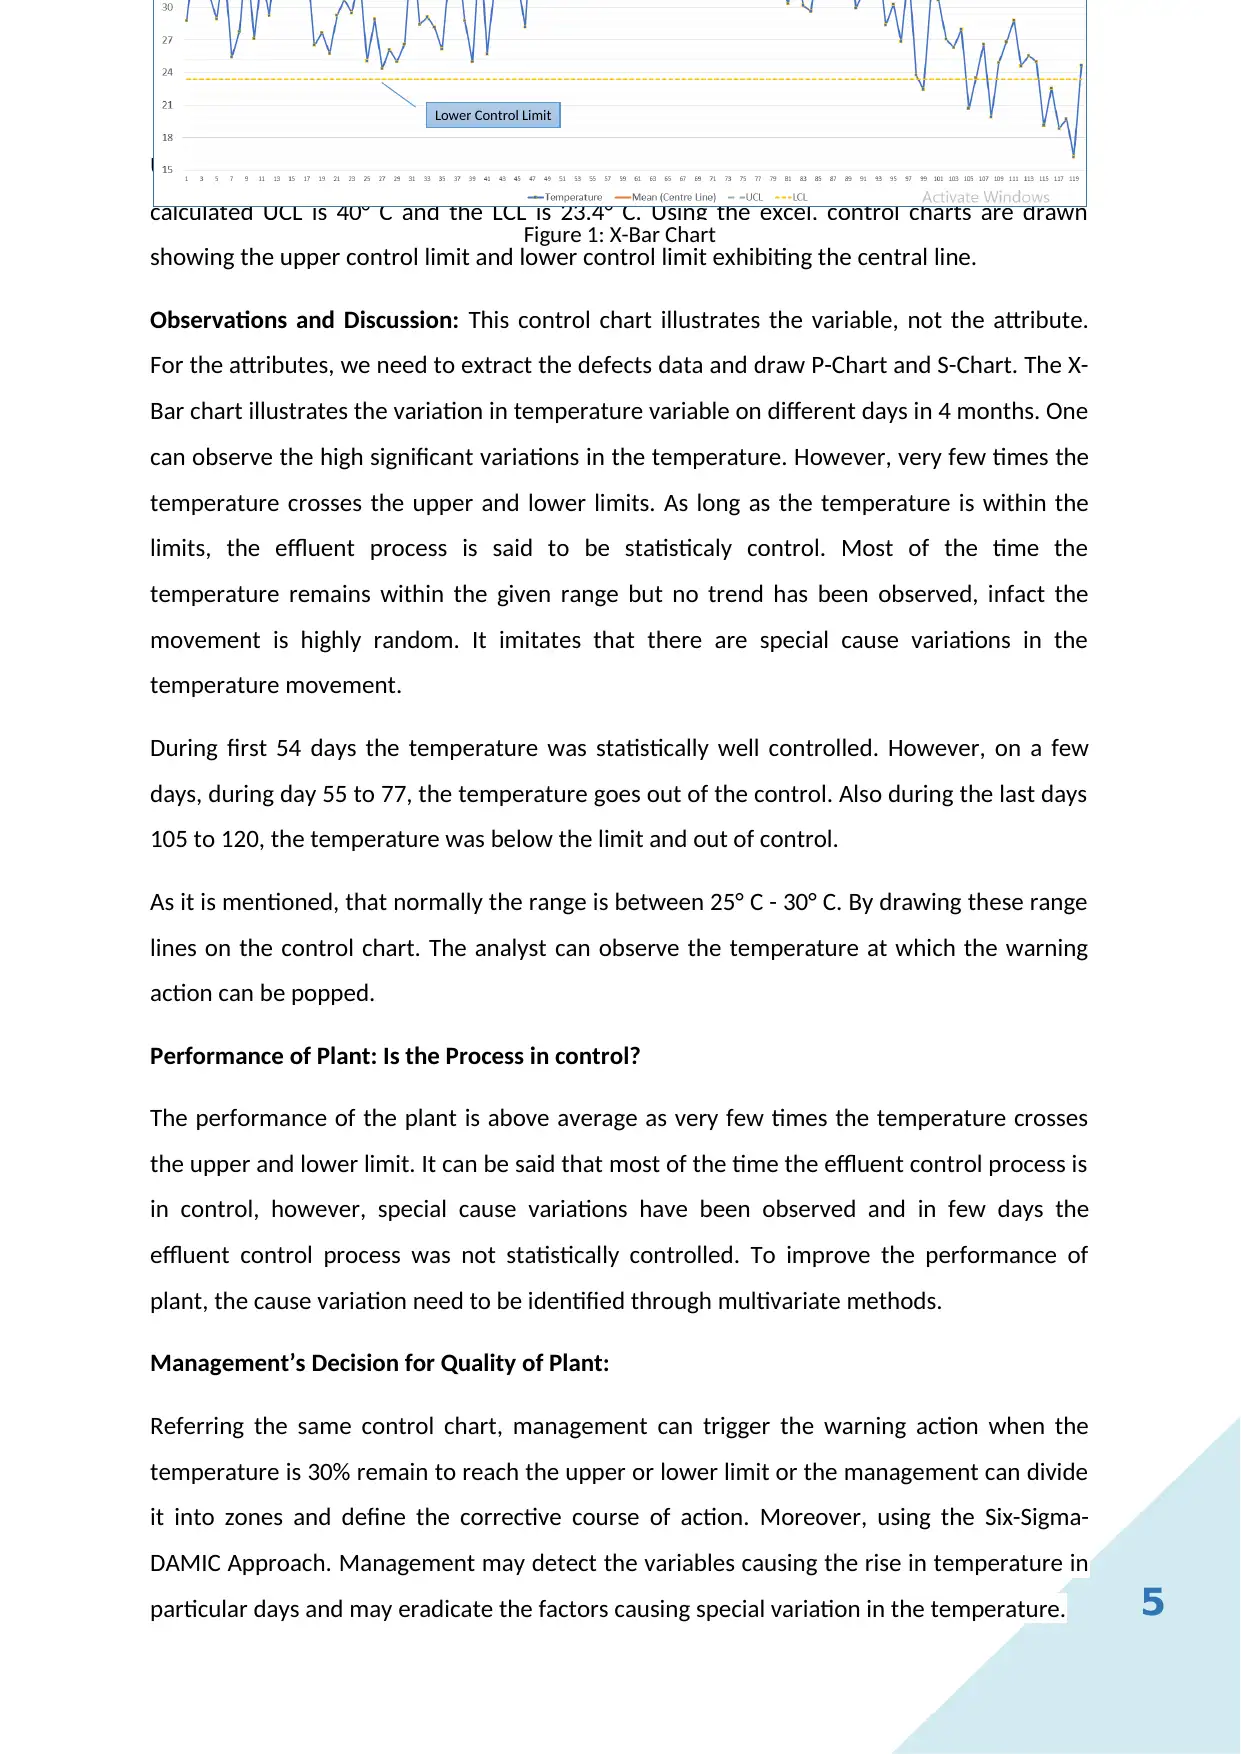
UCL. Putting the same factor in the formula, the lower control limit (LCL) is calculated. The
calculated UCL is 40° C and the LCL is 23.4° C. Using the excel, control charts are drawn
showing the upper control limit and lower control limit exhibiting the central line.
Observations and Discussion: This control chart illustrates the variable, not the attribute.
For the attributes, we need to extract the defects data and draw P-Chart and S-Chart. The X-
Bar chart illustrates the variation in temperature variable on different days in 4 months. One
can observe the high significant variations in the temperature. However, very few times the
temperature crosses the upper and lower limits. As long as the temperature is within the
limits, the effluent process is said to be statisticaly control. Most of the time the
temperature remains within the given range but no trend has been observed, infact the
movement is highly random. It imitates that there are special cause variations in the
temperature movement.
During first 54 days the temperature was statistically well controlled. However, on a few
days, during day 55 to 77, the temperature goes out of the control. Also during the last days
105 to 120, the temperature was below the limit and out of control.
As it is mentioned, that normally the range is between 25° C - 30° C. By drawing these range
lines on the control chart. The analyst can observe the temperature at which the warning
action can be popped.
Performance of Plant: Is the Process in control?
The performance of the plant is above average as very few times the temperature crosses
the upper and lower limit. It can be said that most of the time the effluent control process is
in control, however, special cause variations have been observed and in few days the
effluent control process was not statistically controlled. To improve the performance of
plant, the cause variation need to be identified through multivariate methods.
Management’s Decision for Quality of Plant:
Referring the same control chart, management can trigger the warning action when the
temperature is 30% remain to reach the upper or lower limit or the management can divide
it into zones and define the corrective course of action. Moreover, using the Six-Sigma-
DAMIC Approach. Management may detect the variables causing the rise in temperature in
particular days and may eradicate the factors causing special variation in the temperature.
Lower Control Limit
Figure 1: X-Bar Chart
⊘ This is a preview!⊘
Do you want full access?
Subscribe today to unlock all pages.
Trusted by 1+ million students worldwide

6
Keeping in view the industrial process, the WLL can install the massive chillers during those
days when there are chances of exceeding the temperature. Moreover, due to the special
variation, management may have employed the Multivariate method of SPC using the
coefficient of variations.
Keeping in view the industrial process, the WLL can install the massive chillers during those
days when there are chances of exceeding the temperature. Moreover, due to the special
variation, management may have employed the Multivariate method of SPC using the
coefficient of variations.
Paraphrase This Document
Need a fresh take? Get an instant paraphrase of this document with our AI Paraphraser
7
REFERENCES
Abdul Halim Lim, S. et al. (2017) ‘Critical observations on the statistical process control
implementation in the UK food industry: A survey’, International Journal of Quality and
Reliability Management. doi: 10.1108/IJQRM-03-2015-0035.
Berger, R. W. et al. (2020) ‘Process Capability’, in Statistical Process Control. doi:
10.4324/9781003065661-3.
Bunney, H. S. and Dale, B. G. (1997) ‘The implementation of quality management tools and
techniques: A study’, TQM Magazine. doi: 10.1108/09544789710168966.
Fosso Wamba, S. and Akter, S. (2019) ‘Understanding supply chain analytics capabilities and
agility for data-rich environments’, International Journal of Operations and Production
Management. doi: 10.1108/IJOPM-01-2019-0025.
Guo, B. and Wang, B. X. (2018) ‘Control charts for the coefficient of variation’, Statistical
Papers. doi: 10.1007/s00362-016-0797-0.
Gupta, S. K. et al. (2020) ‘Lean Six Sigma for reducing student dropouts in higher education–
an exploratory study’, Total Quality Management and Business Excellence. doi:
10.1080/14783363.2017.1422710.
Gupta, V. et al. (2018) ‘Six-sigma application in tire-manufacturing company: a case study’,
Journal of Industrial Engineering International. doi: 10.1007/s40092-017-0234-6.
He, Q. P. and Wang, J. (2018) ‘Statistical process monitoring as a big data analytics tool for
smart manufacturing’, Journal of Process Control. doi: 10.1016/j.jprocont.2017.06.012.
Ilbeigi, M. (2019) ‘Statistical process control for analyzing resilience of transportation
networks’, International Journal of Disaster Risk Reduction. doi: 10.1016/j.ijdrr.2018.10.002.
Lizarelli, F. L. et al. (2016) ‘A bibliometric analysis of 50 years of worldwide research on
statistical process control’, Gestao e Producao. doi: 10.1590/0104-530X1649-15.
Noor-ul-Amin, M., Tariq, S. and Hanif, M. (2019) ‘Control charts for simultaneously
monitoring of process mean and coefficient of variation with and without auxiliary
information’, Quality and Reliability Engineering International. doi: 10.1002/qre.2546.
Peres, F. A. P. and Fogliatto, F. S. (2018) ‘Variable selection methods in multivariate
statistical process control: A systematic literature review’, Computers and Industrial
Engineering. doi: 10.1016/j.cie.2017.12.006.
Qiu, P. (2017) ‘Statistical Process Control Charts as a Tool for Analyzing Big Data’, in. doi:
10.1007/978-3-319-41573-4_7.
Ryan, T. P. (2011) Statistical Methods for Quality Improvement: Third Edition, Statistical
Methods for Quality Improvement: Third Edition. doi: 10.1002/9781118058114.
Sikder, S., Panja, S. C. and Mukherjee, I. (2017) ‘An integrated approach for multivariate
statistical process control using Mahalanobis-Taguchi System and Andrews function’,
International Journal of Quality and Reliability Management. doi: 10.1108/IJQRM-11-2015-
0163.
Sunder M, V. and Antony, J. (2018) ‘A conceptual Lean Six Sigma framework for quality
excellence in higher education institutions’, International Journal of Quality and Reliability

8
Management. doi: 10.1108/IJQRM-01-2017-0002.
Yeong, W. C. et al. (2016) ‘A Control Chart for the Multivariate Coefficient of Variation’,
Quality and Reliability Engineering International. doi: 10.1002/qre.1828.
Zhao, X. and del Castillo, E. (2020) ‘An Intrinsic Geometrical Approach for Statistical Process
Control of Surface and Manifold Data’, Technometrics. doi:
10.1080/00401706.2020.1772114.
⊘ This is a preview!⊘
Do you want full access?
Subscribe today to unlock all pages.
Trusted by 1+ million students worldwide
1 out of 9
Related Documents


Your All-in-One AI-Powered Toolkit for Academic Success.
+13062052269
info@desklib.com
Available 24*7 on WhatsApp / Email
![[object Object]](/_next/static/media/star-bottom.7253800d.svg)
Unlock your academic potential
Copyright © 2020–2026 A2Z Services. All Rights Reserved. Developed and managed by ZUCOL.