Operations Management Assignment - Forecasting and Control

Verified

Added on  2022/08/25

|7
|595
|20
Homework Assignment
AI Summary
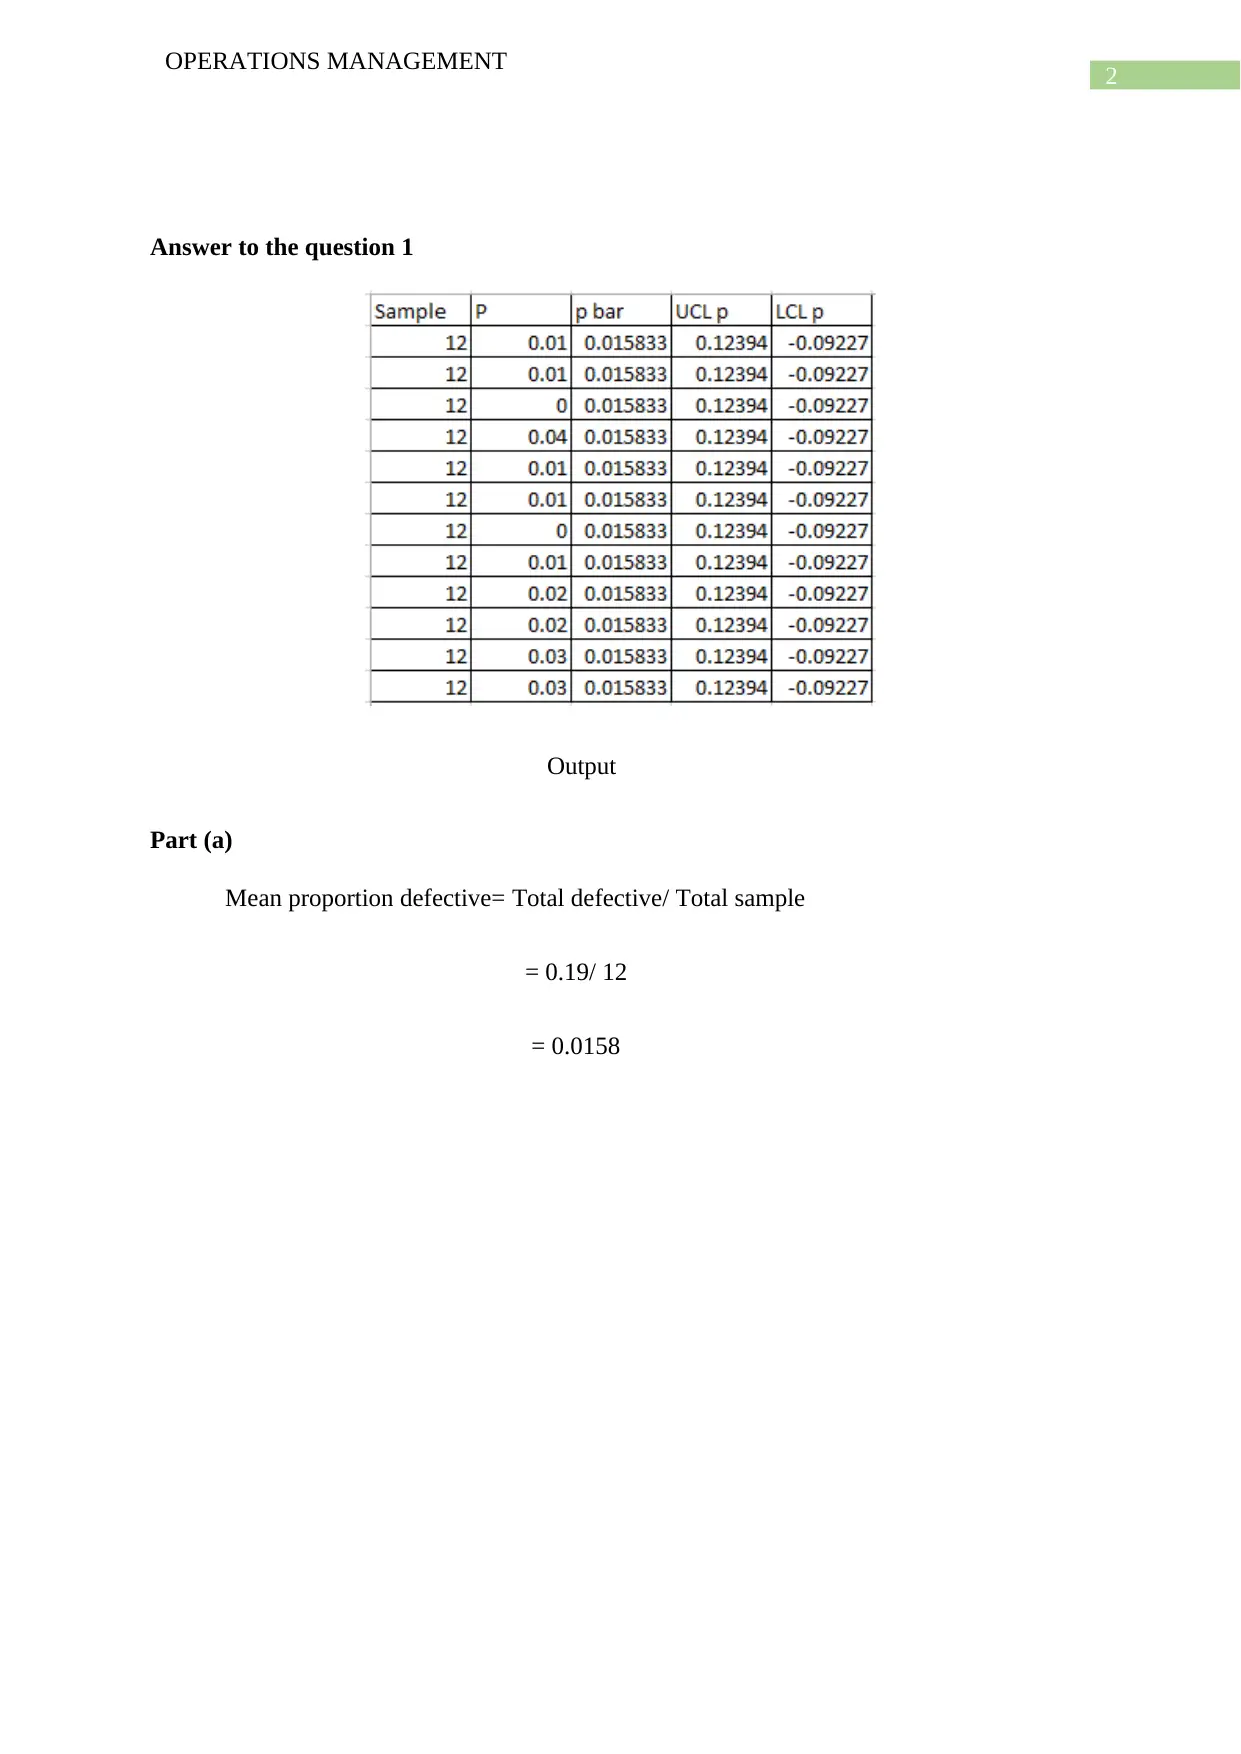
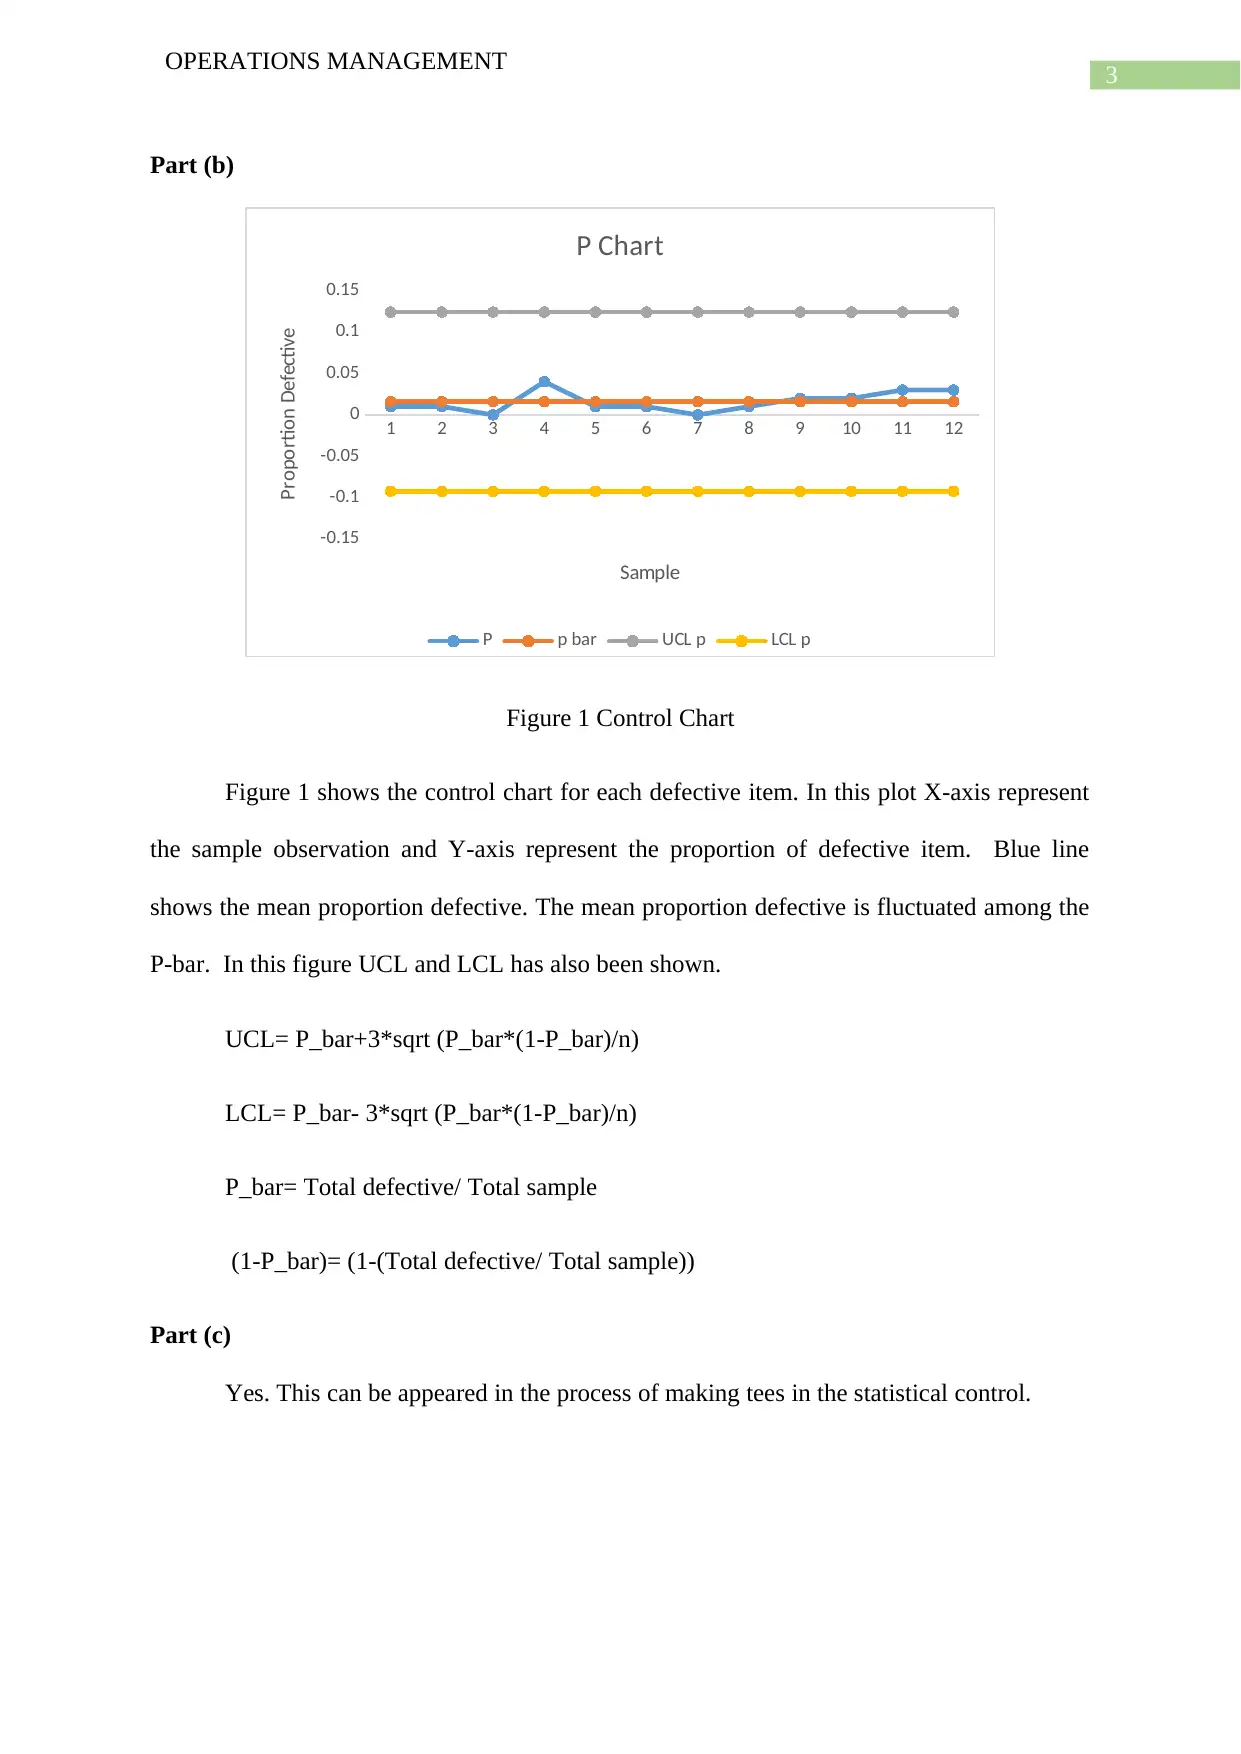
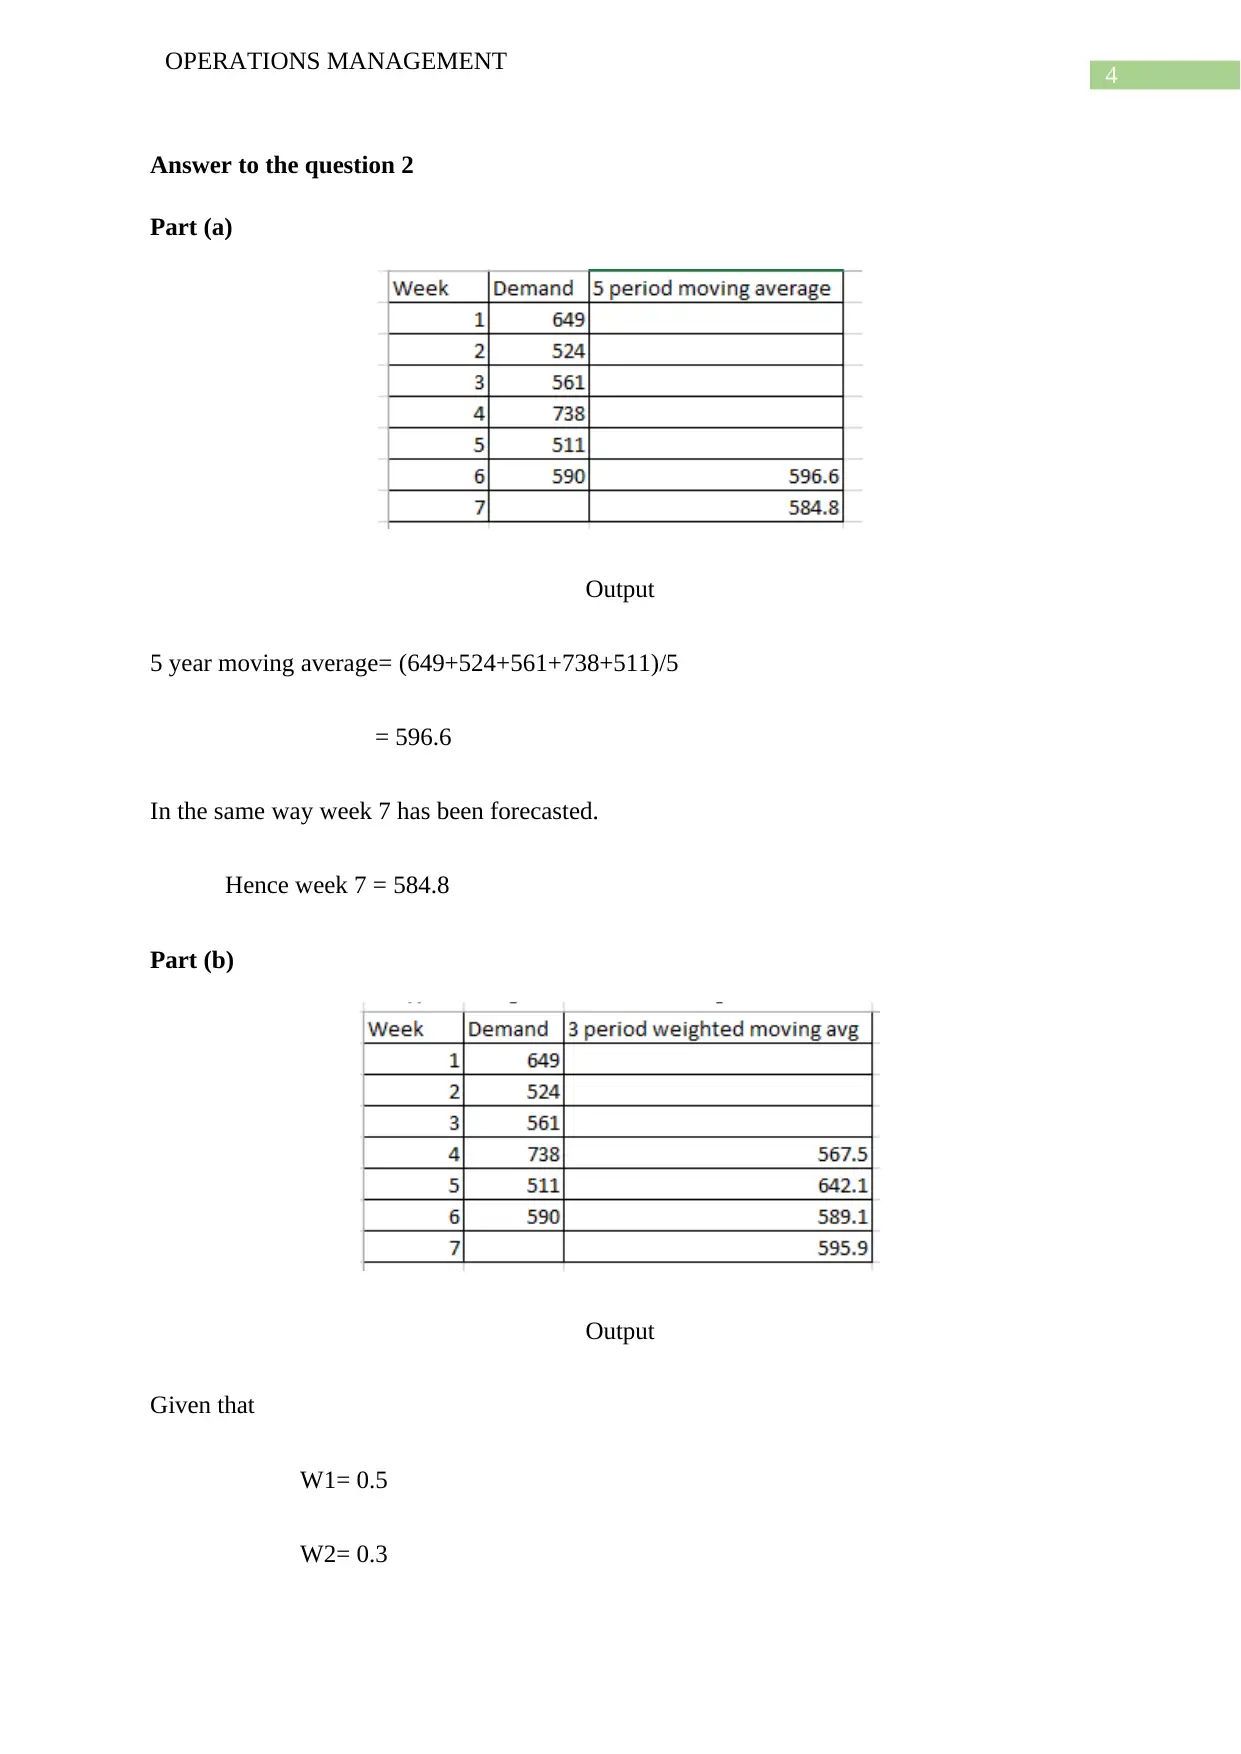
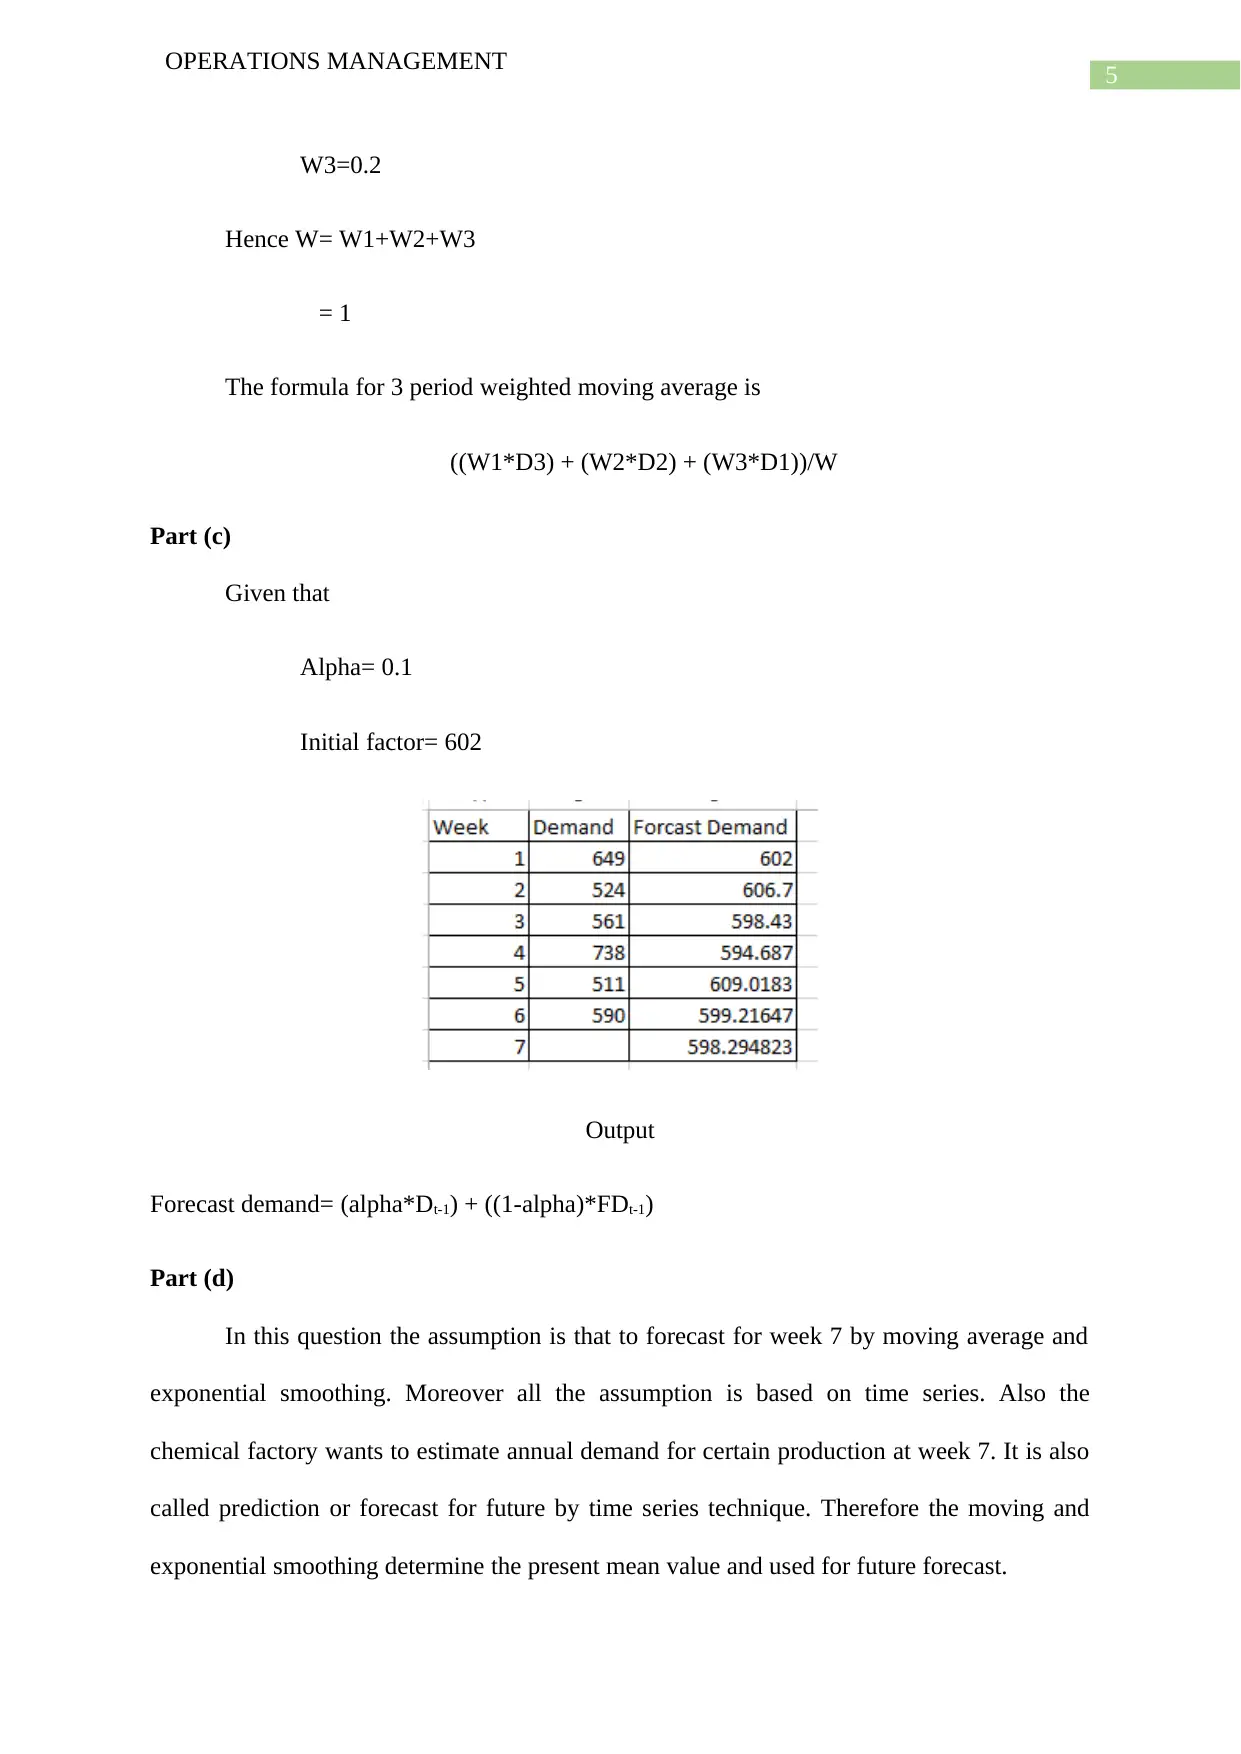
This Operations Management assignment solution addresses two key questions focusing on forecasting and statistical process control. The first question involves calculating the mean proportion of defective items and constructing a control chart (p-chart) to assess process stability. The analysis determines if the process is in statistical control. The second question explores forecasting techniques, including 5-year moving averages, weighted moving averages, and exponential smoothing. The solution provides outputs for each method and discusses the underlying assumptions related to time series analysis, aiming to forecast future demand for a chemical factory's production. The assignment demonstrates the application of these techniques to predict future values and optimize production objectives. The assignment also includes a bibliography of relevant academic sources.
Document Page
Running head: OPERATIONS MANAGEMENT
Operations Management
Name of the student:
Name of the University:
Author note:
tabler-icon-diamond-filled.svg

Paraphrase This Document

Need a fresh take? Get an instant paraphrase of this document with our AI Paraphraser
Document Page
1
OPERATIONS MANAGEMENT
Table of Contents
Answer to the question 1............................................................................................................2
Part (a)....................................................................................................................................2
Part (b)....................................................................................................................................3
Part (c)....................................................................................................................................3
Answer to the question 2........................................................................................................4
Part (a)....................................................................................................................................4
Part (b)....................................................................................................................................4
Part (c)....................................................................................................................................5
Part (d)....................................................................................................................................5
Bibliography...............................................................................................................................6
Document Page
2
OPERATIONS MANAGEMENT
Answer to the question 1
Output
Part (a)
Mean proportion defective= Total defective/ Total sample
= 0.19/ 12
= 0.0158
Document Page
3
OPERATIONS MANAGEMENT
Part (b)
1 2 3 4 5 6 7 8 9 10 11 12
-0.15
-0.1
-0.05
0
0.05
0.1
0.15
P Chart
P p bar UCL p LCL p
Sample
Proportion Defective
Figure 1 Control Chart
Figure 1 shows the control chart for each defective item. In this plot X-axis represent
the sample observation and Y-axis represent the proportion of defective item. Blue line
shows the mean proportion defective. The mean proportion defective is fluctuated among the
P-bar. In this figure UCL and LCL has also been shown.
UCL= P_bar+3*sqrt (P_bar*(1-P_bar)/n)
LCL= P_bar- 3*sqrt (P_bar*(1-P_bar)/n)
P_bar= Total defective/ Total sample
(1-P_bar)= (1-(Total defective/ Total sample))
Part (c)
Yes. This can be appeared in the process of making tees in the statistical control.
tabler-icon-diamond-filled.svg

Paraphrase This Document

Need a fresh take? Get an instant paraphrase of this document with our AI Paraphraser
Document Page
4
OPERATIONS MANAGEMENT
Answer to the question 2
Part (a)
Output
5 year moving average= (649+524+561+738+511)/5
= 596.6
In the same way week 7 has been forecasted.
Hence week 7 = 584.8
Part (b)
Output
Given that
W1= 0.5
W2= 0.3
Document Page
5
OPERATIONS MANAGEMENT
W3=0.2
Hence W= W1+W2+W3
= 1
The formula for 3 period weighted moving average is
((W1*D3) + (W2*D2) + (W3*D1))/W
Part (c)
Given that
Alpha= 0.1
Initial factor= 602
Output
Forecast demand= (alpha*Dt-1) + ((1-alpha)*FDt-1)
Part (d)
In this question the assumption is that to forecast for week 7 by moving average and
exponential smoothing. Moreover all the assumption is based on time series. Also the
chemical factory wants to estimate annual demand for certain production at week 7. It is also
called prediction or forecast for future by time series technique. Therefore the moving and
exponential smoothing determine the present mean value and used for future forecast.
Document Page
6
OPERATIONS MANAGEMENT
Bibliography
Ahsan, M., Mashuri, M., & Khusna, H. (2017). Evaluation of Laney p’Chart Performance.
International Journal of Applied Engineering Research, 12(24), 14208-14217.
Hou, C. D., Shao, Y. E., & Huang, S. (2013). A combined MLE and generalized P chart
approach to estimate the change point of a multinomial process. Applied Mathematics
& Information Sciences, 7(4), 1487.
Kuremoto, T., Kimura, S., Kobayashi, K., & Obayashi, M. (2014). Time series forecasting
using a deep belief network with restricted Boltzmann machines. Neurocomputing,
137, 47-56.
Wang, W. C., Chau, K. W., Xu, D. M., & Chen, X. Y. (2015). Improving forecasting
accuracy of annual runoff time series using ARIMA based on EEMD decomposition.
Water Resources Management, 29(8), 2655-2675.
chevron_up_icon
1 out of 7
circle_padding
hide_on_mobile
zoom_out_icon
[object Object]