Asset Allocation Report: Risk, Return and Portfolio Construction
VerifiedAdded on 2022/08/24
|14
|3072
|17
Report
AI Summary
This report delves into the intricacies of asset allocation and portfolio construction, analyzing five broad asset classes over a 20-year period to construct an optimal portfolio. The analysis includes a statistical examination of asset class performance, considering minimum and maximum returns, arithmetic means, and standard deviations to assess risk and volatility. The report also explores the relationships between asset classes using correlation and covariance metrics, highlighting diversification benefits. Furthermore, it constructs an efficient frontier and capital allocation line to determine the optimal portfolio, emphasizing the maximization of the Sharpe Ratio. The report provides an overview of the modern portfolio theory, discussing its application and limitations, including diversification failures during market crashes and the importance of considering higher-order moments. The report references academic papers, and uses these insights to enhance the understanding of asset allocation and its significance in achieving investment objectives.

Running head: ASSET ALLOCATION
Asset Allocation
Name of the Student:
Name of the University:
Author Note:
Asset Allocation
Name of the Student:
Name of the University:
Author Note:
Paraphrase This Document
Need a fresh take? Get an instant paraphrase of this document with our AI Paraphraser
1ASSET ALLOCATION
Table of Contents
Introduction:...............................................................................................................................2
Discussion:.................................................................................................................................2
Analysis of the asset classes:..................................................................................................2
Performance analysis of the asset class:.................................................................................4
Relationship of the asset class:...............................................................................................5
Portfolio Construction:...........................................................................................................6
Analysis of the Modern Portfolio Theory:.............................................................................8
Conclusion:..............................................................................................................................10
References:...............................................................................................................................11
2ASSET ALLOCATION
Introduction:
The management of a portfolio involves several steps which needs to be undertaken
before the construction of a portfolio. The portfolio management process starts with the
selection of classes of assets which is to be incorporated in the portfolio. Thus the assets
which is to be incorporated is an important aspect, followed by security selection as per the
requirements of the investment policy statement. The investment policy statement states the
risk and return profile of the investor, for whom the portfolio is being constructed. The
portfolio thus constructed needs to be the optimal portfolio for the client at the desired level
of risk and generating return (Výrost, Lyócsa and Baumöhl 2019).
Thus in this report a portfolio consisting of five broad asset classes is analysed over a
20 year time horizon and an optimal portfolio is constructed with the return and risk
generated from the asset class. The Markowitz efficient frontier is constructed and analysed
in regards to the optimal portfolio selected using the risk return profile of the investor.
Thus the modern portfolio theory is discussed providing insights to significant terms
which are used in the management of portfolio or the construction of the portfolio (Roberts
2018).
Discussion:
Analysis of the asset classes:
Thus the asset classes which are being considered with which an optimal portfolio
consisting of these asset classes are highlighted in the following points with a brief
description of each asset class.
⊘ This is a preview!⊘
Do you want full access?
Subscribe today to unlock all pages.
Trusted by 1+ million students worldwide
3ASSET ALLOCATION
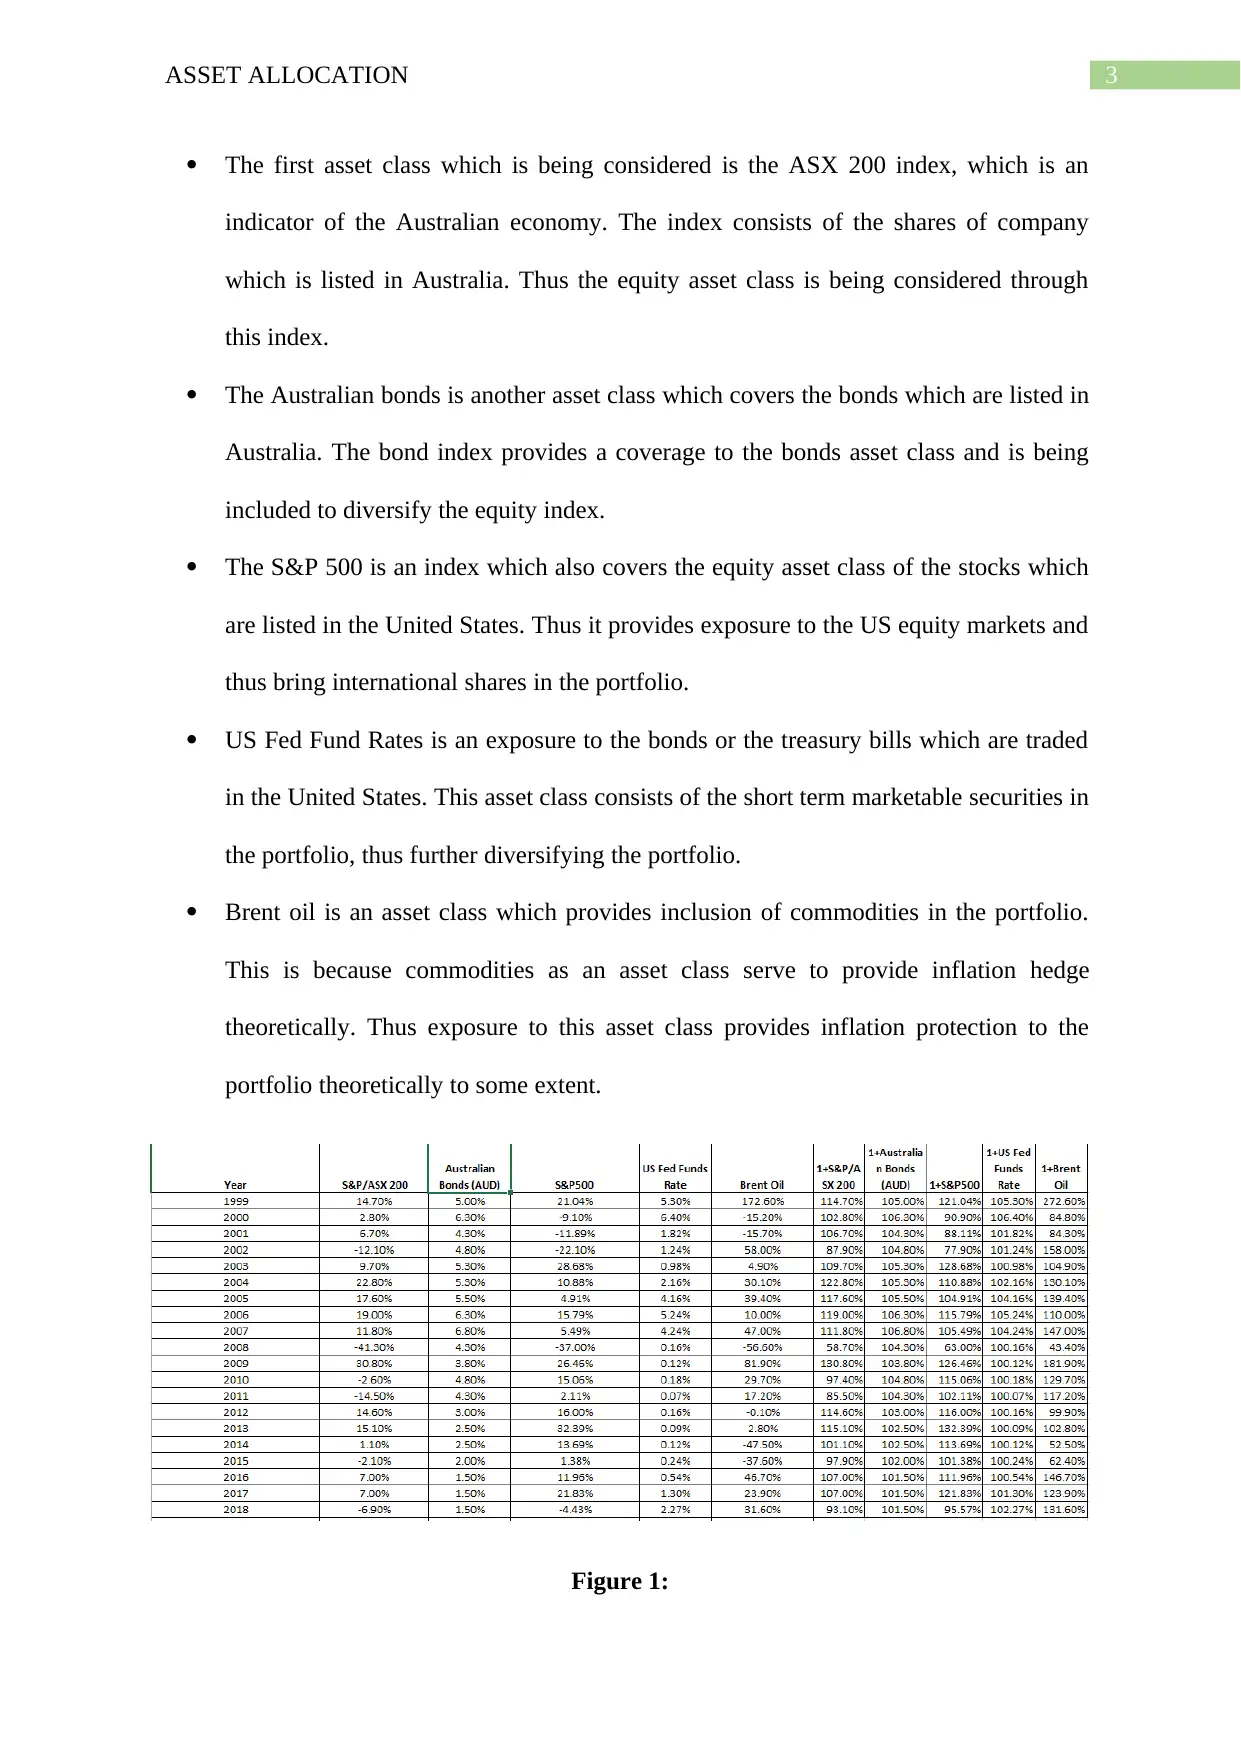
The first asset class which is being considered is the ASX 200 index, which is an
indicator of the Australian economy. The index consists of the shares of company
which is listed in Australia. Thus the equity asset class is being considered through
this index.
The Australian bonds is another asset class which covers the bonds which are listed in
Australia. The bond index provides a coverage to the bonds asset class and is being
included to diversify the equity index.
The S&P 500 is an index which also covers the equity asset class of the stocks which
are listed in the United States. Thus it provides exposure to the US equity markets and
thus bring international shares in the portfolio.
US Fed Fund Rates is an exposure to the bonds or the treasury bills which are traded
in the United States. This asset class consists of the short term marketable securities in
the portfolio, thus further diversifying the portfolio.
Brent oil is an asset class which provides inclusion of commodities in the portfolio.
This is because commodities as an asset class serve to provide inflation hedge
theoretically. Thus exposure to this asset class provides inflation protection to the
portfolio theoretically to some extent.
Figure 1:
Paraphrase This Document
Need a fresh take? Get an instant paraphrase of this document with our AI Paraphraser
4ASSET ALLOCATION
Source:
Performance analysis of the asset class:
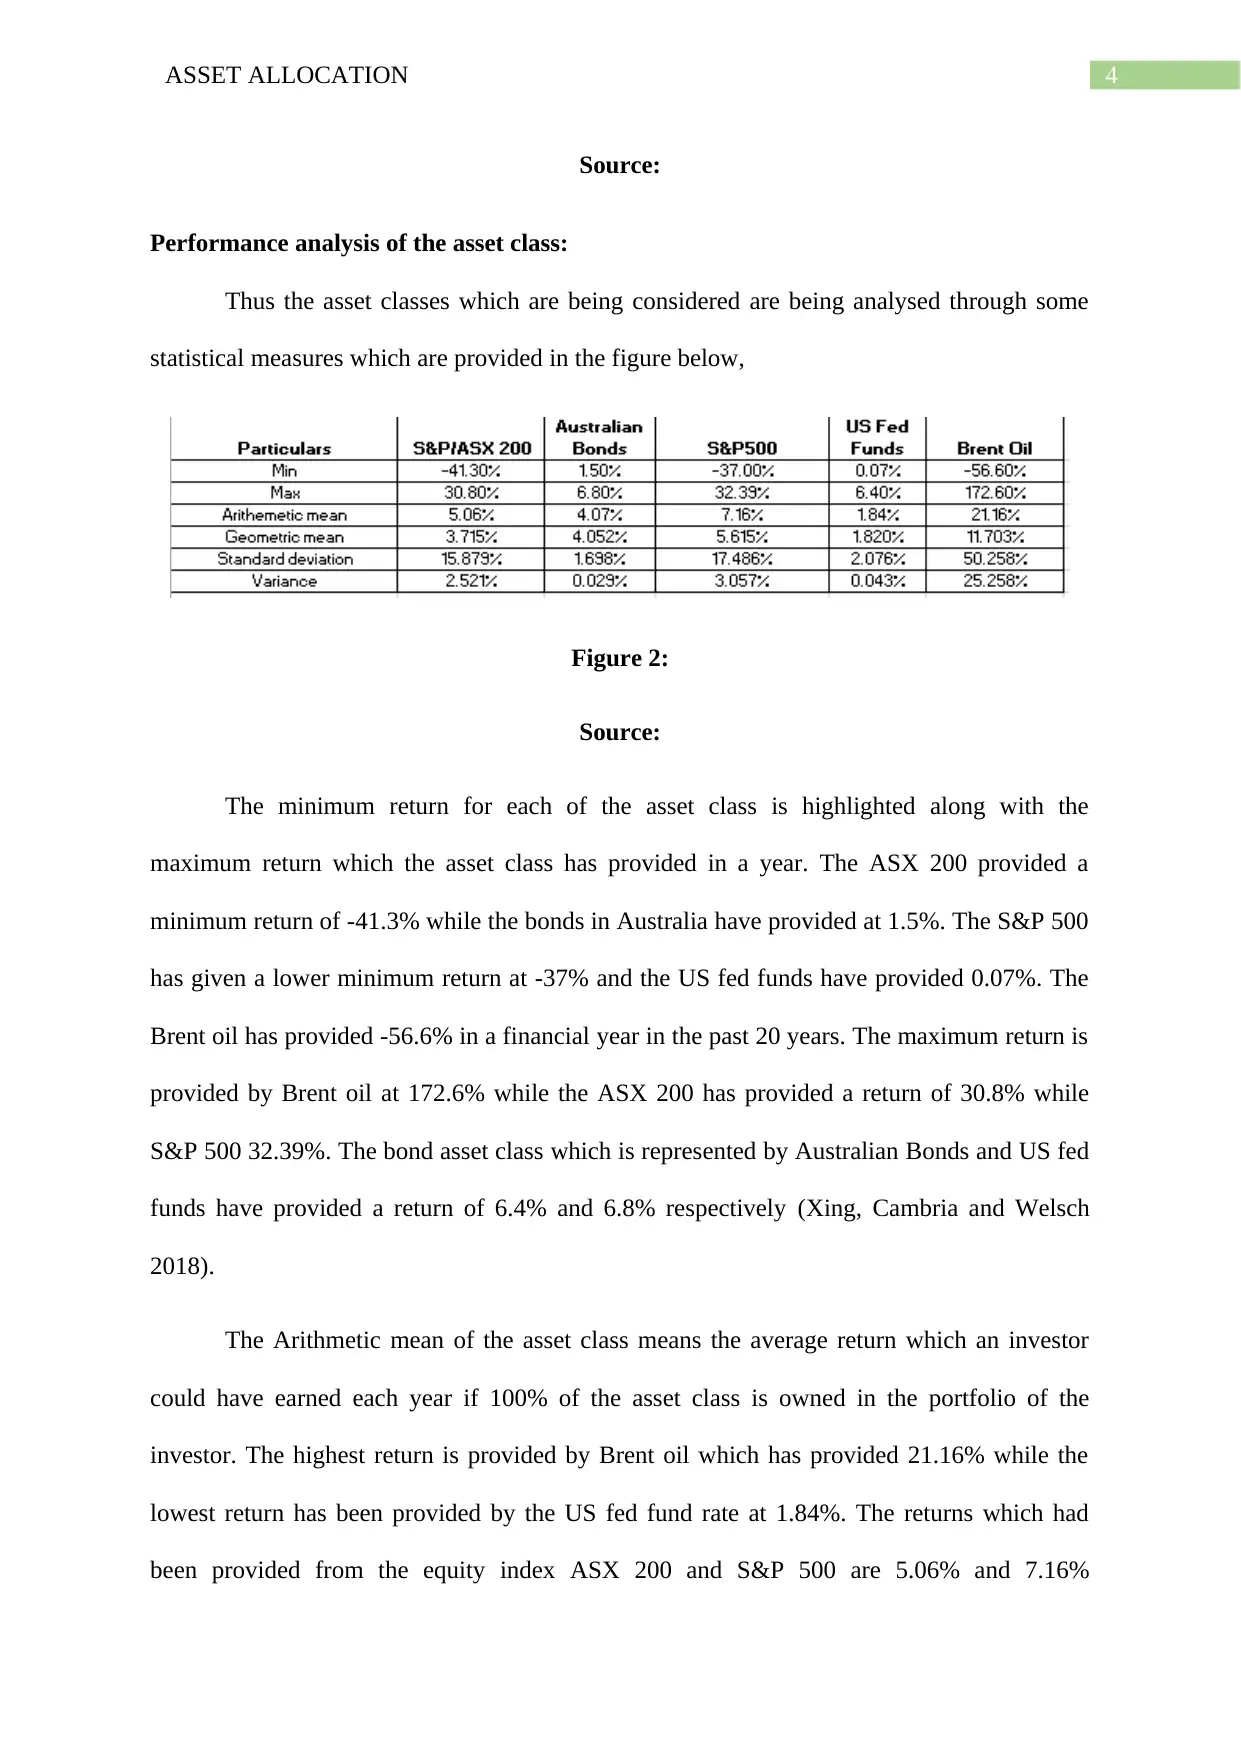
Thus the asset classes which are being considered are being analysed through some
statistical measures which are provided in the figure below,
Figure 2:
Source:
The minimum return for each of the asset class is highlighted along with the
maximum return which the asset class has provided in a year. The ASX 200 provided a
minimum return of -41.3% while the bonds in Australia have provided at 1.5%. The S&P 500
has given a lower minimum return at -37% and the US fed funds have provided 0.07%. The
Brent oil has provided -56.6% in a financial year in the past 20 years. The maximum return is
provided by Brent oil at 172.6% while the ASX 200 has provided a return of 30.8% while
S&P 500 32.39%. The bond asset class which is represented by Australian Bonds and US fed
funds have provided a return of 6.4% and 6.8% respectively (Xing, Cambria and Welsch
2018).
The Arithmetic mean of the asset class means the average return which an investor
could have earned each year if 100% of the asset class is owned in the portfolio of the
investor. The highest return is provided by Brent oil which has provided 21.16% while the
lowest return has been provided by the US fed fund rate at 1.84%. The returns which had
been provided from the equity index ASX 200 and S&P 500 are 5.06% and 7.16%
Source:
Performance analysis of the asset class:
Thus the asset classes which are being considered are being analysed through some
statistical measures which are provided in the figure below,
Figure 2:
Source:
The minimum return for each of the asset class is highlighted along with the
maximum return which the asset class has provided in a year. The ASX 200 provided a
minimum return of -41.3% while the bonds in Australia have provided at 1.5%. The S&P 500
has given a lower minimum return at -37% and the US fed funds have provided 0.07%. The
Brent oil has provided -56.6% in a financial year in the past 20 years. The maximum return is
provided by Brent oil at 172.6% while the ASX 200 has provided a return of 30.8% while
S&P 500 32.39%. The bond asset class which is represented by Australian Bonds and US fed
funds have provided a return of 6.4% and 6.8% respectively (Xing, Cambria and Welsch
2018).
The Arithmetic mean of the asset class means the average return which an investor
could have earned each year if 100% of the asset class is owned in the portfolio of the
investor. The highest return is provided by Brent oil which has provided 21.16% while the
lowest return has been provided by the US fed fund rate at 1.84%. The returns which had
been provided from the equity index ASX 200 and S&P 500 are 5.06% and 7.16%
5ASSET ALLOCATION
respectively. The Australian bonds have provided a return of 4.07% (Graham and Harvey
2018).
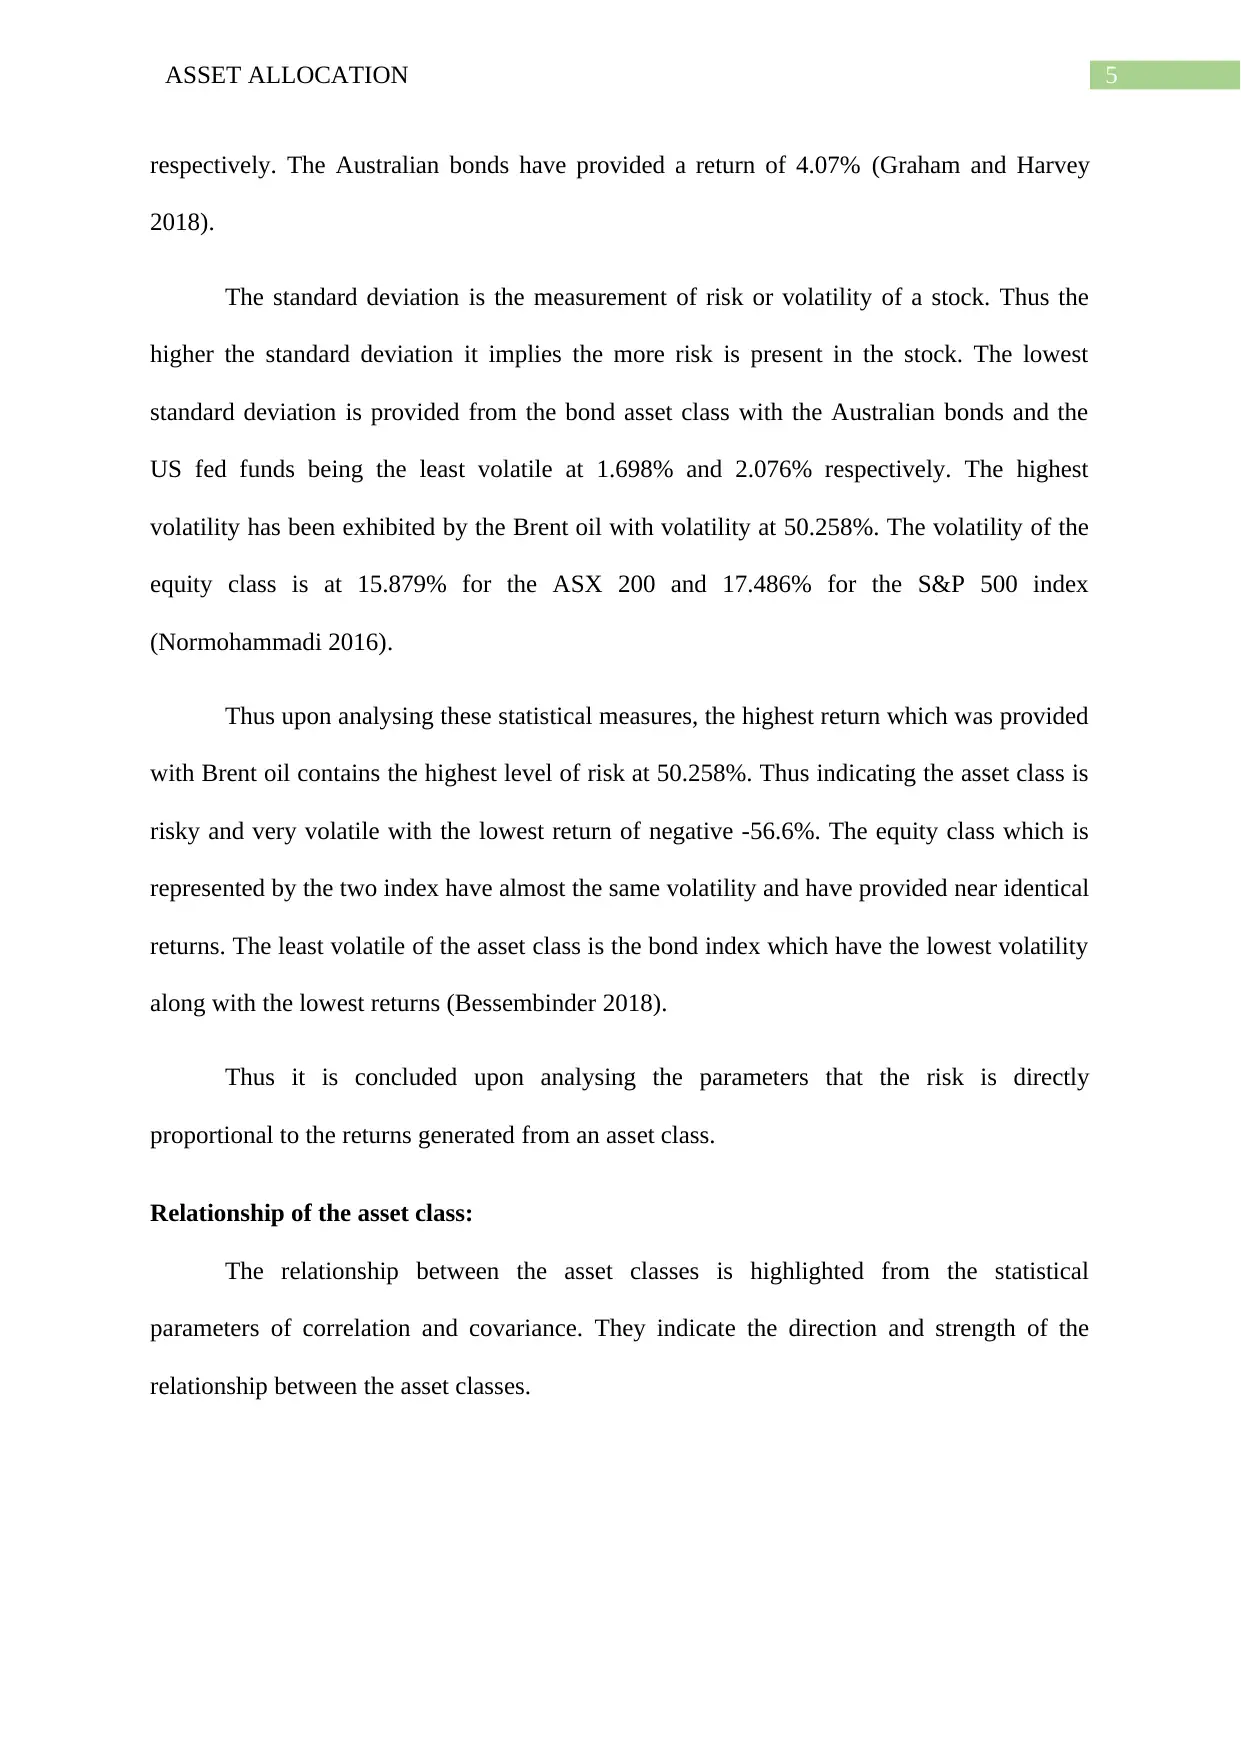
The standard deviation is the measurement of risk or volatility of a stock. Thus the
higher the standard deviation it implies the more risk is present in the stock. The lowest
standard deviation is provided from the bond asset class with the Australian bonds and the
US fed funds being the least volatile at 1.698% and 2.076% respectively. The highest
volatility has been exhibited by the Brent oil with volatility at 50.258%. The volatility of the
equity class is at 15.879% for the ASX 200 and 17.486% for the S&P 500 index
(Normohammadi 2016).
Thus upon analysing these statistical measures, the highest return which was provided
with Brent oil contains the highest level of risk at 50.258%. Thus indicating the asset class is
risky and very volatile with the lowest return of negative -56.6%. The equity class which is
represented by the two index have almost the same volatility and have provided near identical
returns. The least volatile of the asset class is the bond index which have the lowest volatility
along with the lowest returns (Bessembinder 2018).
Thus it is concluded upon analysing the parameters that the risk is directly
proportional to the returns generated from an asset class.
Relationship of the asset class:
The relationship between the asset classes is highlighted from the statistical
parameters of correlation and covariance. They indicate the direction and strength of the
relationship between the asset classes.
respectively. The Australian bonds have provided a return of 4.07% (Graham and Harvey
2018).
The standard deviation is the measurement of risk or volatility of a stock. Thus the
higher the standard deviation it implies the more risk is present in the stock. The lowest
standard deviation is provided from the bond asset class with the Australian bonds and the
US fed funds being the least volatile at 1.698% and 2.076% respectively. The highest
volatility has been exhibited by the Brent oil with volatility at 50.258%. The volatility of the
equity class is at 15.879% for the ASX 200 and 17.486% for the S&P 500 index
(Normohammadi 2016).
Thus upon analysing these statistical measures, the highest return which was provided
with Brent oil contains the highest level of risk at 50.258%. Thus indicating the asset class is
risky and very volatile with the lowest return of negative -56.6%. The equity class which is
represented by the two index have almost the same volatility and have provided near identical
returns. The least volatile of the asset class is the bond index which have the lowest volatility
along with the lowest returns (Bessembinder 2018).
Thus it is concluded upon analysing the parameters that the risk is directly
proportional to the returns generated from an asset class.
Relationship of the asset class:
The relationship between the asset classes is highlighted from the statistical
parameters of correlation and covariance. They indicate the direction and strength of the
relationship between the asset classes.
⊘ This is a preview!⊘
Do you want full access?
Subscribe today to unlock all pages.
Trusted by 1+ million students worldwide
6ASSET ALLOCATION
Figure 3:
Source:
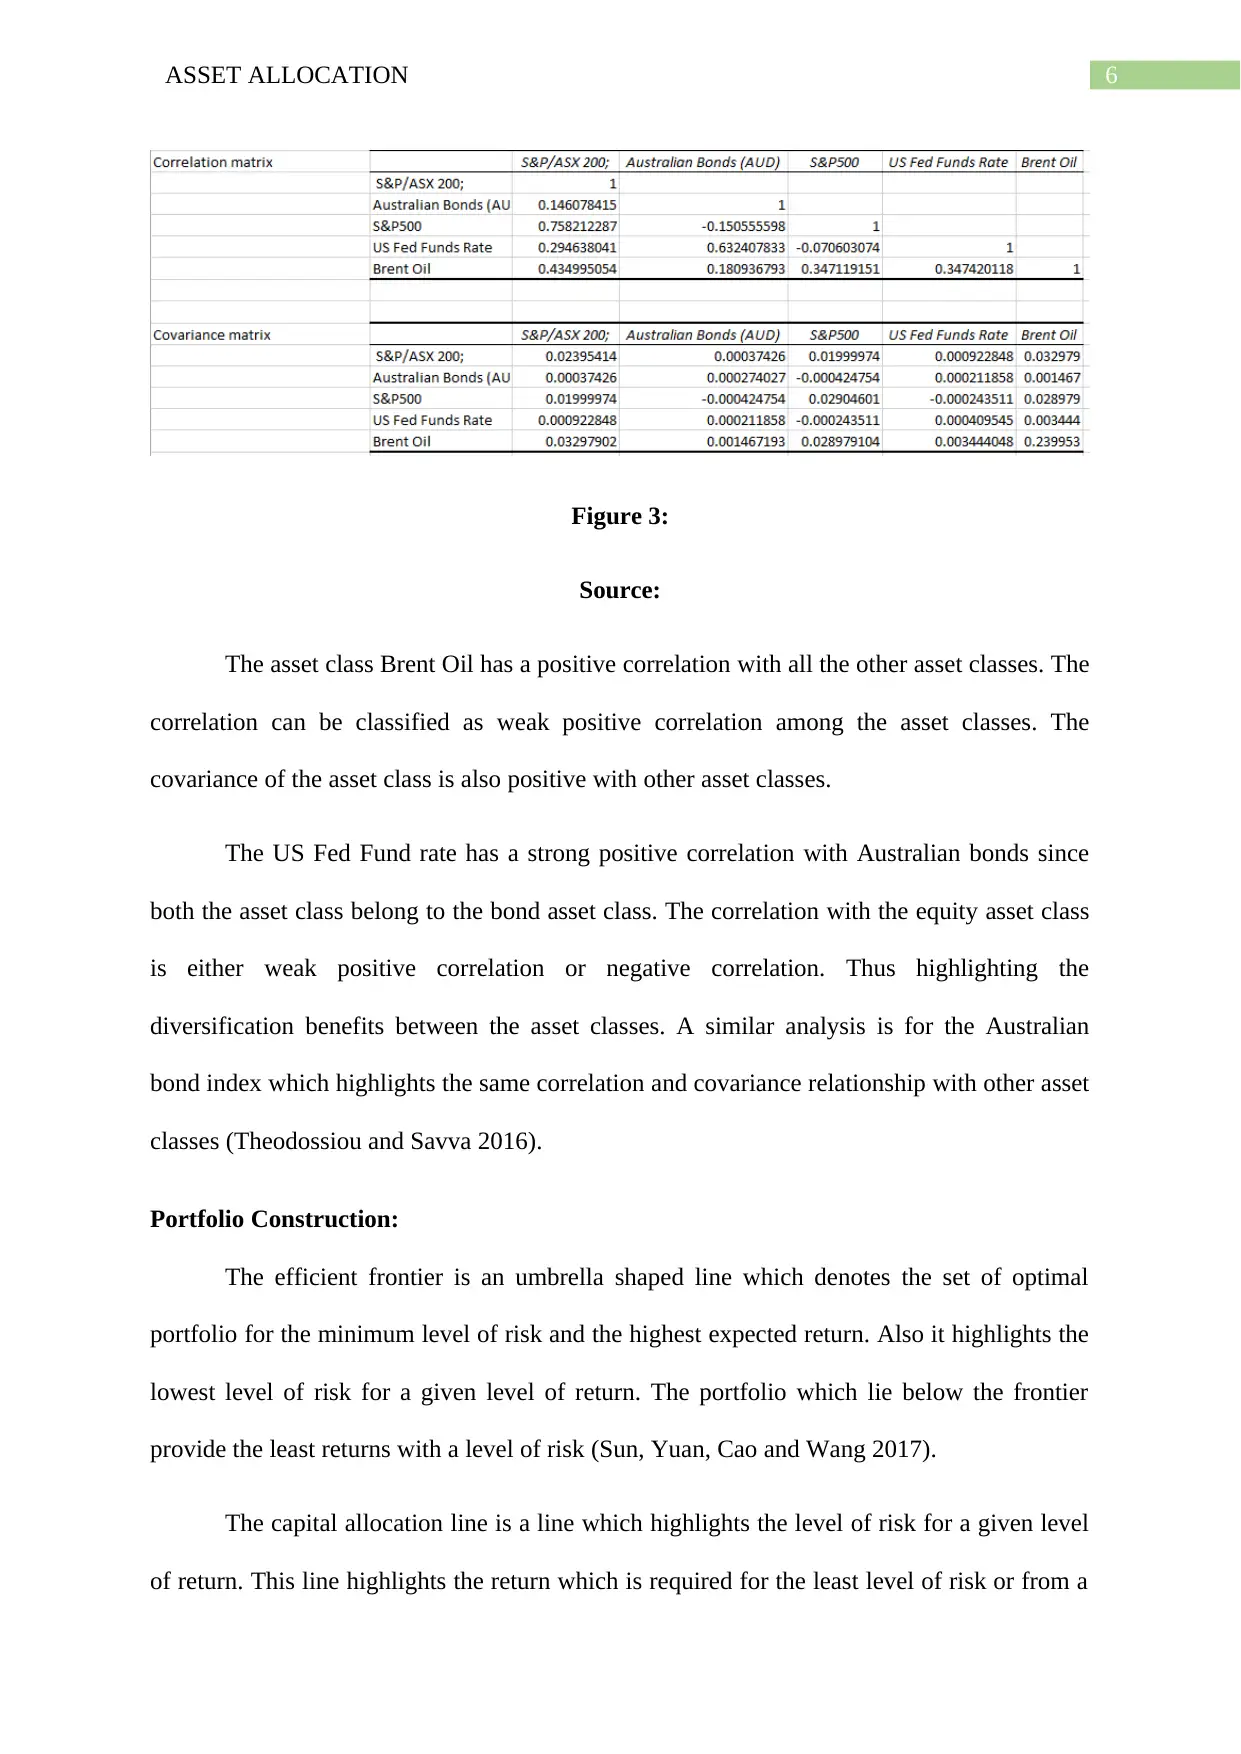
The asset class Brent Oil has a positive correlation with all the other asset classes. The
correlation can be classified as weak positive correlation among the asset classes. The
covariance of the asset class is also positive with other asset classes.
The US Fed Fund rate has a strong positive correlation with Australian bonds since
both the asset class belong to the bond asset class. The correlation with the equity asset class
is either weak positive correlation or negative correlation. Thus highlighting the
diversification benefits between the asset classes. A similar analysis is for the Australian
bond index which highlights the same correlation and covariance relationship with other asset
classes (Theodossiou and Savva 2016).
Portfolio Construction:
The efficient frontier is an umbrella shaped line which denotes the set of optimal
portfolio for the minimum level of risk and the highest expected return. Also it highlights the
lowest level of risk for a given level of return. The portfolio which lie below the frontier
provide the least returns with a level of risk (Sun, Yuan, Cao and Wang 2017).
The capital allocation line is a line which highlights the level of risk for a given level
of return. This line highlights the return which is required for the least level of risk or from a
Figure 3:
Source:
The asset class Brent Oil has a positive correlation with all the other asset classes. The
correlation can be classified as weak positive correlation among the asset classes. The
covariance of the asset class is also positive with other asset classes.
The US Fed Fund rate has a strong positive correlation with Australian bonds since
both the asset class belong to the bond asset class. The correlation with the equity asset class
is either weak positive correlation or negative correlation. Thus highlighting the
diversification benefits between the asset classes. A similar analysis is for the Australian
bond index which highlights the same correlation and covariance relationship with other asset
classes (Theodossiou and Savva 2016).
Portfolio Construction:
The efficient frontier is an umbrella shaped line which denotes the set of optimal
portfolio for the minimum level of risk and the highest expected return. Also it highlights the
lowest level of risk for a given level of return. The portfolio which lie below the frontier
provide the least returns with a level of risk (Sun, Yuan, Cao and Wang 2017).
The capital allocation line is a line which highlights the level of risk for a given level
of return. This line highlights the return which is required for the least level of risk or from a
Paraphrase This Document
Need a fresh take? Get an instant paraphrase of this document with our AI Paraphraser
7ASSET ALLOCATION
risk free assets to a portfolio of risky assets. Thus this line helps in determining the minimum
return which should be generated for a given level of risk. This is also known as reward to
variability line since the higher the variability the higher the reward is generated by the
investor (Runting, Beyer, Dujardin, Lovelock, Bryan and Rhodes 2018).
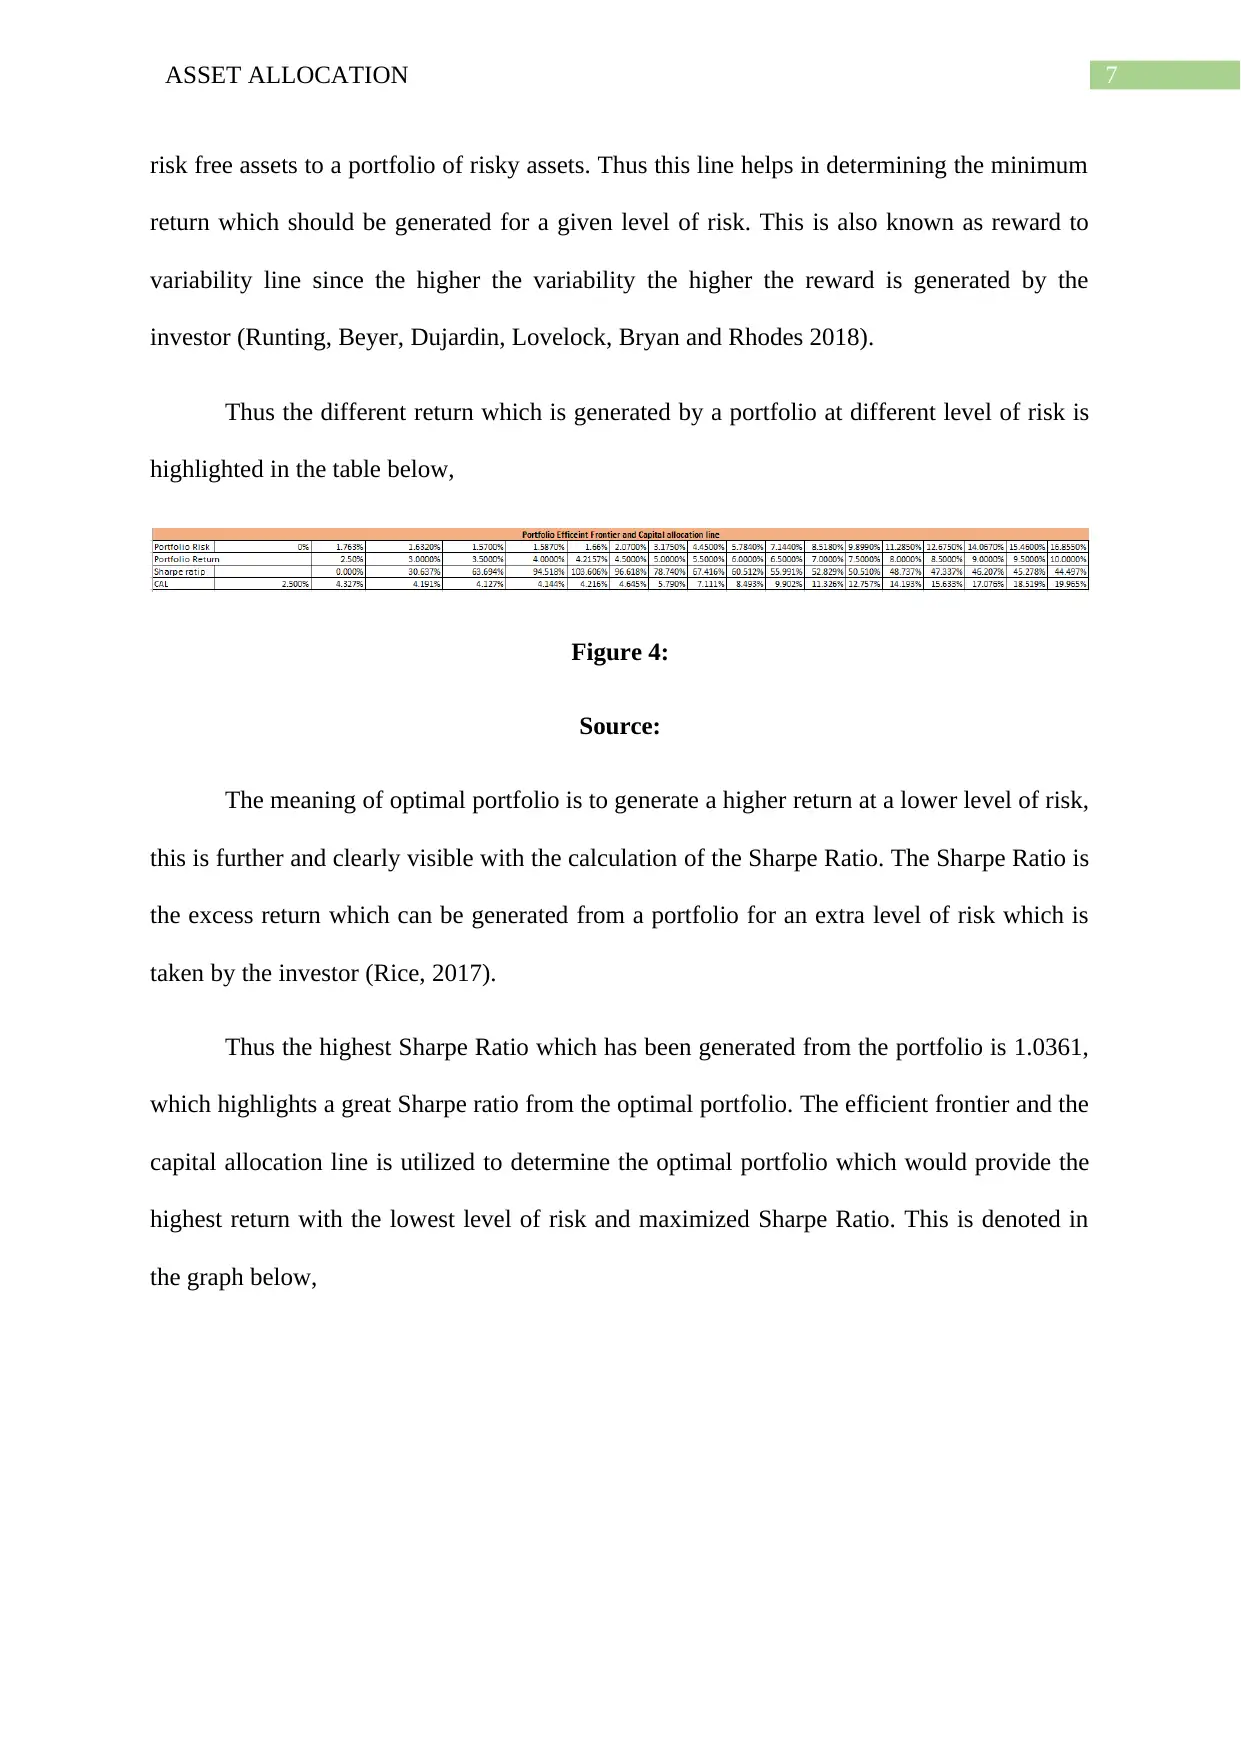
Thus the different return which is generated by a portfolio at different level of risk is
highlighted in the table below,
Figure 4:
Source:
The meaning of optimal portfolio is to generate a higher return at a lower level of risk,
this is further and clearly visible with the calculation of the Sharpe Ratio. The Sharpe Ratio is
the excess return which can be generated from a portfolio for an extra level of risk which is
taken by the investor (Rice, 2017).
Thus the highest Sharpe Ratio which has been generated from the portfolio is 1.0361,
which highlights a great Sharpe ratio from the optimal portfolio. The efficient frontier and the
capital allocation line is utilized to determine the optimal portfolio which would provide the
highest return with the lowest level of risk and maximized Sharpe Ratio. This is denoted in
the graph below,
risk free assets to a portfolio of risky assets. Thus this line helps in determining the minimum
return which should be generated for a given level of risk. This is also known as reward to
variability line since the higher the variability the higher the reward is generated by the
investor (Runting, Beyer, Dujardin, Lovelock, Bryan and Rhodes 2018).
Thus the different return which is generated by a portfolio at different level of risk is
highlighted in the table below,
Figure 4:
Source:
The meaning of optimal portfolio is to generate a higher return at a lower level of risk,
this is further and clearly visible with the calculation of the Sharpe Ratio. The Sharpe Ratio is
the excess return which can be generated from a portfolio for an extra level of risk which is
taken by the investor (Rice, 2017).
Thus the highest Sharpe Ratio which has been generated from the portfolio is 1.0361,
which highlights a great Sharpe ratio from the optimal portfolio. The efficient frontier and the
capital allocation line is utilized to determine the optimal portfolio which would provide the
highest return with the lowest level of risk and maximized Sharpe Ratio. This is denoted in
the graph below,
8ASSET ALLOCATION
0.000% 2.000% 4.000% 6.000% 8.000% 10.000% 12.000% 14.000% 16.000% 18.000%
0.00%
5.00%
10.00%
15.00%
20.00%
25.00%
Figure 5:
Source:
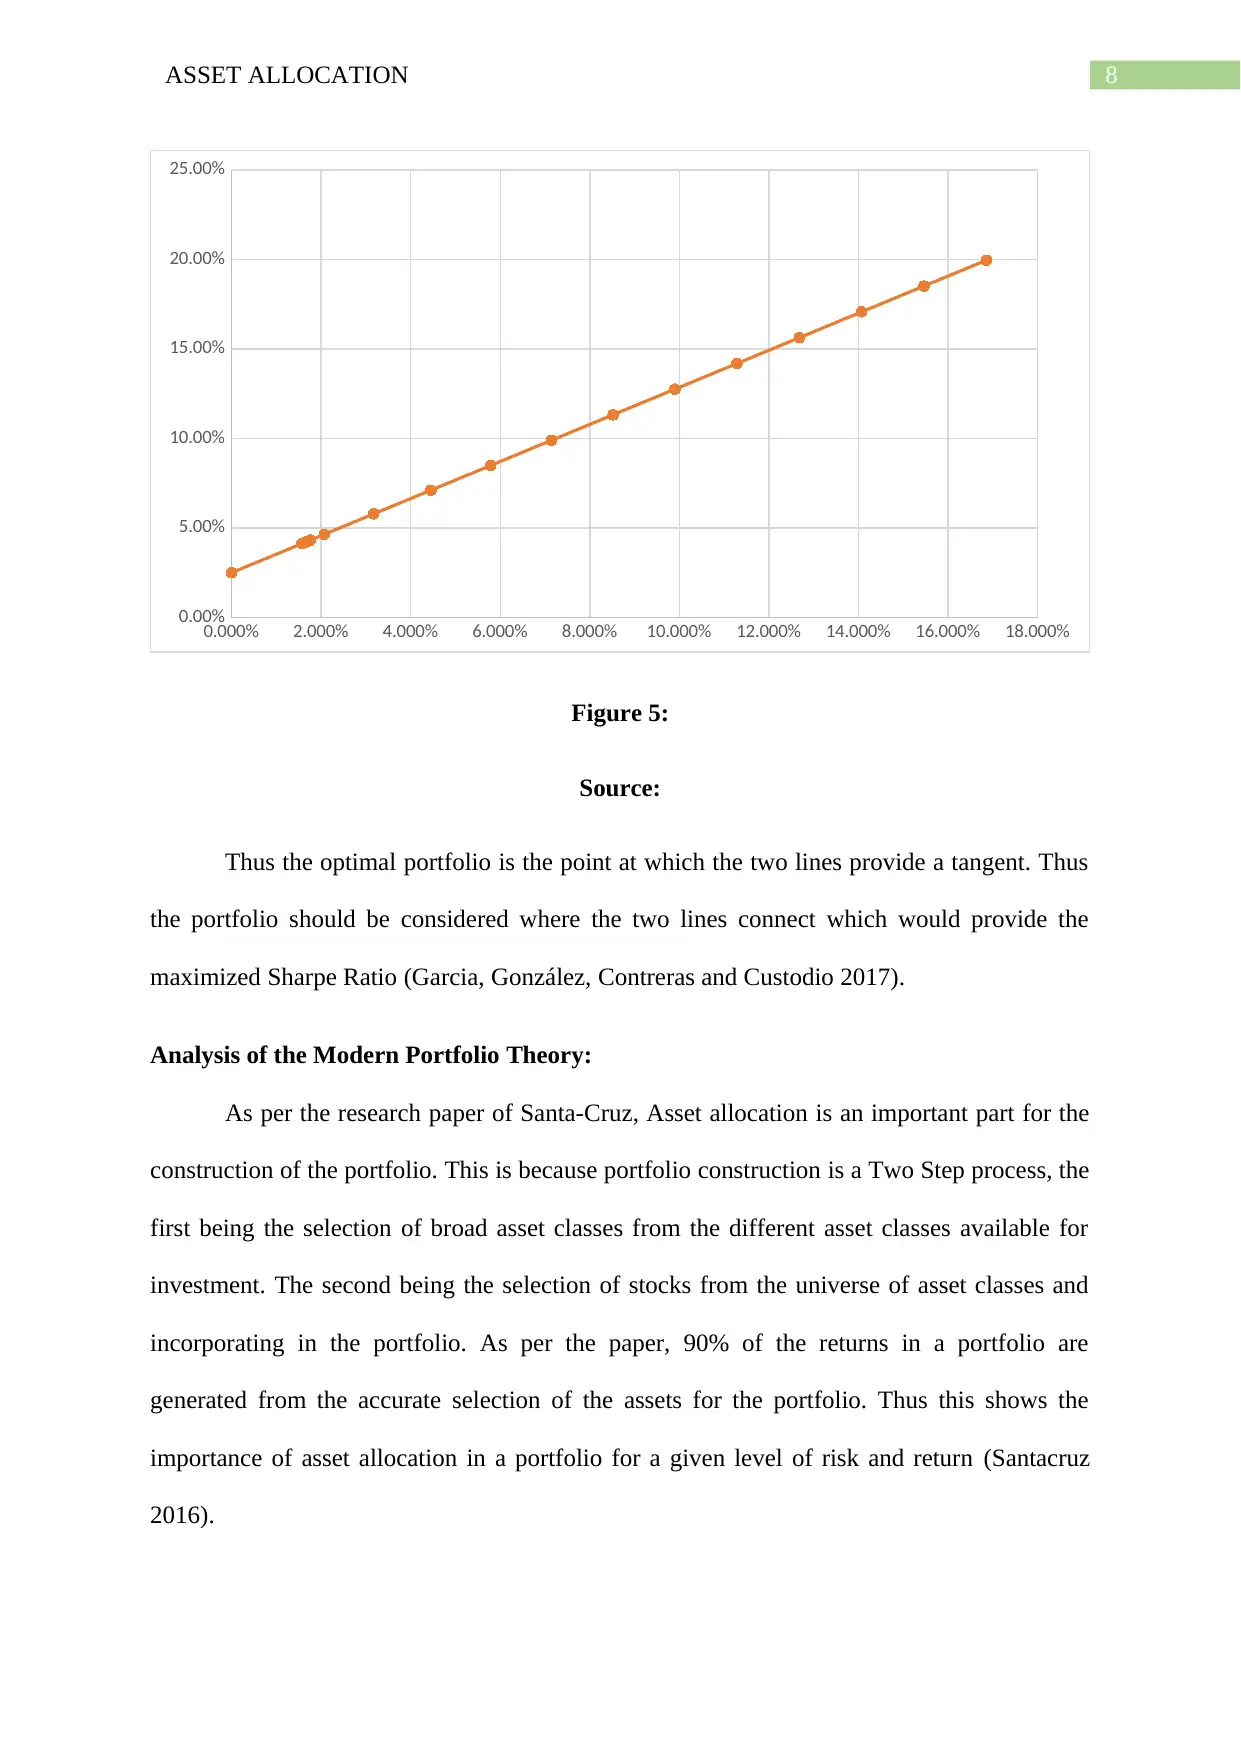
Thus the optimal portfolio is the point at which the two lines provide a tangent. Thus
the portfolio should be considered where the two lines connect which would provide the
maximized Sharpe Ratio (Garcia, González, Contreras and Custodio 2017).
Analysis of the Modern Portfolio Theory:
As per the research paper of Santa-Cruz, Asset allocation is an important part for the
construction of the portfolio. This is because portfolio construction is a Two Step process, the
first being the selection of broad asset classes from the different asset classes available for
investment. The second being the selection of stocks from the universe of asset classes and
incorporating in the portfolio. As per the paper, 90% of the returns in a portfolio are
generated from the accurate selection of the assets for the portfolio. Thus this shows the
importance of asset allocation in a portfolio for a given level of risk and return (Santacruz
2016).
0.000% 2.000% 4.000% 6.000% 8.000% 10.000% 12.000% 14.000% 16.000% 18.000%
0.00%
5.00%
10.00%
15.00%
20.00%
25.00%
Figure 5:
Source:
Thus the optimal portfolio is the point at which the two lines provide a tangent. Thus
the portfolio should be considered where the two lines connect which would provide the
maximized Sharpe Ratio (Garcia, González, Contreras and Custodio 2017).
Analysis of the Modern Portfolio Theory:
As per the research paper of Santa-Cruz, Asset allocation is an important part for the
construction of the portfolio. This is because portfolio construction is a Two Step process, the
first being the selection of broad asset classes from the different asset classes available for
investment. The second being the selection of stocks from the universe of asset classes and
incorporating in the portfolio. As per the paper, 90% of the returns in a portfolio are
generated from the accurate selection of the assets for the portfolio. Thus this shows the
importance of asset allocation in a portfolio for a given level of risk and return (Santacruz
2016).
⊘ This is a preview!⊘
Do you want full access?
Subscribe today to unlock all pages.
Trusted by 1+ million students worldwide
9ASSET ALLOCATION
Also as per the paper of Page and Panariello, the asset allocation is an important part
since it brings diversification benefits to the portfolio. This is due to the correlation which is
between the different asset classes which helps in minimizing the risk and maximising the
return of the portfolio. This is the essence of the modern portfolio theory and asset classes are
selected and taken for the purpose of portfolio construction using this principle to bring the
diversification benefits in the portfolio. This has been highlighted in the portfolio constructed
above as the correlation of the commodities is weak and positive with all other asset classes.
The asset classes which are represented by different index but in the same asset class have
positive correlation, like the equity asset class is represented by the ASX 200 and S&P 500
which have a positive correlation. Also the Bond index which are in the bond asset class have
a positive correlation among themselves. However, the correlation is reduced between the
bond and equity asset class (Page & Panariello 2018).
As per McKay and Thomas, in their paper, they also highlight the benefits of
diversification in a portfolio. However, both the research papers highlight the points when
diversification of a portfolio fails when it is needed the most by the investors. The funds
which are over-diversified and have a large number of active managers fail to provide excess
return since the return which is generated is reduced to pay the active managers fee. This has
been highlighted that the funds which are less actively managed have provided better returns
than the funds which are over diversified. This is because the returns which are generated in
excess are reduced due to the payment of more fees to the fund managers (McKay, Shaoiro &
Thomas 2018).
Also diversification of the portfolio gets reduced when the market crashes due to the
spike in the correlation and thus all asset classes generate negative returns. Thus the portfolio
suffers due to rise in the correlation which leads to the losses in the portfolio. Also the
Paraphrase This Document
Need a fresh take? Get an instant paraphrase of this document with our AI Paraphraser
10ASSET ALLOCATION
correlation should be positive when the markets are rising which would lead to the generation
of returns, but the exact opposite is observed with correlation being positive in a crash.
Thus, modern portfolio theory should be used in the construction of an optimal
portfolio but should be supplemented with rigorous analysis with third order moments. Since
the assumption in modern portfolio theory is that the optimal portfolio is constructed using
the Normal distribution. The other moments such as skewness and kurtosis should be
incorporated in the selection of the portfolio. Also the portfolio should be subject to rigorous
stress testing and scenario testing to assess the impact on the portfolio during times of
economic downturn.
Conclusion:
Thus in this report it is concluded about the analysis of the different asset classes and
their importance in portfolio management. The statistical measures which highlight the
performance of the asset classes is analysed with the use of other statistical measures. The
optimal portfolio is constructed and analysed as per the modern portfolio theory. Also the use
of efficient frontier with capital allocation line is used in the selection of the portfolio. The
limitations and the drawbacks of the modern portfolio theory in construction of the portfolio
is analysed. Thus the portfolio construction should include other measures which should
supplement the modern portfolio theory.
11ASSET ALLOCATION
References:
Akansu, A.N., Kulkarni, S.R. and Malioutov, D.M., 2016. Sparse Markowitz Portfolios.
Bessembinder, H., 2018. Do stocks outperform treasury bills?. Journal of financial
economics, 129(3), pp.440-457.
Bodie, Z, Kane A & Marcus, AJ 2018, Investments, 11th edn, McGraw-Hill Education
(ISBN: 9781259277177).
deLlano-Paz, F., Calvo-Silvosa, A., Antelo, S.I. and Soares, I., 2017. Energy planning and
modern portfolio theory: A review. Renewable and Sustainable Energy Reviews, 77, pp.636-
651.
Dhrymes, P.J., 2017. Portfolio theory: origins, Markowitz and CAPM based selection.
In Portfolio Construction, Measurement, and Efficiency (pp. 39-48). Springer, Cham.
Fischer, J., 2019, October. Modern Portfolio Theory and the Efficient Markets Hypothesis:
How well did they serve Canada? s baby-boom generation?. In Proceedings of Economics
and Finance Conferences (No. 9511941). International Institute of Social and Economic
Sciences.
Garcia, R.C., González, V., Contreras, J. and Custodio, J.E., 2017. Applying modern
portfolio theory for a dynamic energy portfolio allocation in electricity markets. Electric
Power Systems Research, 150, pp.11-23.
Graham, J.R. and Harvey, C.R., 2018. The equity risk premium in 2018. Available at SSRN
3151162.
McKay, S, Shaoiro, R & Thomas, R 2018, ‘What free lunch? The costs of
overdiversification’, Financial Analysts Journal, vol. 74, no. 1, pp. 44-57.
⊘ This is a preview!⊘
Do you want full access?
Subscribe today to unlock all pages.
Trusted by 1+ million students worldwide
1 out of 14
Related Documents


Your All-in-One AI-Powered Toolkit for Academic Success.
+13062052269
info@desklib.com
Available 24*7 on WhatsApp / Email
![[object Object]](/_next/static/media/star-bottom.7253800d.svg)
Unlock your academic potential
Copyright © 2020–2026 A2Z Services. All Rights Reserved. Developed and managed by ZUCOL.