Financial Portfolio Analysis: Sharpe Ratio Calculations and Rankings
VerifiedAdded on 2020/01/28
|9
|1063
|69
Project
AI Summary
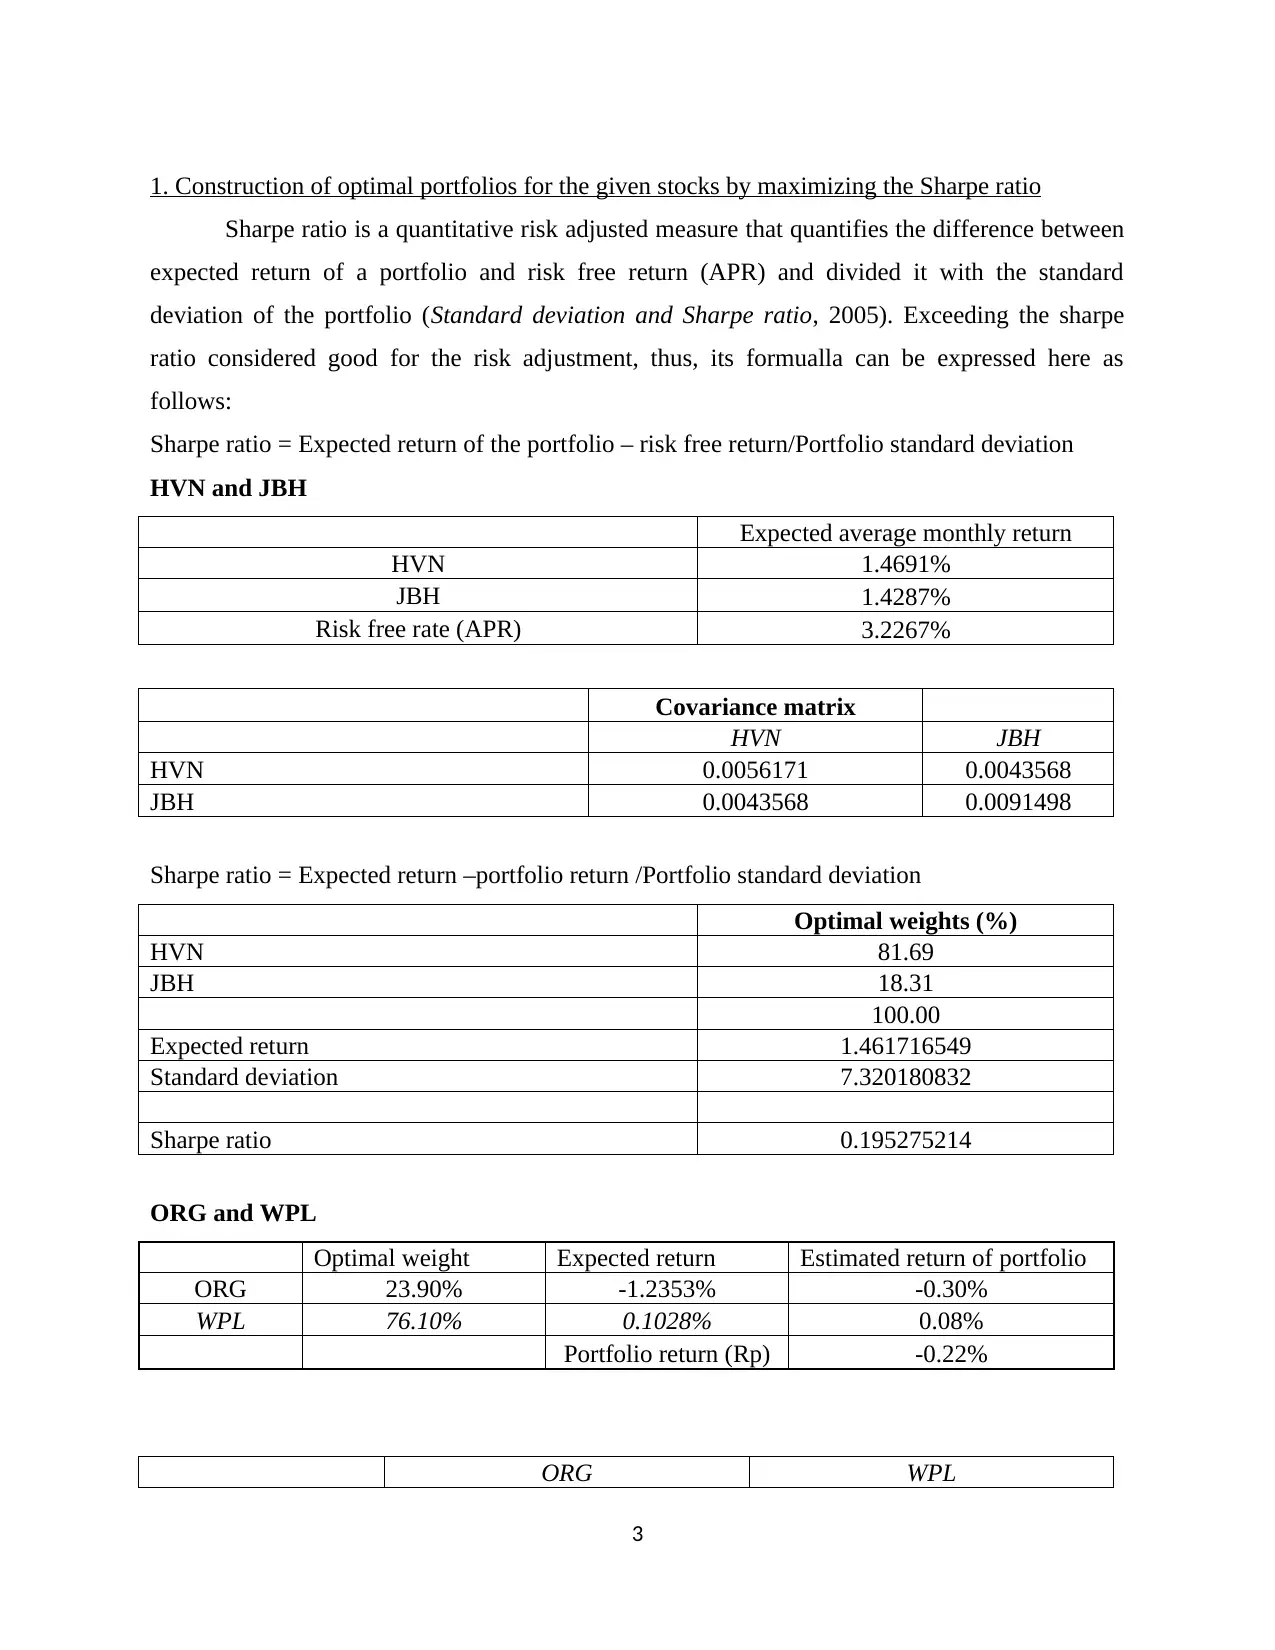
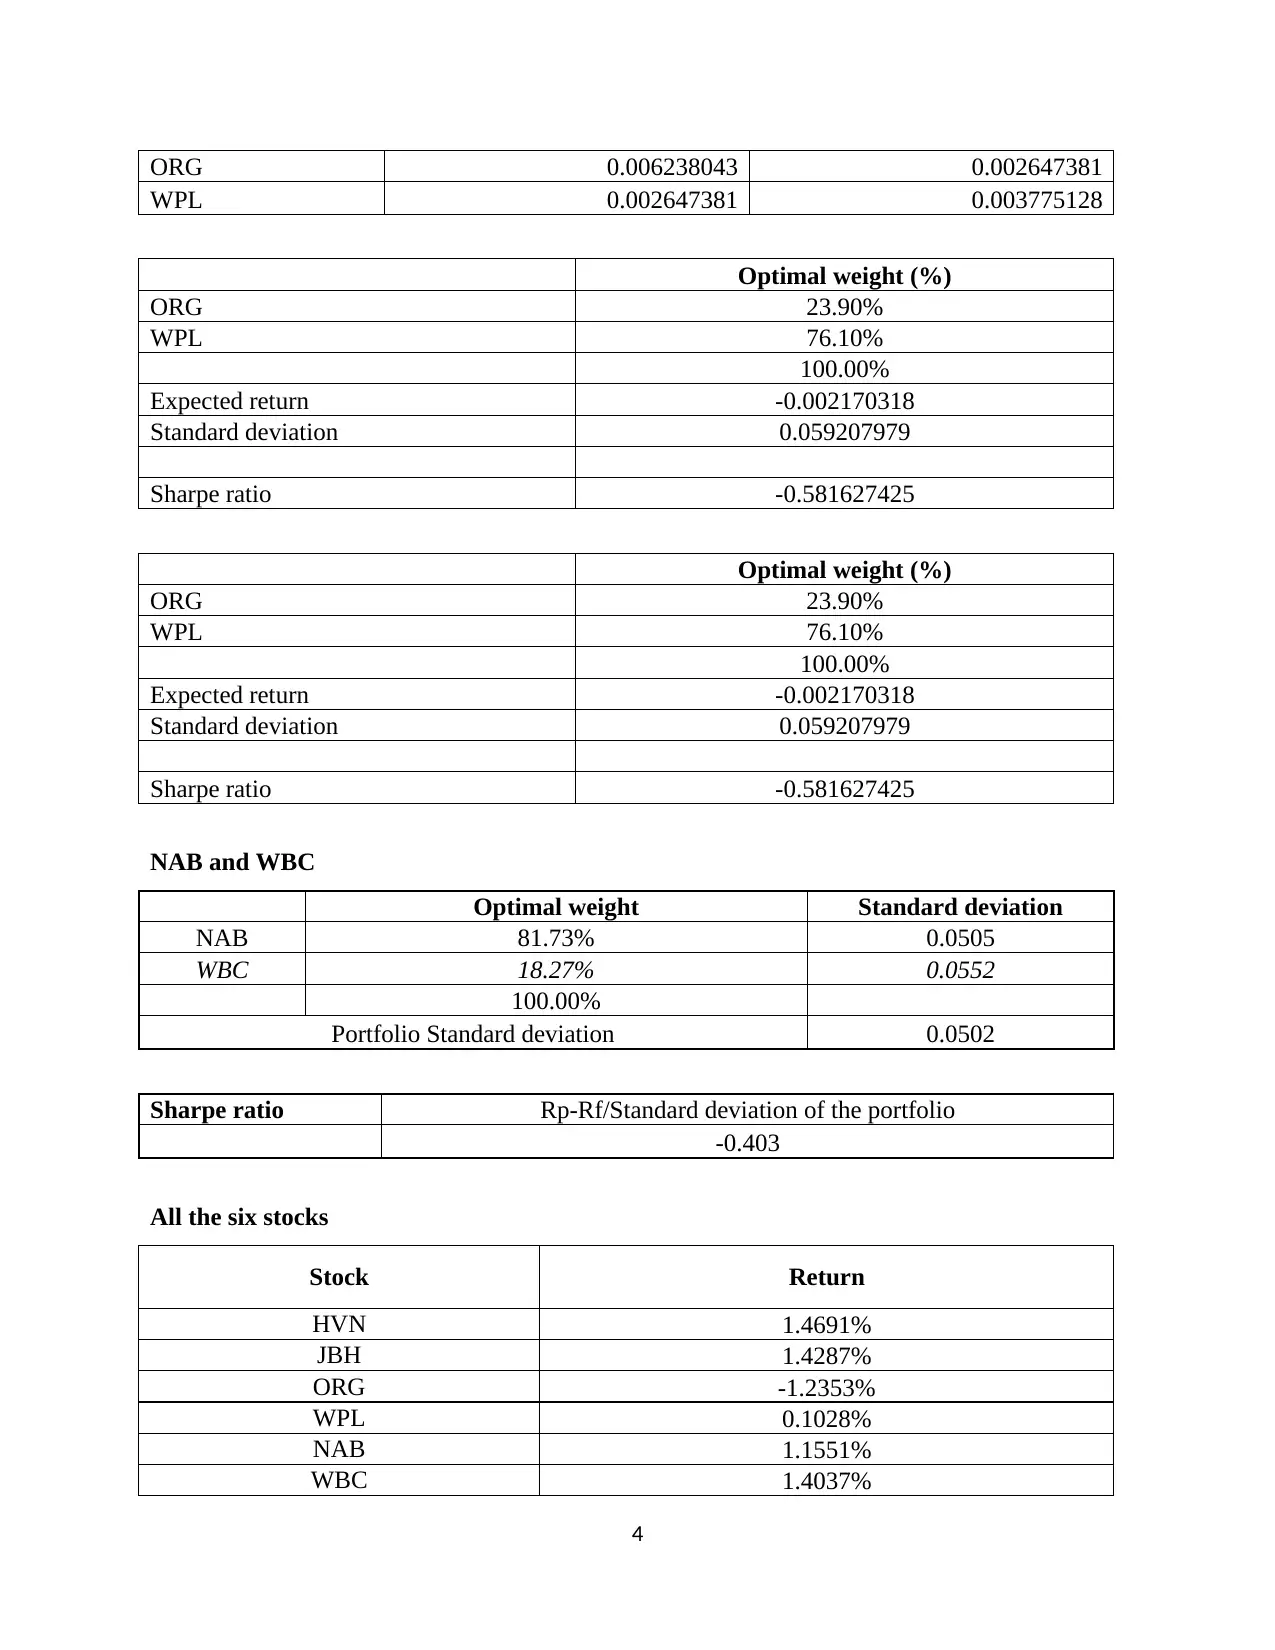
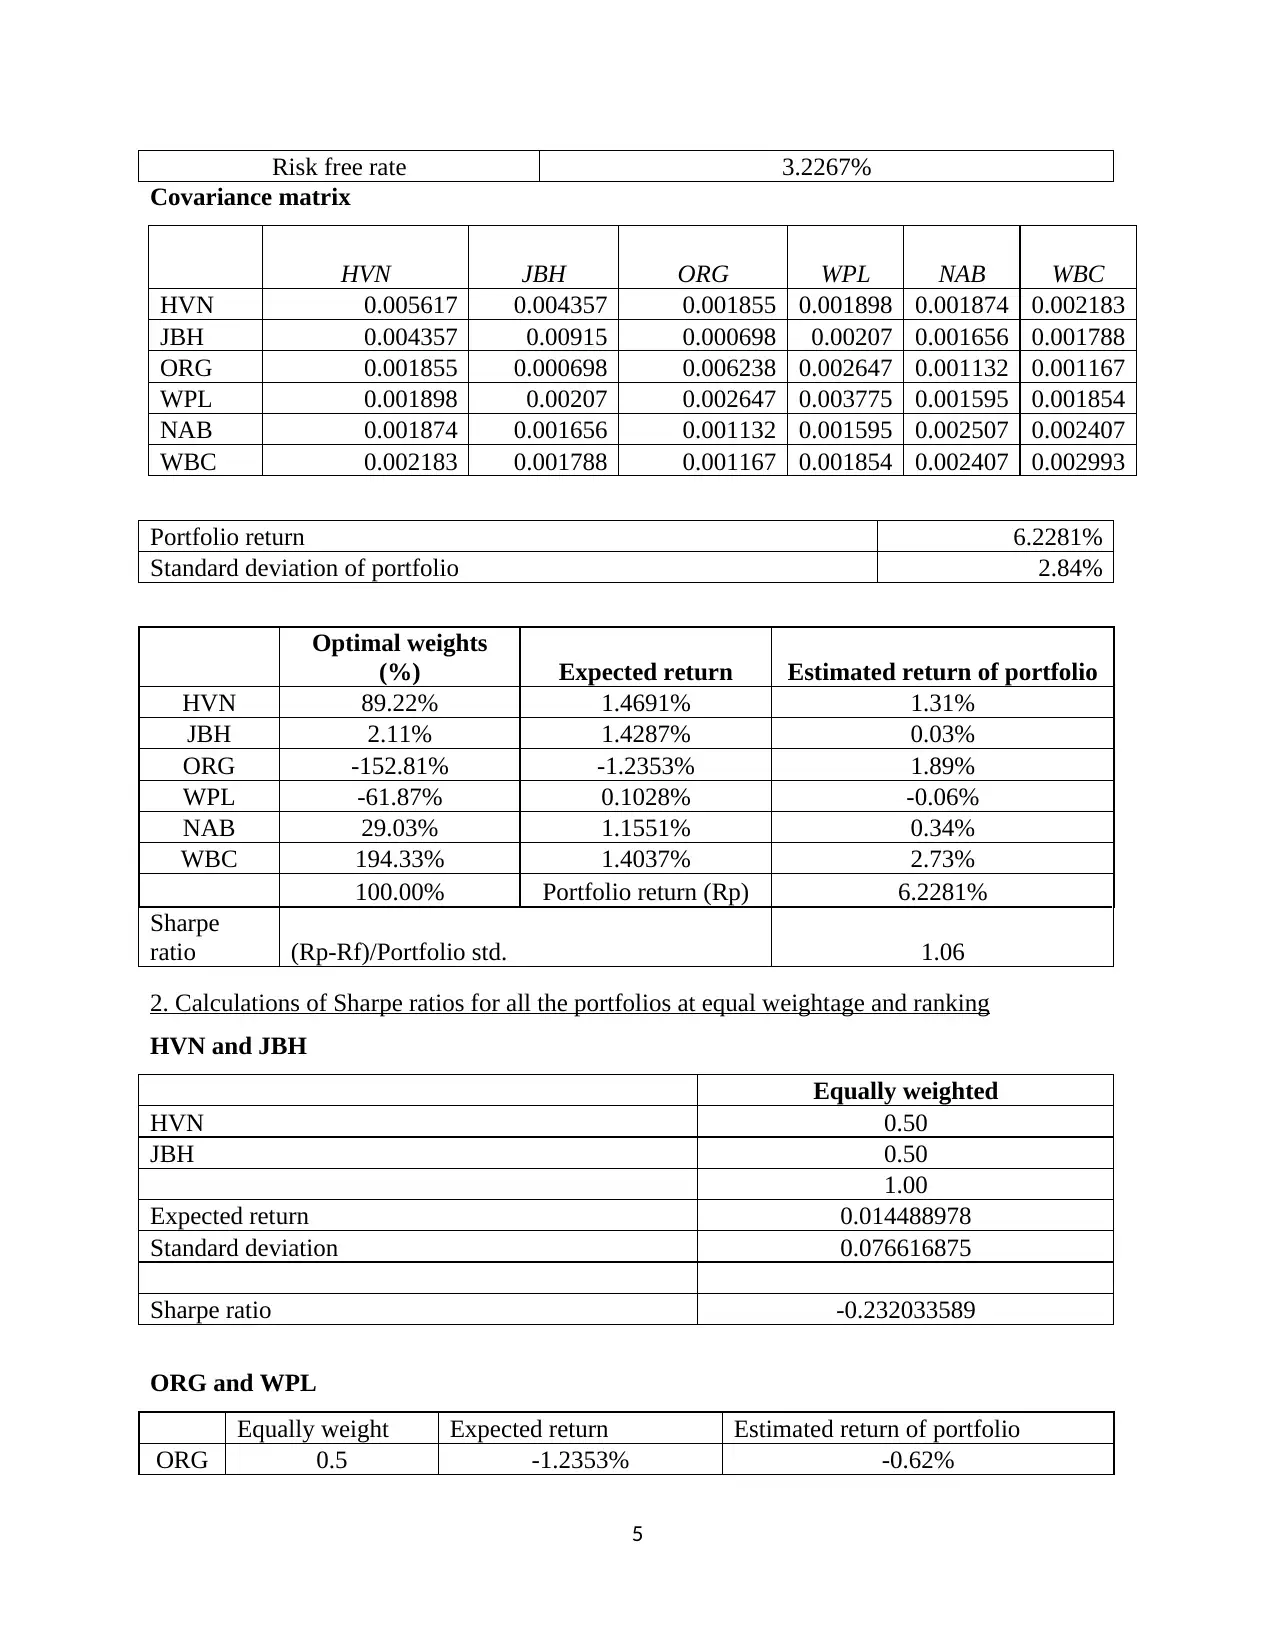
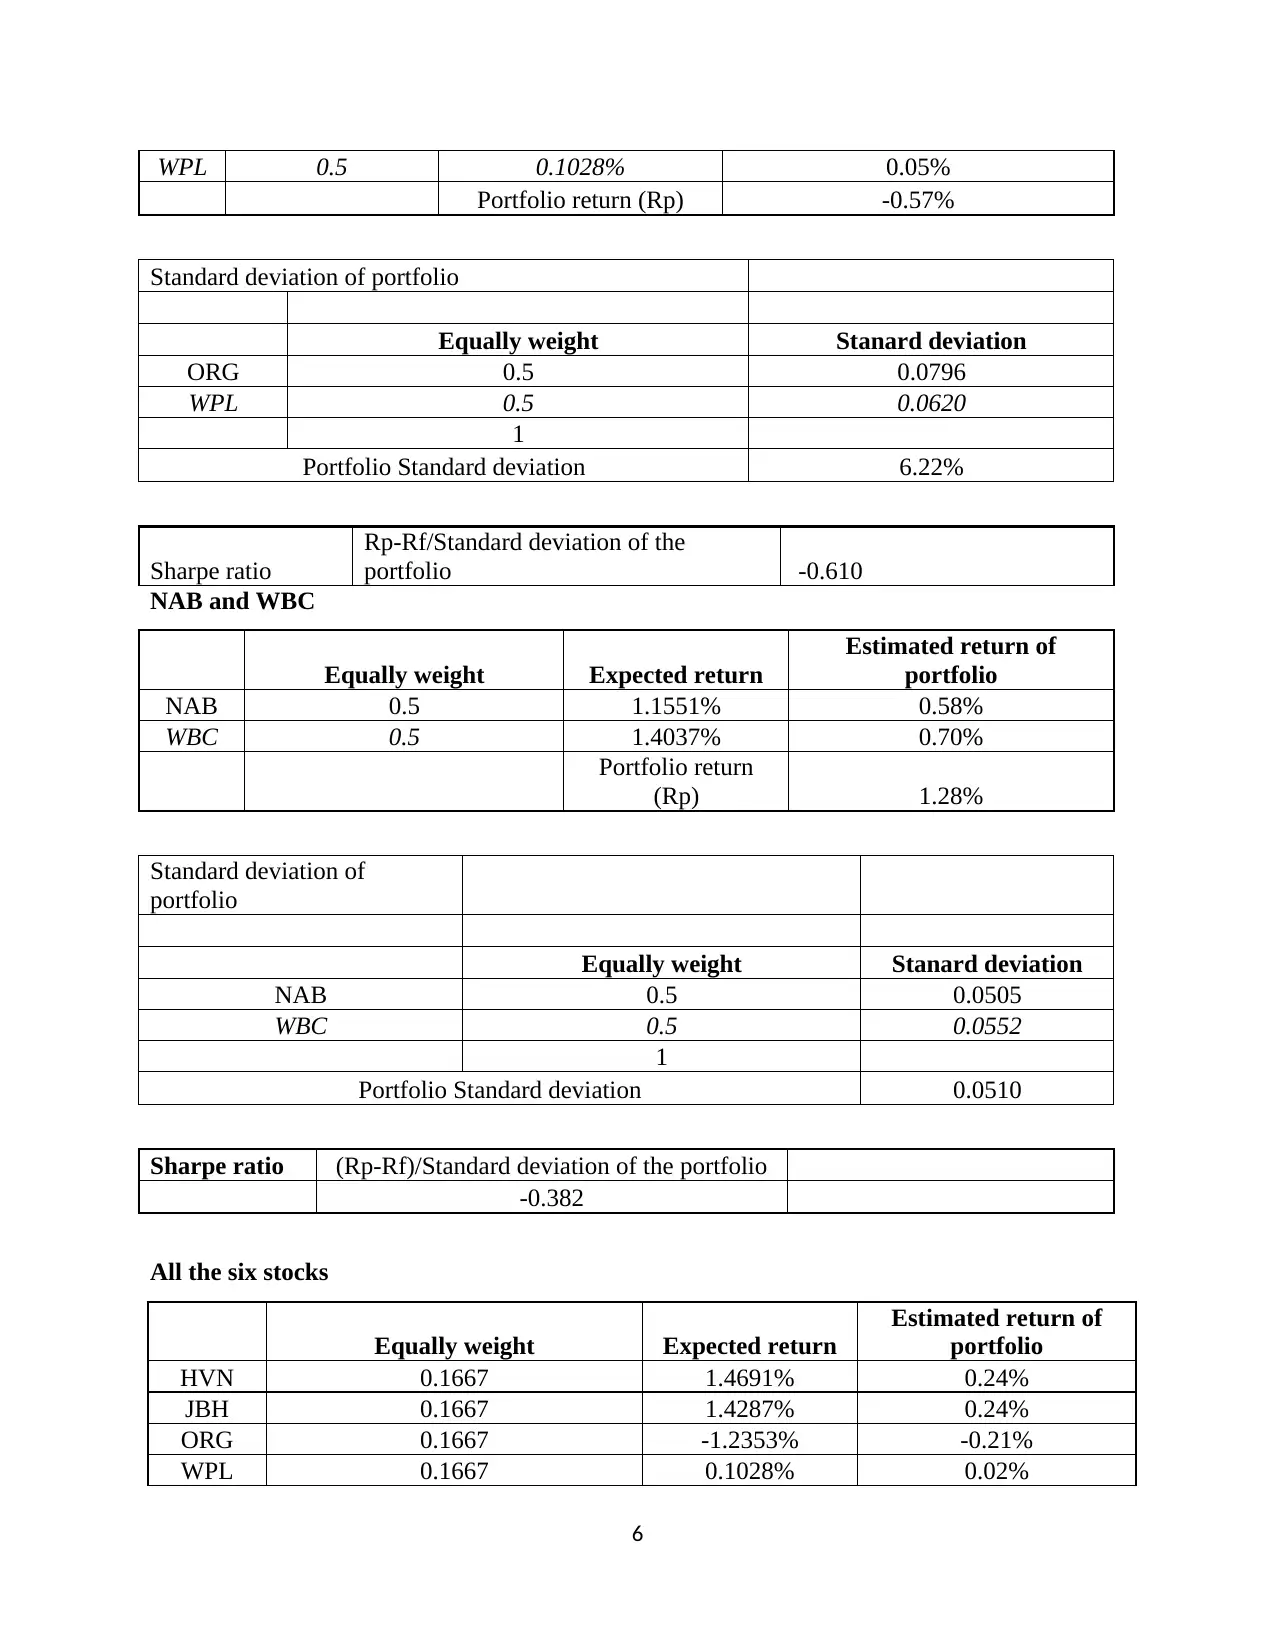
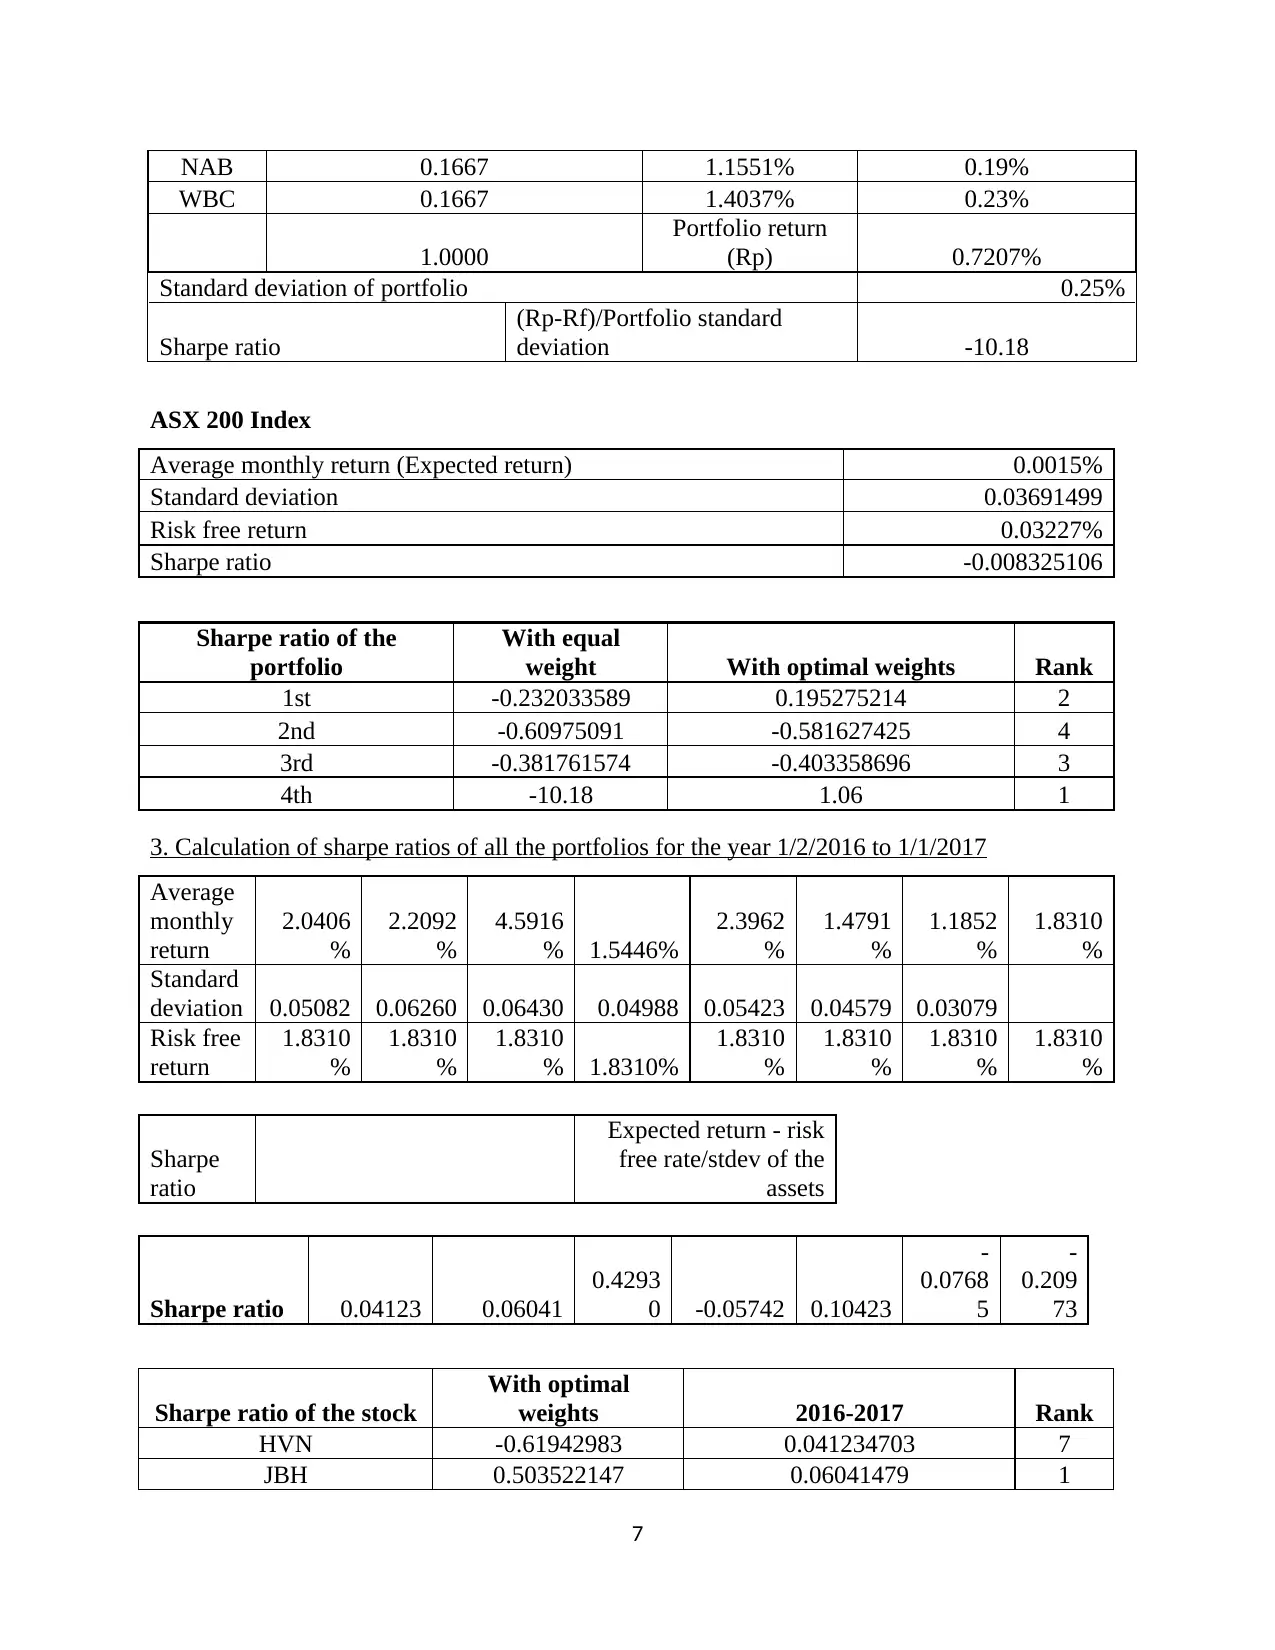
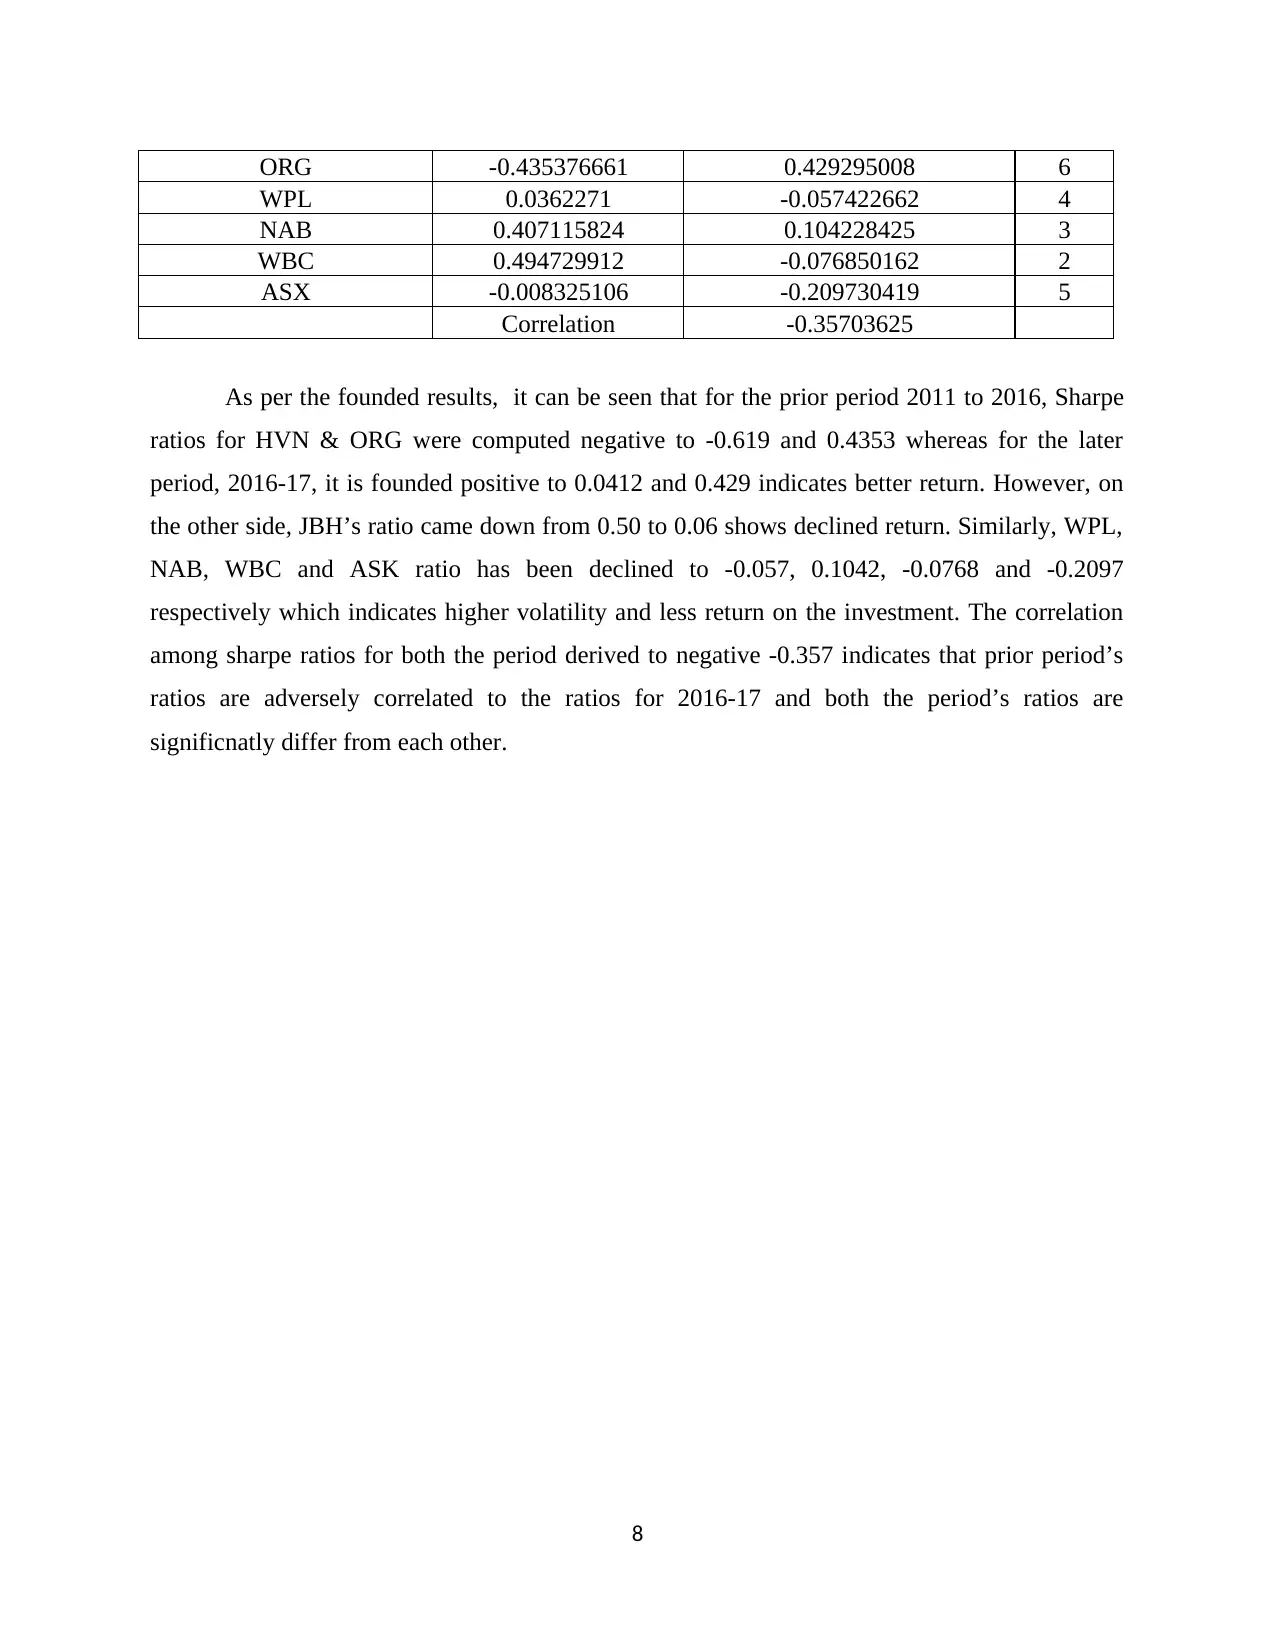
This project undertakes a comprehensive financial portfolio analysis, focusing on the application of the Sharpe ratio as a key metric for assessing risk-adjusted returns. The analysis involves constructing optimal portfolios for given stocks by maximizing the Sharpe ratio, calculating Sharpe ratios for various portfolios under different weighting schemes (equal and optimal), and ranking the portfolios based on their performance. The project also includes calculations of Sharpe ratios for the period from 1/2/2016 to 1/1/2017, providing insights into the performance of the portfolios over time. The methodology encompasses the use of expected average monthly returns, risk-free rates, and covariance matrices to determine optimal weights and evaluate portfolio efficiency. The results highlight the importance of the Sharpe ratio in investment decision-making, demonstrating how it can be used to compare and rank portfolios based on their risk-adjusted returns. The project also includes an analysis of the ASX 200 index and a comparison of Sharpe ratios across different time periods, revealing correlations and changes in portfolio performance.

FINANCIAL PROBLEMS TO
BE SOLVED
1
BE SOLVED
1
Paraphrase This Document
Need a fresh take? Get an instant paraphrase of this document with our AI Paraphraser

Table of Contents
1. Construction of optimal portfolios for the given stocks by maximizing the Sharpe ratio.......3
2. Calculations of Sharpe ratios for all the portfolios at equal weightage and ranking...............5
3. Calculation of sharpe ratios of all the portfolios for the year 1/2/2016 to 1/1/2017................7
REFERENCES................................................................................................................................8
2

1. Construction of optimal portfolios for the given stocks by maximizing the Sharpe ratio
Sharpe ratio is a quantitative risk adjusted measure that quantifies the difference between
expected return of a portfolio and risk free return (APR) and divided it with the standard
deviation of the portfolio (Standard deviation and Sharpe ratio, 2005). Exceeding the sharpe
ratio considered good for the risk adjustment, thus, its formualla can be expressed here as
follows:
Sharpe ratio = Expected return of the portfolio – risk free return/Portfolio standard deviation
HVN and JBH
Expected average monthly return
HVN 1.4691%
JBH 1.4287%
Risk free rate (APR) 3.2267%
Covariance matrix
HVN JBH
HVN 0.0056171 0.0043568
JBH 0.0043568 0.0091498
Sharpe ratio = Expected return –portfolio return /Portfolio standard deviation
Optimal weights (%)
HVN 81.69
JBH 18.31
100.00
Expected return 1.461716549
Standard deviation 7.320180832
Sharpe ratio 0.195275214
ORG and WPL
Optimal weight Expected return Estimated return of portfolio
ORG 23.90% -1.2353% -0.30%
WPL 76.10% 0.1028% 0.08%
Portfolio return (Rp) -0.22%
ORG WPL
3
⊘ This is a preview!⊘
Do you want full access?
Subscribe today to unlock all pages.

Trusted by 1+ million students worldwide

ORG 0.006238043 0.002647381
WPL 0.002647381 0.003775128
Optimal weight (%)
ORG 23.90%
WPL 76.10%
100.00%
Expected return -0.002170318
Standard deviation 0.059207979
Sharpe ratio -0.581627425
Optimal weight (%)
ORG 23.90%
WPL 76.10%
100.00%
Expected return -0.002170318
Standard deviation 0.059207979
Sharpe ratio -0.581627425
NAB and WBC
Optimal weight Standard deviation
NAB 81.73% 0.0505
WBC 18.27% 0.0552
100.00%
Portfolio Standard deviation 0.0502
Sharpe ratio Rp-Rf/Standard deviation of the portfolio
-0.403
All the six stocks
Stock Return
HVN 1.4691%
JBH 1.4287%
ORG -1.2353%
WPL 0.1028%
NAB 1.1551%
WBC 1.4037%
4
Paraphrase This Document
Need a fresh take? Get an instant paraphrase of this document with our AI Paraphraser

Risk free rate 3.2267%
Covariance matrix
HVN JBH ORG WPL NAB WBC
HVN 0.005617 0.004357 0.001855 0.001898 0.001874 0.002183
JBH 0.004357 0.00915 0.000698 0.00207 0.001656 0.001788
ORG 0.001855 0.000698 0.006238 0.002647 0.001132 0.001167
WPL 0.001898 0.00207 0.002647 0.003775 0.001595 0.001854
NAB 0.001874 0.001656 0.001132 0.001595 0.002507 0.002407
WBC 0.002183 0.001788 0.001167 0.001854 0.002407 0.002993
Portfolio return 6.2281%
Standard deviation of portfolio 2.84%
Optimal weights
(%) Expected return Estimated return of portfolio
HVN 89.22% 1.4691% 1.31%
JBH 2.11% 1.4287% 0.03%
ORG -152.81% -1.2353% 1.89%
WPL -61.87% 0.1028% -0.06%
NAB 29.03% 1.1551% 0.34%
WBC 194.33% 1.4037% 2.73%
100.00% Portfolio return (Rp) 6.2281%
Sharpe
ratio (Rp-Rf)/Portfolio std. 1.06
2. Calculations of Sharpe ratios for all the portfolios at equal weightage and ranking
HVN and JBH
Equally weighted
HVN 0.50
JBH 0.50
1.00
Expected return 0.014488978
Standard deviation 0.076616875
Sharpe ratio -0.232033589
ORG and WPL
Equally weight Expected return Estimated return of portfolio
ORG 0.5 -1.2353% -0.62%
5

WPL 0.5 0.1028% 0.05%
Portfolio return (Rp) -0.57%
Standard deviation of portfolio
Equally weight Stanard deviation
ORG 0.5 0.0796
WPL 0.5 0.0620
1
Portfolio Standard deviation 6.22%
Sharpe ratio
Rp-Rf/Standard deviation of the
portfolio -0.610
NAB and WBC
Equally weight Expected return
Estimated return of
portfolio
NAB 0.5 1.1551% 0.58%
WBC 0.5 1.4037% 0.70%
Portfolio return
(Rp) 1.28%
Standard deviation of
portfolio
Equally weight Stanard deviation
NAB 0.5 0.0505
WBC 0.5 0.0552
1
Portfolio Standard deviation 0.0510
Sharpe ratio (Rp-Rf)/Standard deviation of the portfolio
-0.382
All the six stocks
Equally weight Expected return
Estimated return of
portfolio
HVN 0.1667 1.4691% 0.24%
JBH 0.1667 1.4287% 0.24%
ORG 0.1667 -1.2353% -0.21%
WPL 0.1667 0.1028% 0.02%
6
⊘ This is a preview!⊘
Do you want full access?
Subscribe today to unlock all pages.

Trusted by 1+ million students worldwide

NAB 0.1667 1.1551% 0.19%
WBC 0.1667 1.4037% 0.23%
1.0000
Portfolio return
(Rp) 0.7207%
Standard deviation of portfolio 0.25%
Sharpe ratio
(Rp-Rf)/Portfolio standard
deviation -10.18
ASX 200 Index
Average monthly return (Expected return) 0.0015%
Standard deviation 0.03691499
Risk free return 0.03227%
Sharpe ratio -0.008325106
Sharpe ratio of the
portfolio
With equal
weight With optimal weights Rank
1st -0.232033589 0.195275214 2
2nd -0.60975091 -0.581627425 4
3rd -0.381761574 -0.403358696 3
4th -10.18 1.06 1
3. Calculation of sharpe ratios of all the portfolios for the year 1/2/2016 to 1/1/2017
Average
monthly
return
2.0406
%
2.2092
%
4.5916
% 1.5446%
2.3962
%
1.4791
%
1.1852
%
1.8310
%
Standard
deviation 0.05082 0.06260 0.06430 0.04988 0.05423 0.04579 0.03079
Risk free
return
1.8310
%
1.8310
%
1.8310
% 1.8310%
1.8310
%
1.8310
%
1.8310
%
1.8310
%
Sharpe
ratio
Expected return - risk
free rate/stdev of the
assets
Sharpe ratio 0.04123 0.06041
0.4293
0 -0.05742 0.10423
-
0.0768
5
-
0.209
73
Sharpe ratio of the stock
With optimal
weights 2016-2017 Rank
HVN -0.61942983 0.041234703 7
JBH 0.503522147 0.06041479 1
7
Paraphrase This Document
Need a fresh take? Get an instant paraphrase of this document with our AI Paraphraser

ORG -0.435376661 0.429295008 6
WPL 0.0362271 -0.057422662 4
NAB 0.407115824 0.104228425 3
WBC 0.494729912 -0.076850162 2
ASX -0.008325106 -0.209730419 5
Correlation -0.35703625
As per the founded results, it can be seen that for the prior period 2011 to 2016, Sharpe
ratios for HVN & ORG were computed negative to -0.619 and 0.4353 whereas for the later
period, 2016-17, it is founded positive to 0.0412 and 0.429 indicates better return. However, on
the other side, JBH’s ratio came down from 0.50 to 0.06 shows declined return. Similarly, WPL,
NAB, WBC and ASK ratio has been declined to -0.057, 0.1042, -0.0768 and -0.2097
respectively which indicates higher volatility and less return on the investment. The correlation
among sharpe ratios for both the period derived to negative -0.357 indicates that prior period’s
ratios are adversely correlated to the ratios for 2016-17 and both the period’s ratios are
significnatly differ from each other.
8

REFERENCES
Books and Journals
Standard deviation and Sharpe ratio. 2005. Available through: <
http://corporate.morningstar.com/au/documents/MethodologyDocuments/
MethodologyPapers/StandardDeviationSharpeRatio_Definition.pdf>. [Accessed on 13th
May 2017].
9
Books and Journals
Standard deviation and Sharpe ratio. 2005. Available through: <
http://corporate.morningstar.com/au/documents/MethodologyDocuments/
MethodologyPapers/StandardDeviationSharpeRatio_Definition.pdf>. [Accessed on 13th
May 2017].
9
⊘ This is a preview!⊘
Do you want full access?
Subscribe today to unlock all pages.

Trusted by 1+ million students worldwide
1 out of 9
Related Documents
Your All-in-One AI-Powered Toolkit for Academic Success.
+13062052269
info@desklib.com
Available 24*7 on WhatsApp / Email
Unlock your academic potential
Copyright © 2020–2026 A2Z Services. All Rights Reserved. Developed and managed by ZUCOL.


