Optimizing Investment Portfolios: Risk, Return, and Asset Allocation

Verified

Added on  2023/06/11

|3
|783
|325
Homework Assignment
AI Summary
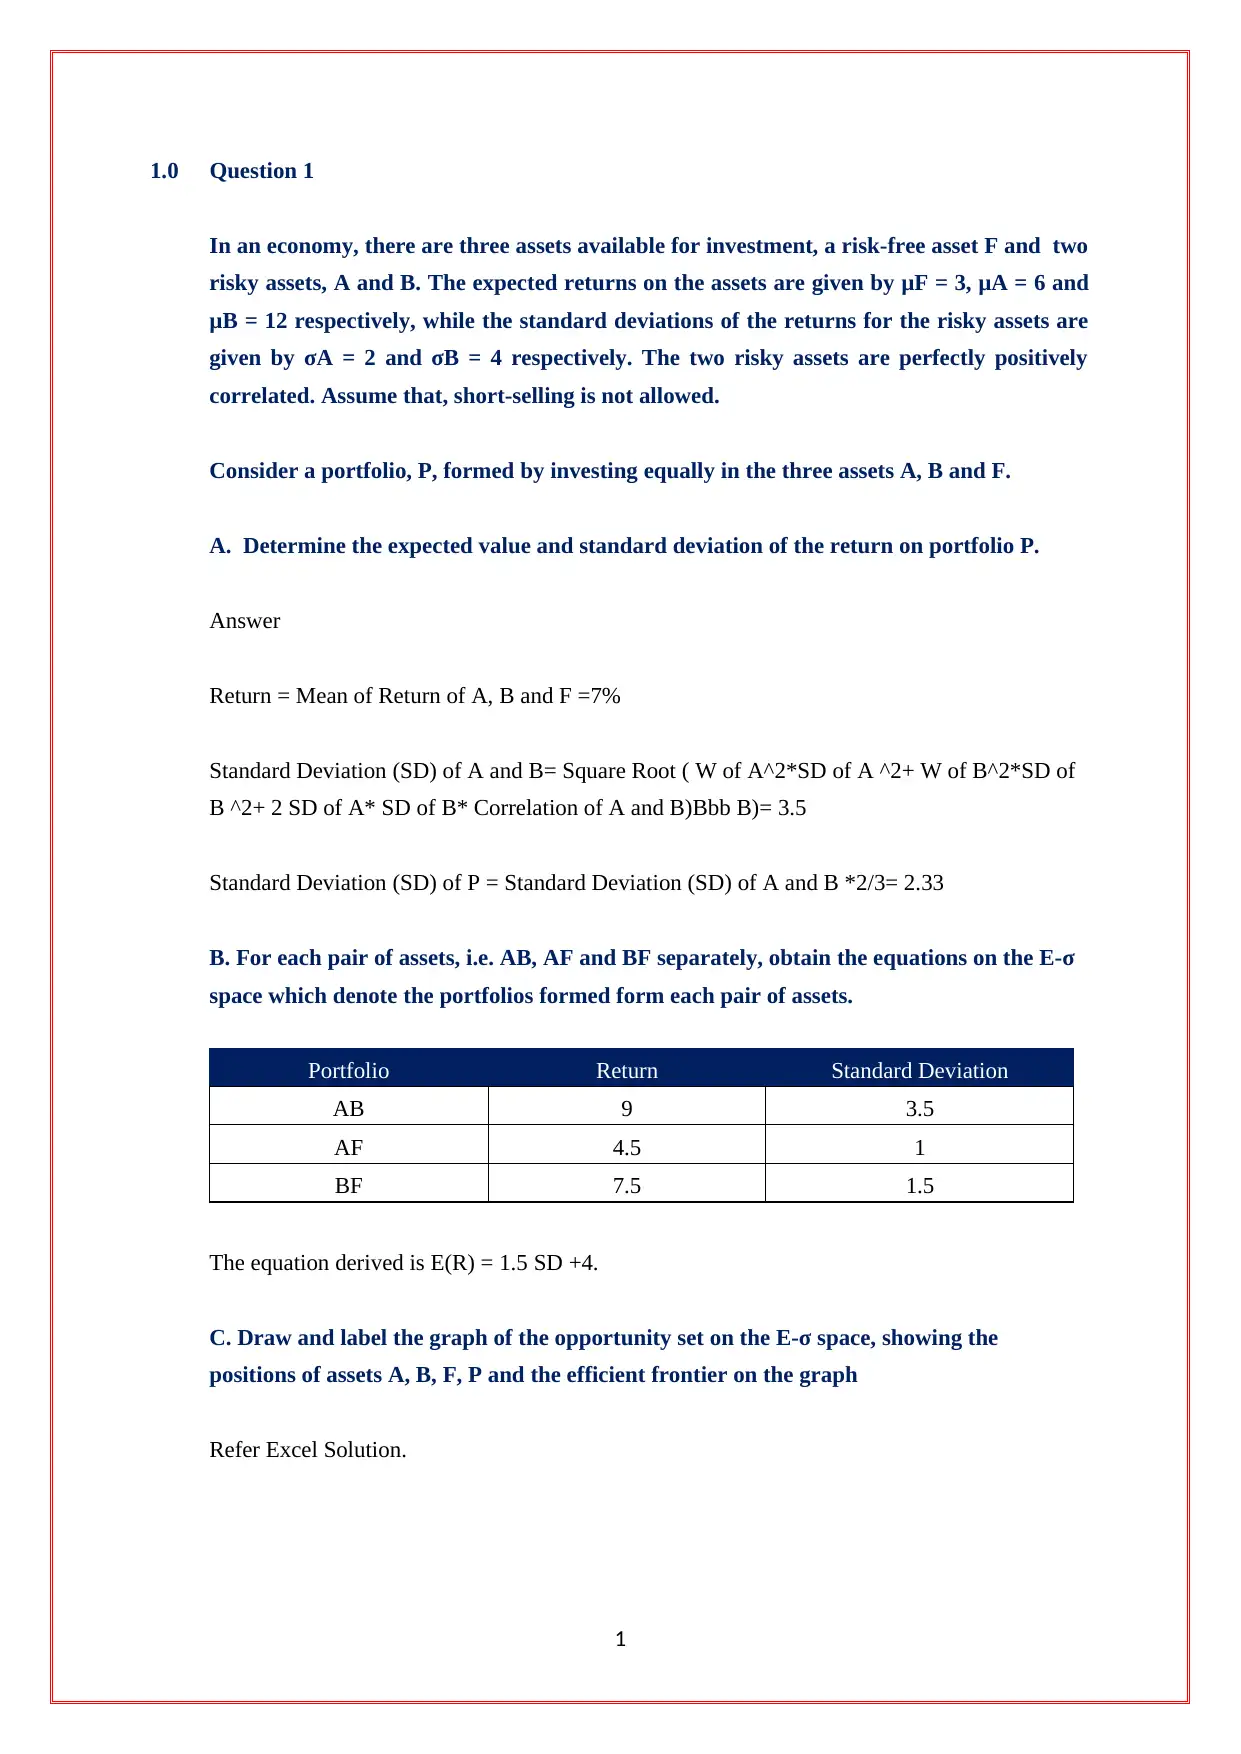
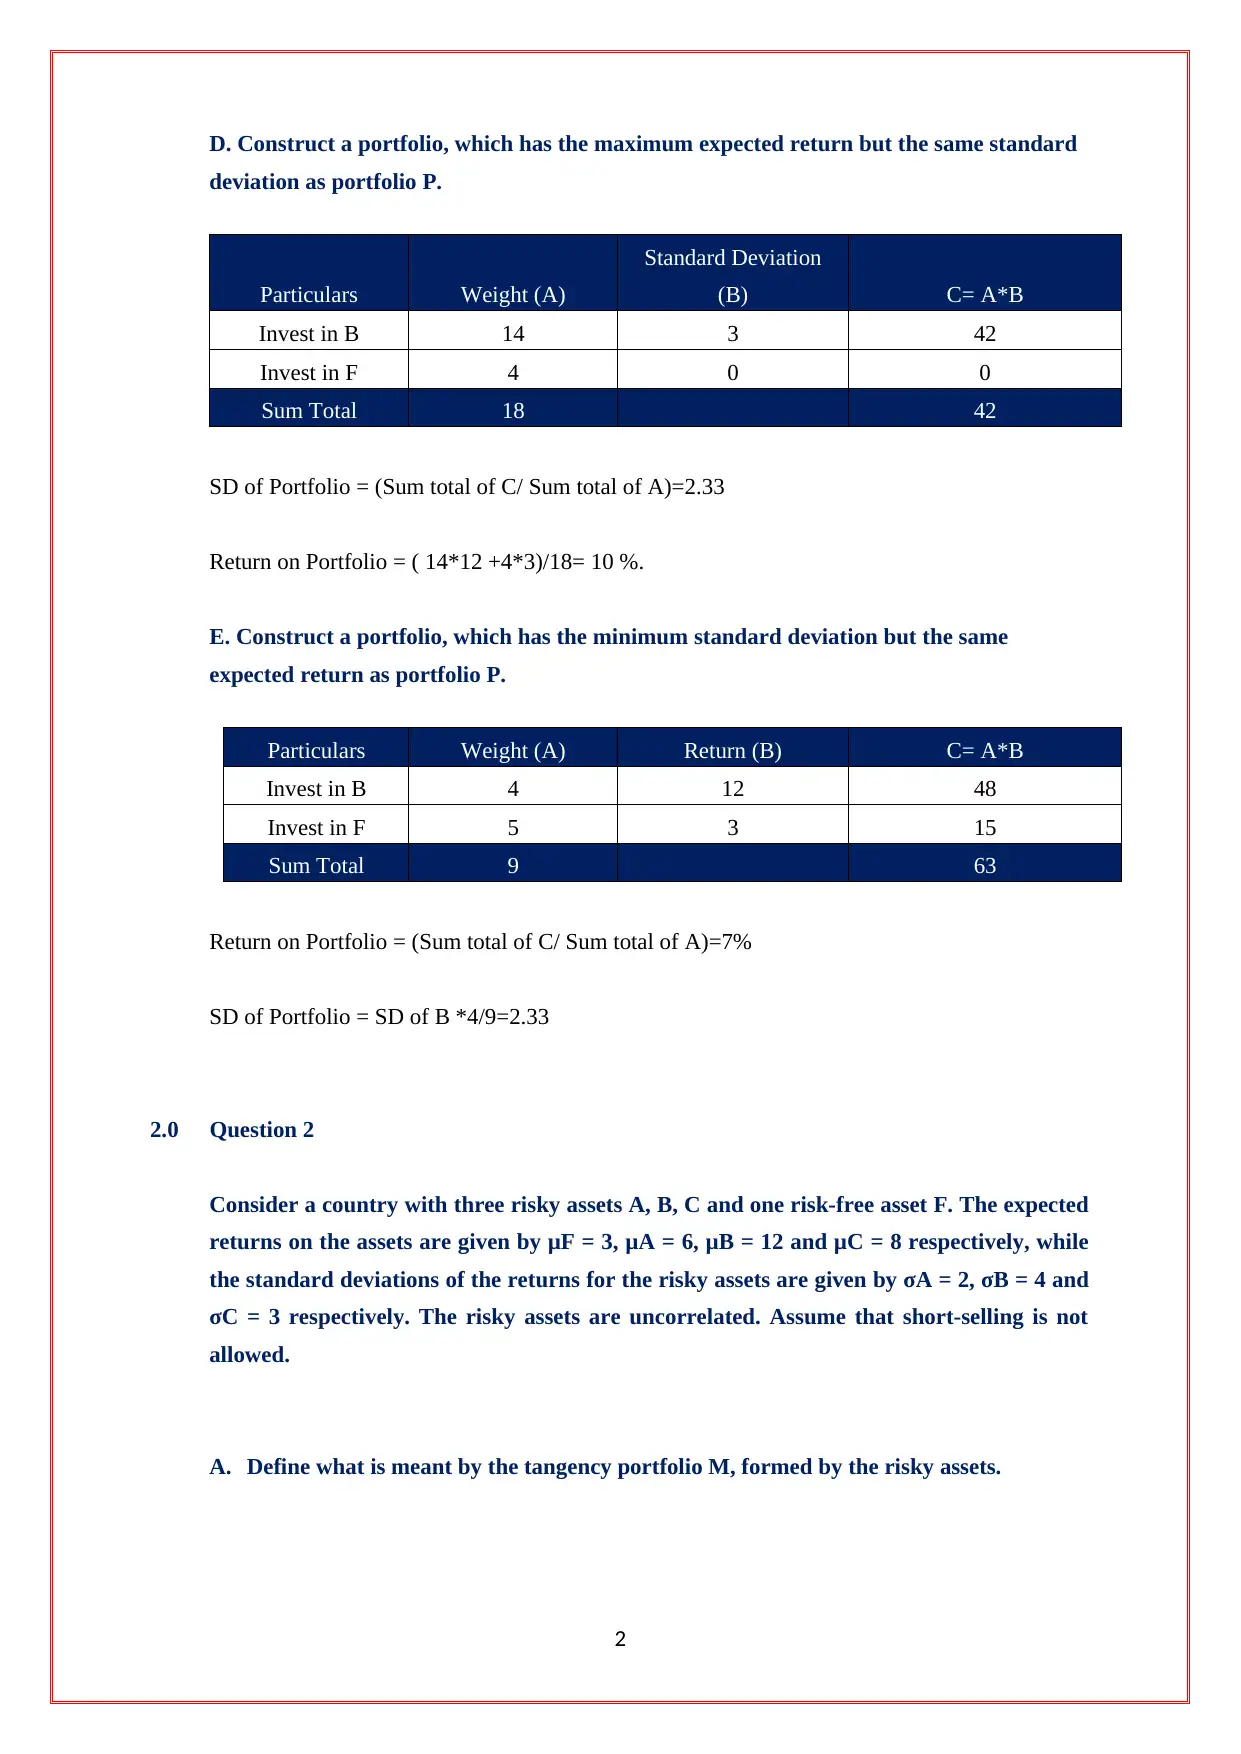
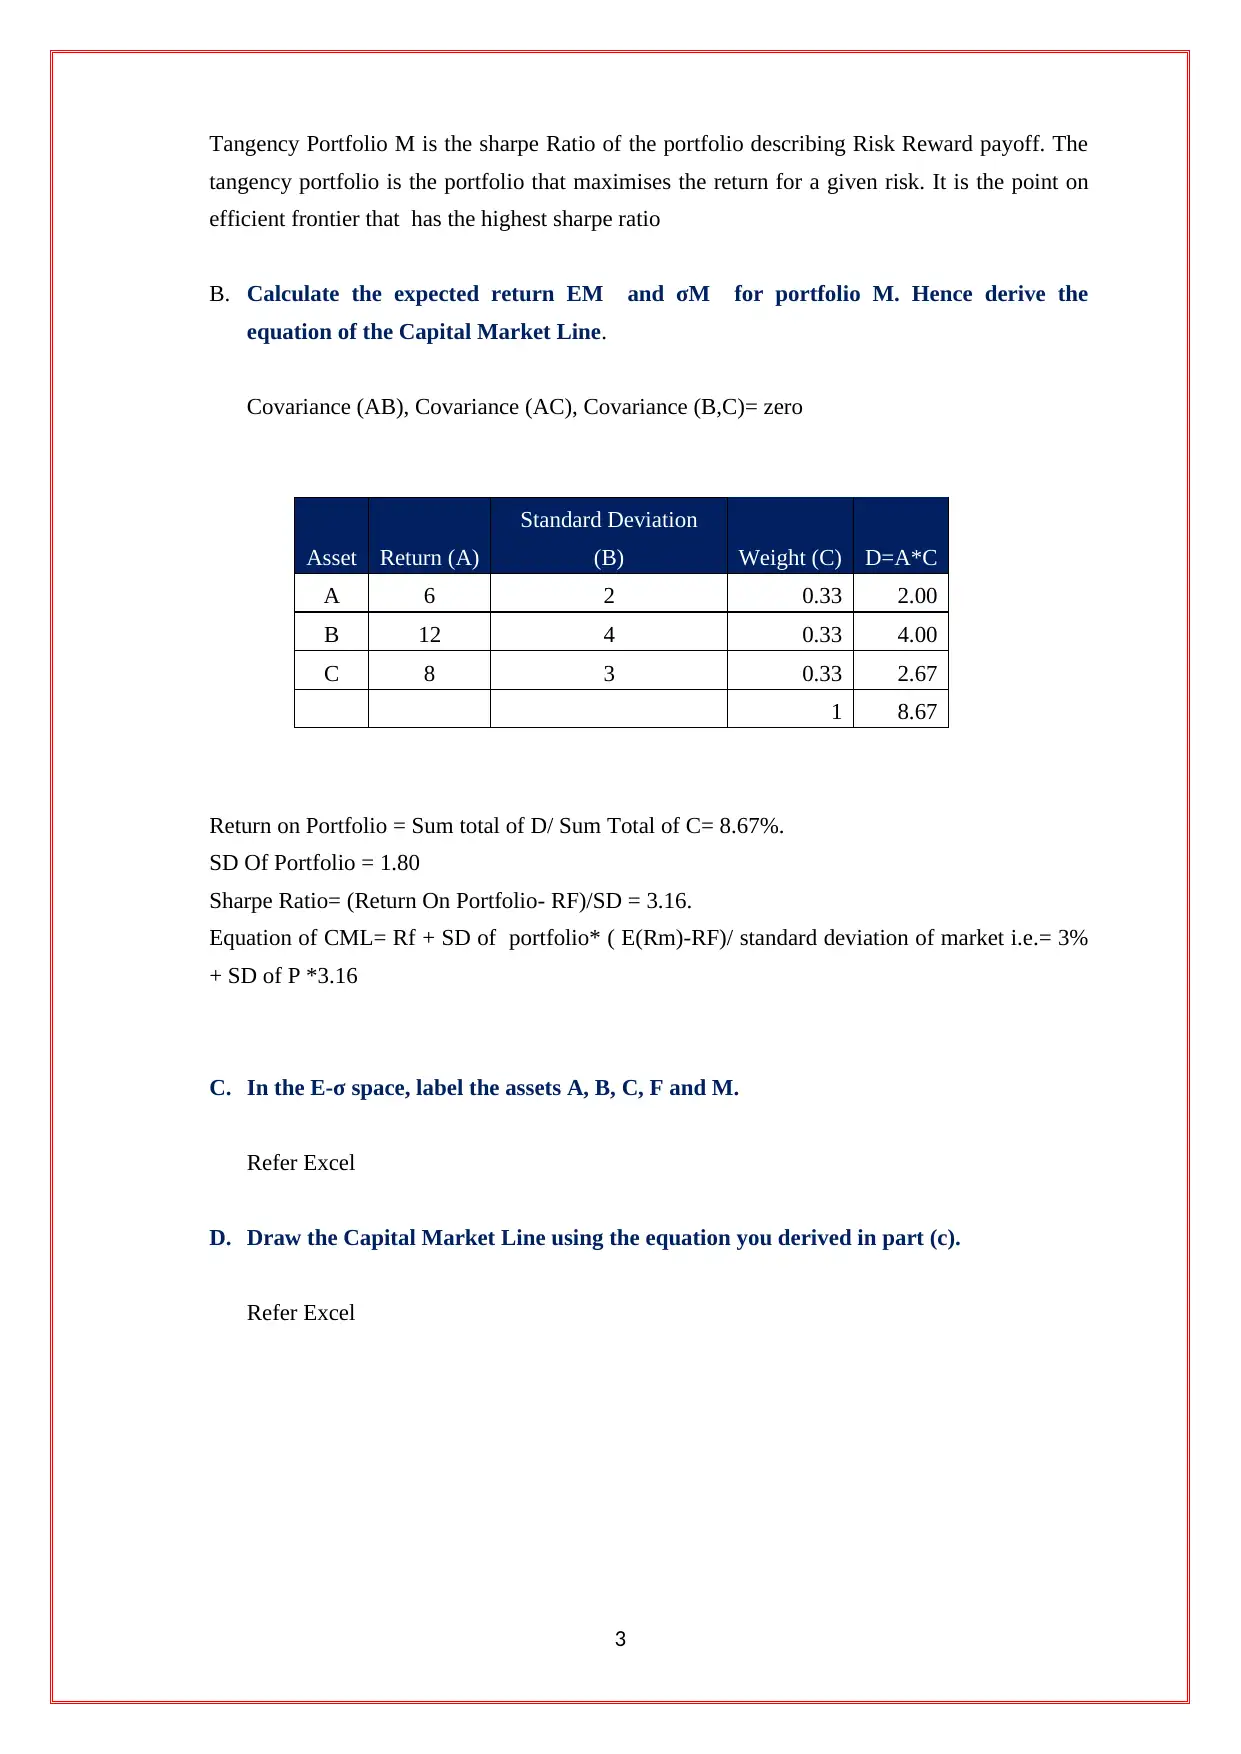
This assignment delves into the principles of portfolio construction and optimization within a financial context. It examines the interplay between risk-free and risky assets, focusing on calculating expected returns and standard deviations for various portfolio compositions. The assignment addresses key concepts such as the Capital Market Line and efficient frontier, illustrating how to construct portfolios that maximize return for a given level of risk or minimize risk for a target return. Through calculations and graphical representations, it explores different asset combinations and their impact on portfolio performance, providing a comprehensive understanding of investment strategies and risk management techniques. The solution includes calculations for portfolio returns, standard deviations, and Sharpe ratios, demonstrating how to determine the optimal portfolio allocation based on risk-reward trade-offs. It also defines the tangency portfolio and its role in maximizing the Sharpe Ratio.
Document Page
1.0 Question 1
In an economy, there are three assets available for investment, a risk-free asset F and two
risky assets, A and B. The expected returns on the assets are given by μF = 3, μA = 6 and
μB = 12 respectively, while the standard deviations of the returns for the risky assets are
given by σA = 2 and σB = 4 respectively. The two risky assets are perfectly positively
correlated. Assume that, short-selling is not allowed.
Consider a portfolio, P, formed by investing equally in the three assets A, B and F.
A. Determine the expected value and standard deviation of the return on portfolio P.
Answer
Return = Mean of Return of A, B and F =7%
Standard Deviation (SD) of A and B= Square Root ( W of A^2*SD of A ^2+ W of B^2*SD of
B ^2+ 2 SD of A* SD of B* Correlation of A and B)Bbb B)= 3.5
Standard Deviation (SD) of P = Standard Deviation (SD) of A and B *2/3= 2.33
B. For each pair of assets, i.e. AB, AF and BF separately, obtain the equations on the E-σ
space which denote the portfolios formed form each pair of assets.
Portfolio Return Standard Deviation
AB 9 3.5
AF 4.5 1
BF 7.5 1.5
The equation derived is E(R) = 1.5 SD +4.
C. Draw and label the graph of the opportunity set on the E-σ space, showing the
positions of assets A, B, F, P and the efficient frontier on the graph
Refer Excel Solution.
1
tabler-icon-diamond-filled.svg

Paraphrase This Document

Need a fresh take? Get an instant paraphrase of this document with our AI Paraphraser
Document Page
D. Construct a portfolio, which has the maximum expected return but the same standard
deviation as portfolio P.
Particulars Weight (A)
Standard Deviation
(B) C= A*B
Invest in B 14 3 42
Invest in F 4 0 0
Sum Total 18 42
SD of Portfolio = (Sum total of C/ Sum total of A)=2.33
Return on Portfolio = ( 14*12 +4*3)/18= 10 %.
E. Construct a portfolio, which has the minimum standard deviation but the same
expected return as portfolio P.
Particulars Weight (A) Return (B) C= A*B
Invest in B 4 12 48
Invest in F 5 3 15
Sum Total 9 63
Return on Portfolio = (Sum total of C/ Sum total of A)=7%
SD of Portfolio = SD of B *4/9=2.33
2.0 Question 2
Consider a country with three risky assets A, B, C and one risk-free asset F. The expected
returns on the assets are given by μF = 3, μA = 6, μB = 12 and μC = 8 respectively, while
the standard deviations of the returns for the risky assets are given by σA = 2, σB = 4 and
σC = 3 respectively. The risky assets are uncorrelated. Assume that short-selling is not
allowed.
A. Define what is meant by the tangency portfolio M, formed by the risky assets.
2
Document Page
Tangency Portfolio M is the sharpe Ratio of the portfolio describing Risk Reward payoff. The
tangency portfolio is the portfolio that maximises the return for a given risk. It is the point on
efficient frontier that has the highest sharpe ratio
B. Calculate the expected return EM and σM for portfolio M. Hence derive the
equation of the Capital Market Line.
Covariance (AB), Covariance (AC), Covariance (B,C)= zero
Asset Return (A)
Standard Deviation
(B) Weight (C) D=A*C
A 6 2 0.33 2.00
B 12 4 0.33 4.00
C 8 3 0.33 2.67
1 8.67
Return on Portfolio = Sum total of D/ Sum Total of C= 8.67%.
SD Of Portfolio = 1.80
Sharpe Ratio= (Return On Portfolio- RF)/SD = 3.16.
Equation of CML= Rf + SD of portfolio* ( E(Rm)-RF)/ standard deviation of market i.e.= 3%
+ SD of P *3.16
C. In the E-σ space, label the assets A, B, C, F and M.
Refer Excel
D. Draw the Capital Market Line using the equation you derived in part (c).
Refer Excel
3
chevron_up_icon
1 out of 3
circle_padding
hide_on_mobile
zoom_out_icon
[object Object]