Detailed Report: Organic Food Consumption Survey in Singapore

Verified

Added on  2021/12/14

|7
|788
|85
Report
AI Summary
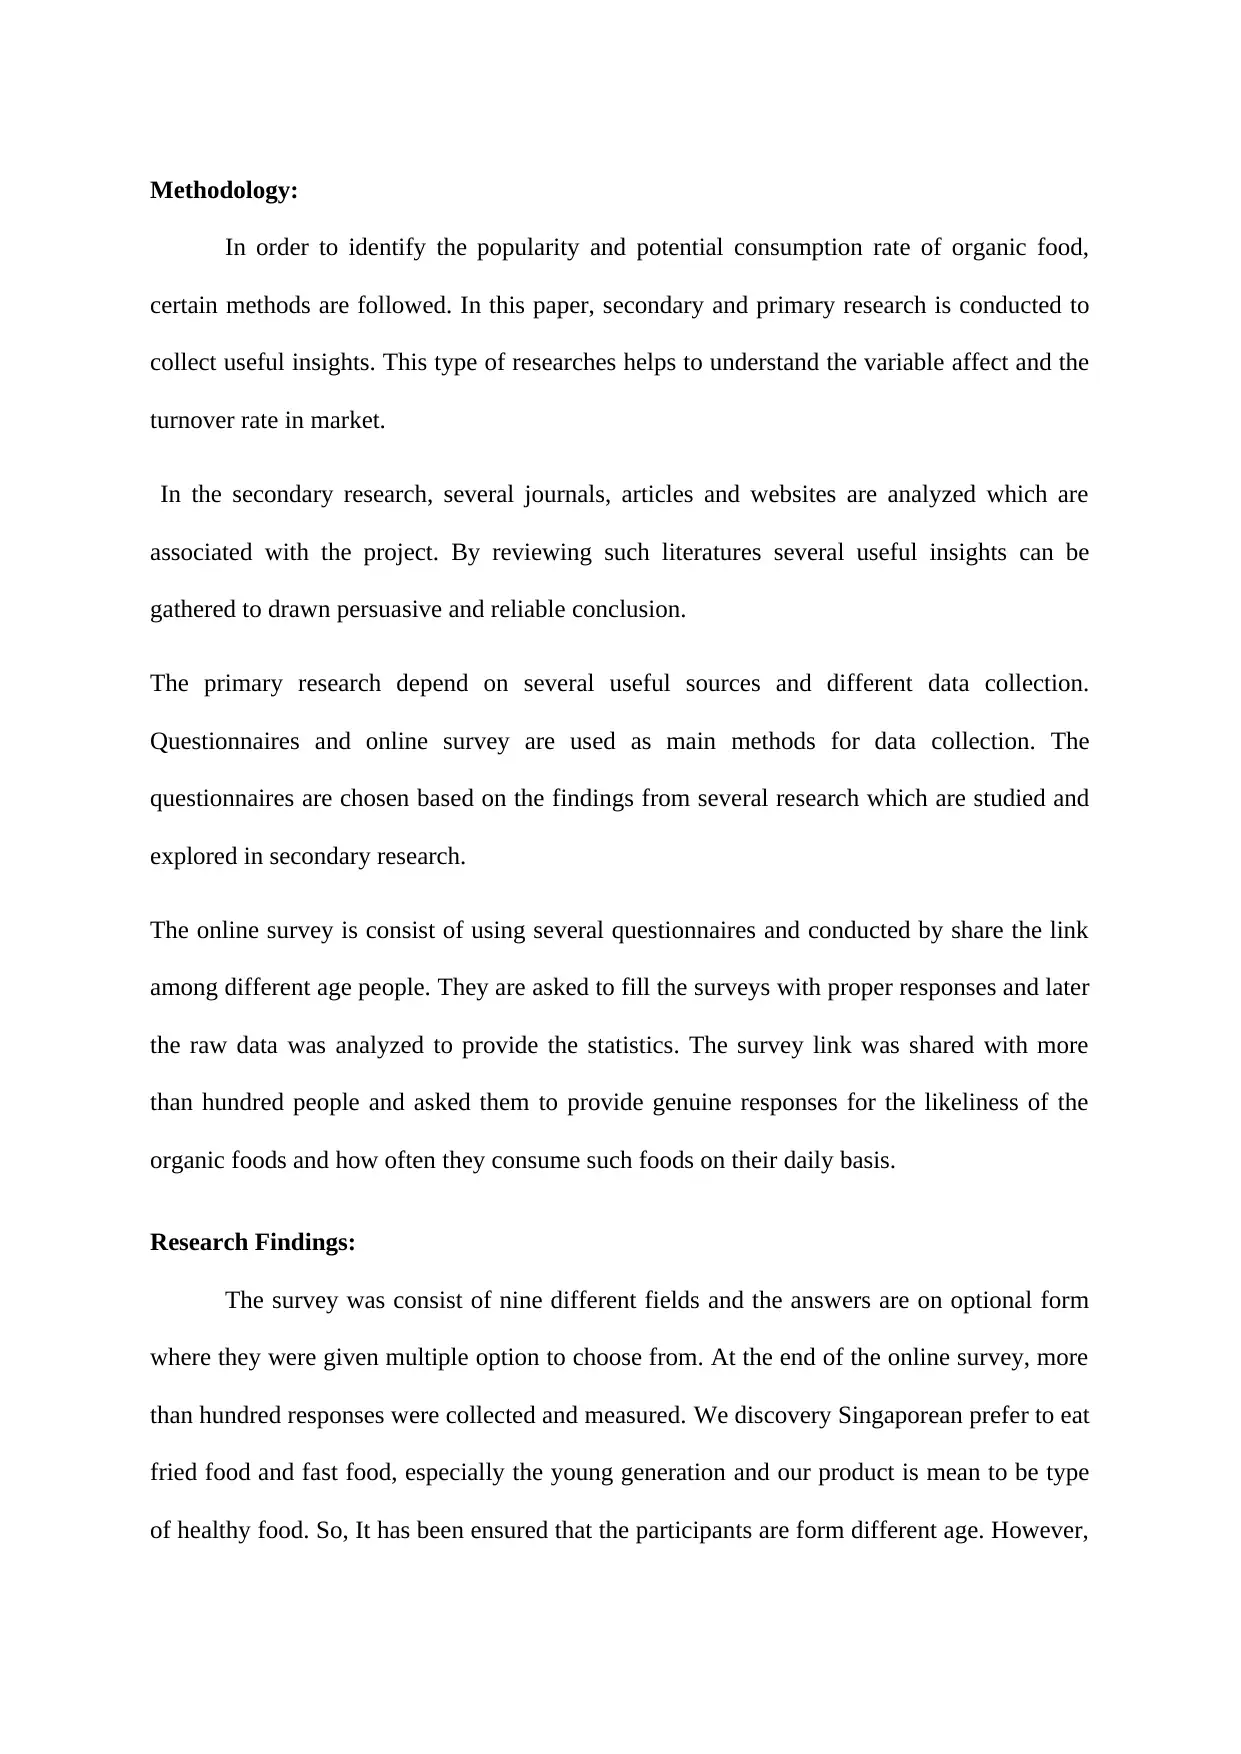
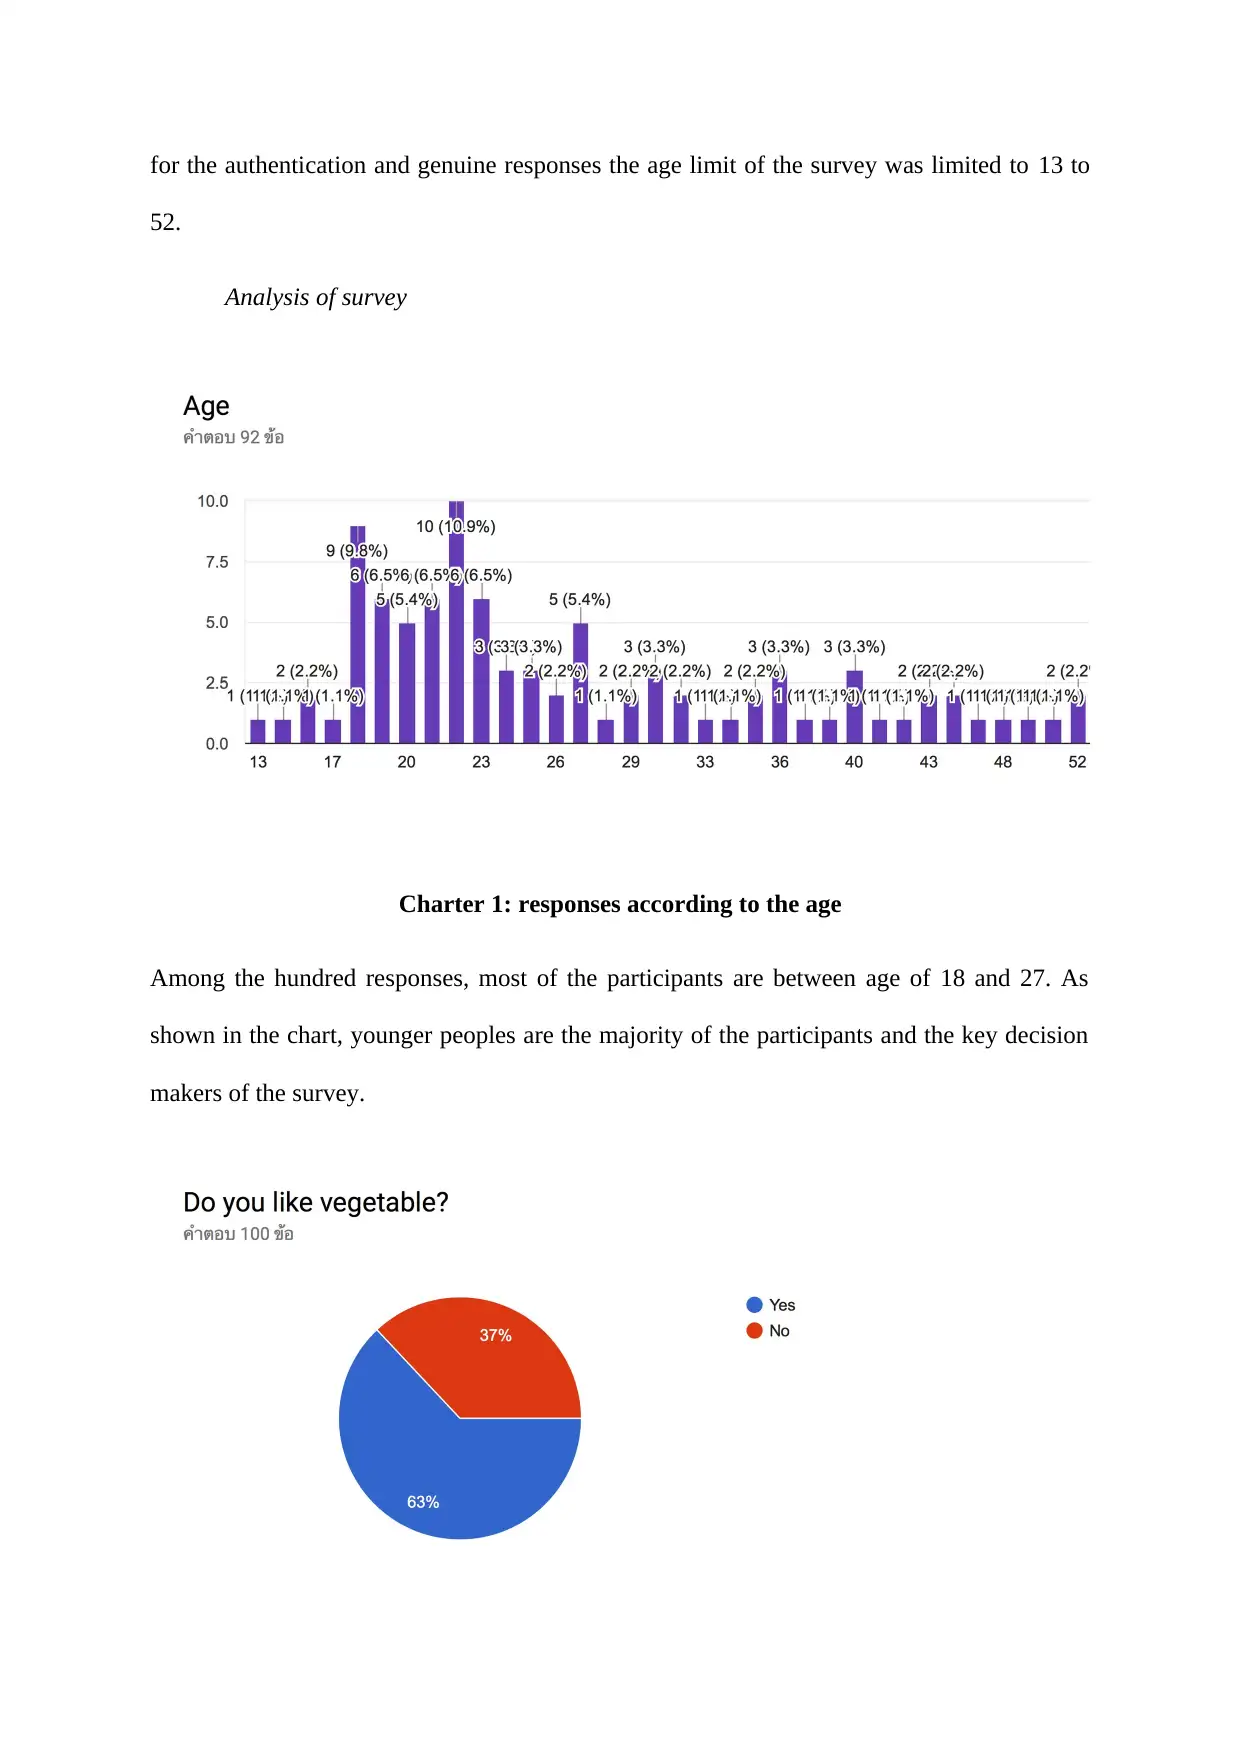
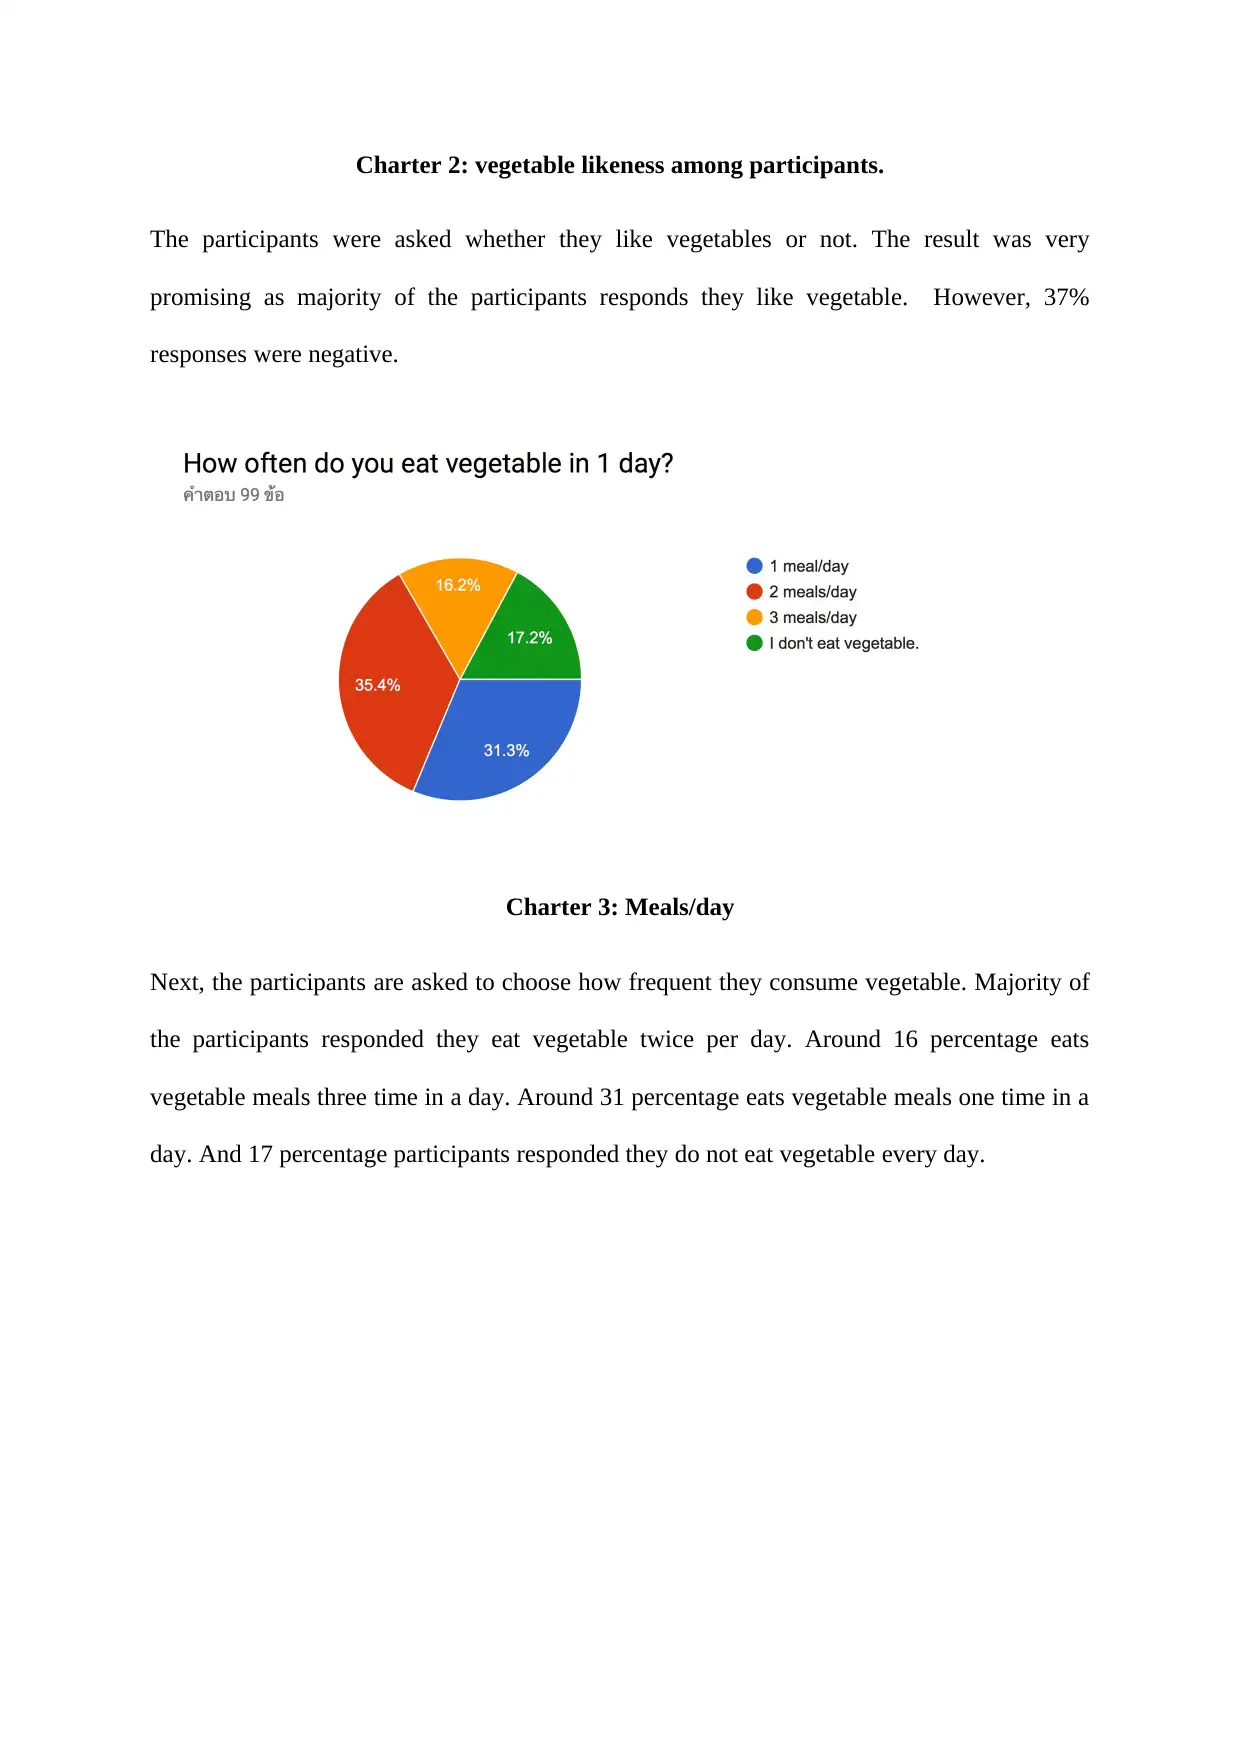
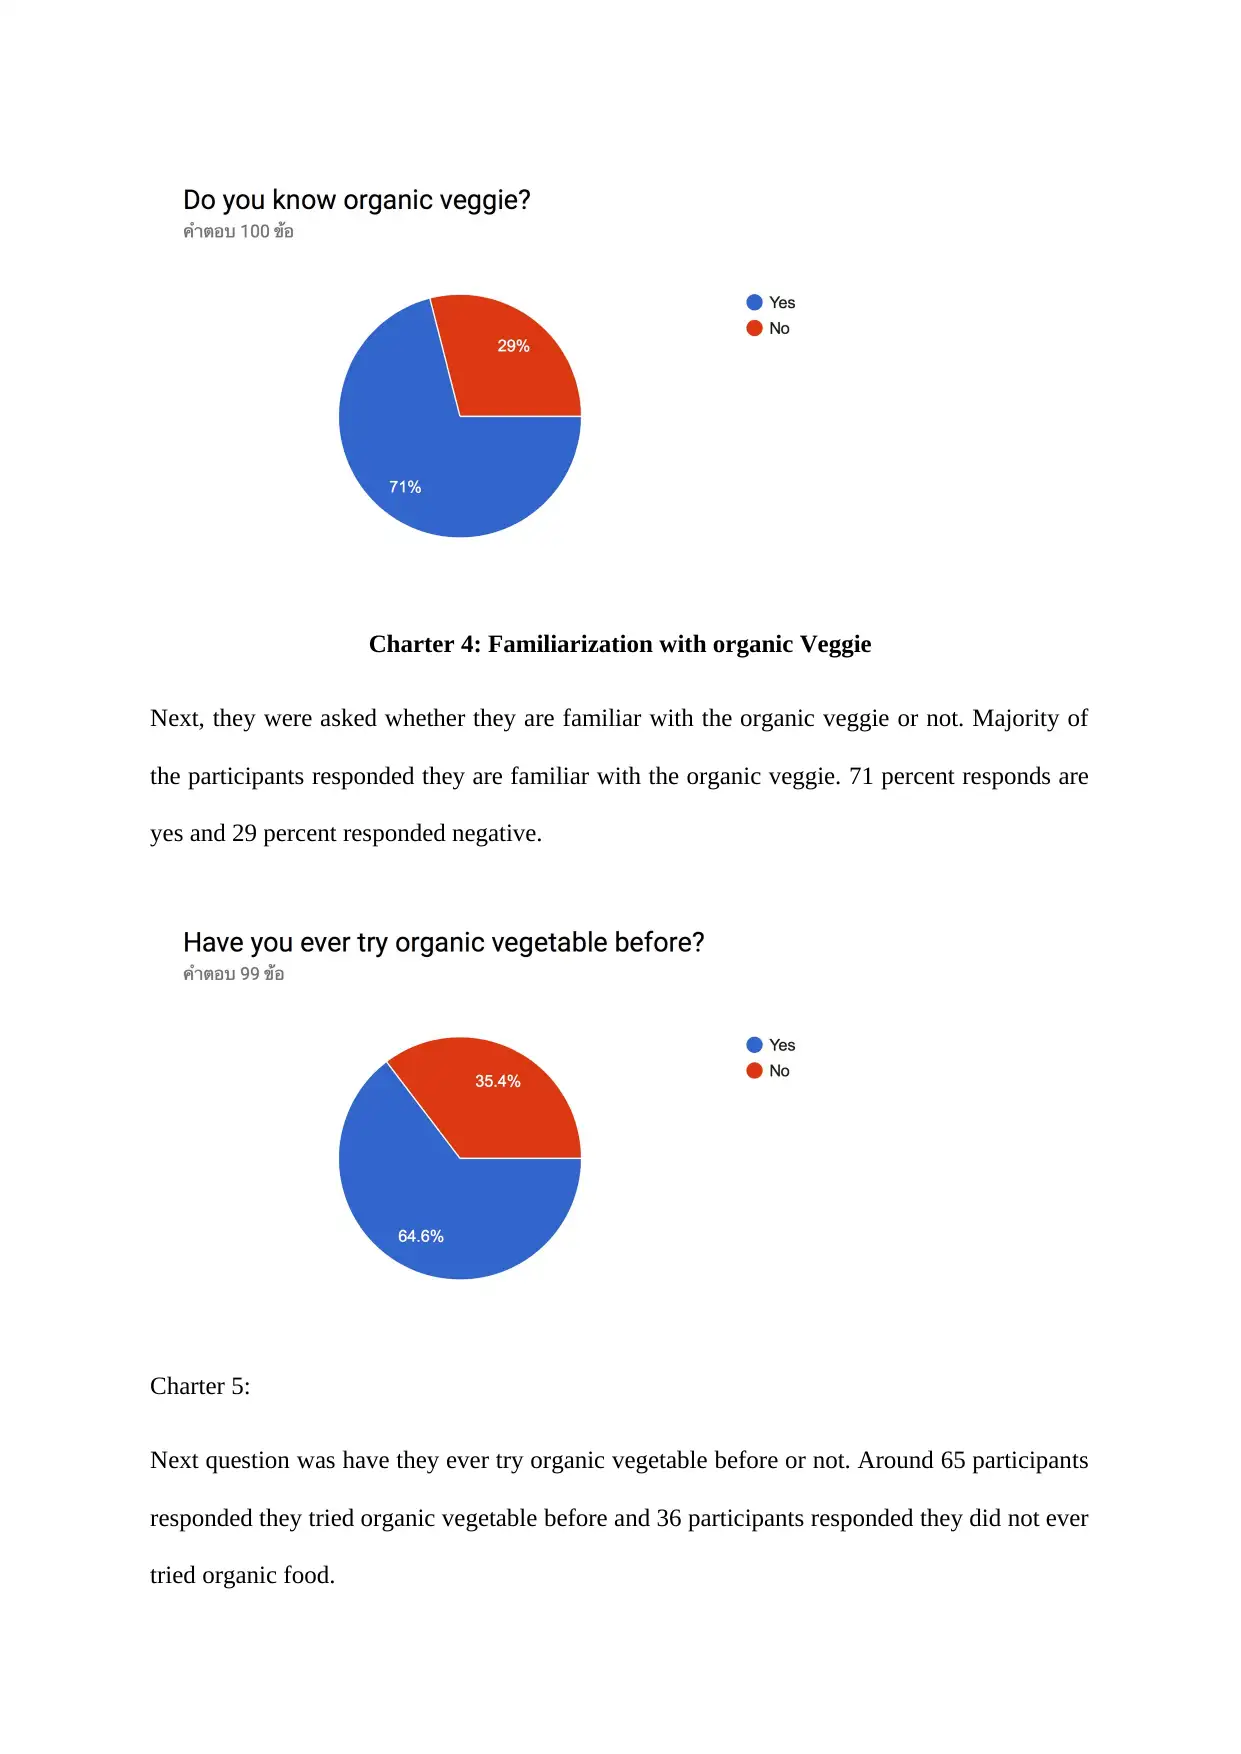
This report presents the methodology, findings, and analysis of a survey conducted to assess the popularity and potential consumption rate of organic food in Singapore. The research employed a mixed-methods approach, combining secondary research of journals and articles with primary research through questionnaires and an online survey. The survey targeted a diverse age range, with a majority of participants between 18 and 27, and explored their preferences for vegetables, frequency of consumption, familiarity with organic options, and opinions on taste and quality. The findings revealed that while a significant portion of respondents liked vegetables and were familiar with organic options, there were varying preferences in flavors and consumption habits. The analysis highlights key insights into consumer behavior and potential market opportunities for organic food products in Singapore.
Document Page
Methodology:
In order to identify the popularity and potential consumption rate of organic food,
certain methods are followed. In this paper, secondary and primary research is conducted to
collect useful insights. This type of researches helps to understand the variable affect and the
turnover rate in market.
In the secondary research, several journals, articles and websites are analyzed which are
associated with the project. By reviewing such literatures several useful insights can be
gathered to drawn persuasive and reliable conclusion.
The primary research depend on several useful sources and different data collection.
Questionnaires and online survey are used as main methods for data collection. The
questionnaires are chosen based on the findings from several research which are studied and
explored in secondary research.
The online survey is consist of using several questionnaires and conducted by share the link
among different age people. They are asked to fill the surveys with proper responses and later
the raw data was analyzed to provide the statistics. The survey link was shared with more
than hundred people and asked them to provide genuine responses for the likeliness of the
organic foods and how often they consume such foods on their daily basis.
Research Findings:
The survey was consist of nine different fields and the answers are on optional form
where they were given multiple option to choose from. At the end of the online survey, more
than hundred responses were collected and measured. We discovery Singaporean prefer to eat
fried food and fast food, especially the young generation and our product is mean to be type
of healthy food. So, It has been ensured that the participants are form different age. However,
tabler-icon-diamond-filled.svg

Secure Best Marks with AI Grader

Need help grading? Try our AI Grader for instant feedback on your assignments.
Document Page
for the authentication and genuine responses the age limit of the survey was limited to 13 to
52.
Analysis of survey
Charter 1: responses according to the age
Among the hundred responses, most of the participants are between age of 18 and 27. As
shown in the chart, younger peoples are the majority of the participants and the key decision
makers of the survey.
Document Page
Charter 2: vegetable likeness among participants.
The participants were asked whether they like vegetables or not. The result was very
promising as majority of the participants responds they like vegetable. However, 37%
responses were negative.
Charter 3: Meals/day
Next, the participants are asked to choose how frequent they consume vegetable. Majority of
the participants responded they eat vegetable twice per day. Around 16 percentage eats
vegetable meals three time in a day. Around 31 percentage eats vegetable meals one time in a
day. And 17 percentage participants responded they do not eat vegetable every day.
Document Page
Charter 4: Familiarization with organic Veggie
Next, they were asked whether they are familiar with the organic veggie or not. Majority of
the participants responded they are familiar with the organic veggie. 71 percent responds are
yes and 29 percent responded negative.
Charter 5:
Next question was have they ever try organic vegetable before or not. Around 65 participants
responded they tried organic vegetable before and 36 participants responded they did not ever
tried organic food.
tabler-icon-diamond-filled.svg

Secure Best Marks with AI Grader

Need help grading? Try our AI Grader for instant feedback on your assignments.
Document Page
Charter 6:
Next, they were asked whether they are agreed that organic vegetables are better than non
organic vegetables. Around 50 percent of the participants responded positively and 17
percent responses are negative and 32 percent responded they do not have any idea.
Charter 7:
They are asked what flavor they like most among bitter, sweet, sour, spicy and bland. 36
percent responded they like bland which was shocking and 35 percent responses was for the
sweet while sour, spicy and bitter was chosen by 5, 13 and 11 percentages of participants.
Document Page
Charter 8:
They are asked what flavor they hate most among bitter, sweet, sour, spicy and bland. 25
percent responded they do not like bland which was shocking and 13 percent responses was
for the sweet while sour, spicy and bitter was chosen by 12, 16 and 34 percentages of
participants.
Charter 9:
Next, the participants who were chosen they do not like vegetable asked why they did not
like vegetable. Around 16 percent responded that because of the bad test, 18 participants
Document Page
chose they do not like vegetable because of bad smell and 66 percentage chose they do not
like both small and test.
chevron_up_icon
1 out of 7
circle_padding
hide_on_mobile
zoom_out_icon
[object Object]