Comprehensive Financial Analysis of Origin Energy: A Detailed Report
VerifiedAdded on 2020/06/05
|11
|2386
|31
Report
AI Summary
This report provides a comprehensive financial analysis of Origin Energy, an Australian energy company. It examines the company's ownership and governance structure, identifying major shareholders and key personnel. The report delves into ratio analysis, including ROA, ROE, and debt-to-asset ratios, evaluating the company's financial performance over several years. It explores the relationship between TA/OE, ROA, and ROE, and compares Origin Energy's stock price with a market index, analyzing the impact of news on stock prices. The report calculates CAPM and beta values, along with WACC, and discusses their impact on management evaluation. Furthermore, it analyzes debt ratios, dividend policy, and concludes with investment recommendations, emphasizing the importance of thorough financial analysis for informed decision-making. This report is a valuable resource for students seeking insights into financial analysis and investment strategies.

FINANCE FOR BUSINESS
Paraphrase This Document
Need a fresh take? Get an instant paraphrase of this document with our AI Paraphraser
TABLE OF CONTENTS
INTRODUCTION...........................................................................................................................1
Ownership and governance structure...............................................................................................1
Name of main substantial shareholders.......................................................................................1
Major people involved in firm governance.................................................................................1
Ratio analysis...................................................................................................................................2
Phenomena of variable TA/OE and its impact on relationship exist between ROA and ROE...3
Reason behind higher or lower value of ROE then ROA............................................................3
Stock price comparison with index..................................................................................................3
Charting of stock price and index................................................................................................3
Analysis of facts..........................................................................................................................4
Impact of news on stock price.........................................................................................................4
Calculation of CAPM and beta value..............................................................................................4
Beta value....................................................................................................................................4
CAPM model...............................................................................................................................4
Weighted average cost of capital.....................................................................................................4
Calculation ofWACC...................................................................................................................4
Impact that WACC have on management evaluation..................................................................5
Analysis of debt ratio for past two years.........................................................................................5
Debt and equity ratio...................................................................................................................5
Action taken to amend ratio.........................................................................................................5
Dividend policy of the firm.............................................................................................................5
Recomndation report.......................................................................................................................5
CONCLUSION................................................................................................................................6
REFERENCES................................................................................................................................7
Table 1Ratio analysis of Origin Energy Ltd....................................................................................2
Table 2CAPM model.......................................................................................................................4
Table 3Debt and equity ratio...........................................................................................................5
Table 2CAPM model.......................................................................................................................4
Table 3Debt and equity ratio...........................................................................................................5
⊘ This is a preview!⊘
Do you want full access?
Subscribe today to unlock all pages.
Trusted by 1+ million students worldwide
INTRODUCTION
Origin is an Australian company that is publicly listed and operate in enegry sector of
Australia. Origin energy company was formed in year 2000 when its parent company observed
that oil and natural gas segment can be created as separate company. This company formed as a
results of demerger of company Boral limited. In current time period firm major business is to do
oil and natural gas exploration as well as production of same. Apart from this, company is also
involved in energy retailing and generation of electricity at workplace. It can be said that firm
business is wide and it working on multiple areas related to oil and natural gas. In year 2001 and
2002 historical dates are observed when Origin make purchase of Victorian electricity network
suppliers Powercor and CitiPower. In year 2004 SEAGas pipeline was build up and it was linked
to Victorian and South Australia gas market. Apart from this, company also aquire stake in other
firms and it can be said that year 2001,2002 and 2004 acts as turning point for the firm which
pave a way of success for the company.
Ownership and governance structure
Name of main substantial shareholders
Mahor shareholders that have shareholding more then 20% in the company are G.Cains.
Apart from this, there are some of the shareholders that hold more then 5% in the company and
same are B Morgan, J. Akeshurst, M Brenner, S Perkins and S Sargent. Thus, it can be said that
there are major of shareholders in the company management that have shareholding more then
5%. There is single individual that have shareholding in the company more then 20% (Origin,
2017). It can be said that there are not many shareholders in the company that have majority of
control and company is not like family firm that is only controlled by few people. Governance
structure is balanced in nature and it can be said that corporate governance may be sound in the
firm due to lack of control of power in fee hands.
Major people involved in firm governance
Chairman and CEO are the two entities that have huge influence on the firm governance.
It can be observed that these entities always lead Board of Directors that handle entire operations
of the company. Thus, it can be said that major people that are involved in the firm governnance
are Chairman and CEO. Apart from this, non executive and executive Directors are the important
part of Board of Directors and they are involved in firm day to day governance. Only G Cairns
hold stake more then 20% . Apart from this, M Schbert and G Mallett also have shareholding
1 | P a g e
Paraphrase This Document
Need a fresh take? Get an instant paraphrase of this document with our AI Paraphraser
more then 20% which are executive director in the company. Hence, it can be said that there are
few Directors that have shareholding more then 20% in the firm business. Apart from this, other
Board of Directors have shareholding more then 5% but less then 20% (Origin, 2017). Thus, it
can be said that company is not family centric in nature.
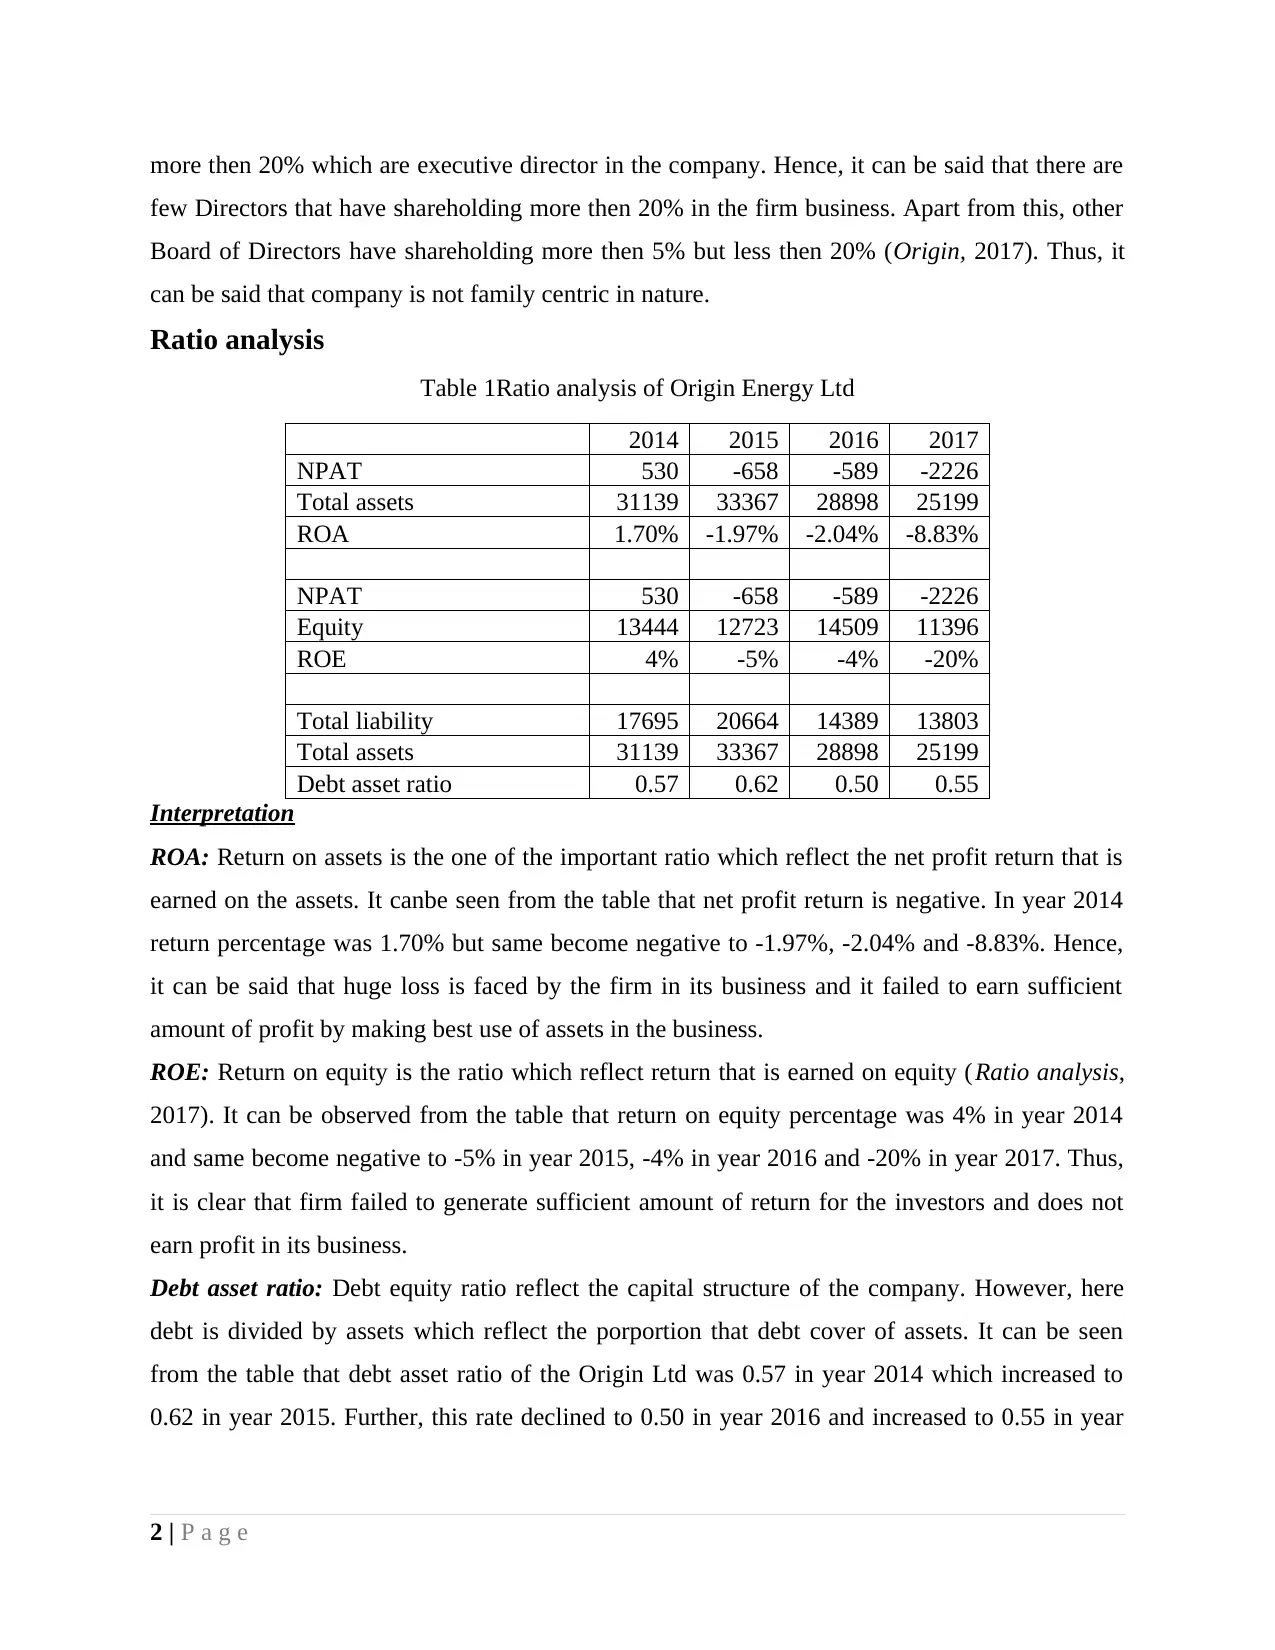
Ratio analysis
Table 1Ratio analysis of Origin Energy Ltd
2014 2015 2016 2017
NPAT 530 -658 -589 -2226
Total assets 31139 33367 28898 25199
ROA 1.70% -1.97% -2.04% -8.83%
NPAT 530 -658 -589 -2226
Equity 13444 12723 14509 11396
ROE 4% -5% -4% -20%
Total liability 17695 20664 14389 13803
Total assets 31139 33367 28898 25199
Debt asset ratio 0.57 0.62 0.50 0.55
Interpretation
ROA: Return on assets is the one of the important ratio which reflect the net profit return that is
earned on the assets. It canbe seen from the table that net profit return is negative. In year 2014
return percentage was 1.70% but same become negative to -1.97%, -2.04% and -8.83%. Hence,
it can be said that huge loss is faced by the firm in its business and it failed to earn sufficient
amount of profit by making best use of assets in the business.
ROE: Return on equity is the ratio which reflect return that is earned on equity (Ratio analysis,
2017). It can be observed from the table that return on equity percentage was 4% in year 2014
and same become negative to -5% in year 2015, -4% in year 2016 and -20% in year 2017. Thus,
it is clear that firm failed to generate sufficient amount of return for the investors and does not
earn profit in its business.
Debt asset ratio: Debt equity ratio reflect the capital structure of the company. However, here
debt is divided by assets which reflect the porportion that debt cover of assets. It can be seen
from the table that debt asset ratio of the Origin Ltd was 0.57 in year 2014 which increased to
0.62 in year 2015. Further, this rate declined to 0.50 in year 2016 and increased to 0.55 in year
2 | P a g e
few Directors that have shareholding more then 20% in the firm business. Apart from this, other
Board of Directors have shareholding more then 5% but less then 20% (Origin, 2017). Thus, it
can be said that company is not family centric in nature.
Ratio analysis
Table 1Ratio analysis of Origin Energy Ltd
2014 2015 2016 2017
NPAT 530 -658 -589 -2226
Total assets 31139 33367 28898 25199
ROA 1.70% -1.97% -2.04% -8.83%
NPAT 530 -658 -589 -2226
Equity 13444 12723 14509 11396
ROE 4% -5% -4% -20%
Total liability 17695 20664 14389 13803
Total assets 31139 33367 28898 25199
Debt asset ratio 0.57 0.62 0.50 0.55
Interpretation
ROA: Return on assets is the one of the important ratio which reflect the net profit return that is
earned on the assets. It canbe seen from the table that net profit return is negative. In year 2014
return percentage was 1.70% but same become negative to -1.97%, -2.04% and -8.83%. Hence,
it can be said that huge loss is faced by the firm in its business and it failed to earn sufficient
amount of profit by making best use of assets in the business.
ROE: Return on equity is the ratio which reflect return that is earned on equity (Ratio analysis,
2017). It can be observed from the table that return on equity percentage was 4% in year 2014
and same become negative to -5% in year 2015, -4% in year 2016 and -20% in year 2017. Thus,
it is clear that firm failed to generate sufficient amount of return for the investors and does not
earn profit in its business.
Debt asset ratio: Debt equity ratio reflect the capital structure of the company. However, here
debt is divided by assets which reflect the porportion that debt cover of assets. It can be seen
from the table that debt asset ratio of the Origin Ltd was 0.57 in year 2014 which increased to
0.62 in year 2015. Further, this rate declined to 0.50 in year 2016 and increased to 0.55 in year
2 | P a g e
2017. Thus, it can be said that liability cover 50% of assets and firm is able to pay all its debt by
using assets in the business.
Phenomena of variable TA/OE and its impact on relationship exist between ROA and ROE
TA/OE refers to the formula under which total assets divided by operating earning. Thus,
it can be said that formula reflect assets that are on each unit of earning (Drake and Fabozzi,
2012). It have relevance to the return on assets and return on equity. If TA/OE increased then it
means that with increase in operating earning assets value will also enhanced. Hence, if asset
value will increase then in that case reuturn on assets will also increase but no change will come
in return on equity. Thus, it can be said that TA/OE have impact on ROA and ROE. With change
in TA/OE variation automatically comes in ROA and ROE.
Reason behind higher or lower value of ROE then ROA
Most of times it is observed that value of ROE is greater or less then ROA by greater
points. This is because earning value and assets value also remain in distance with each other in
terms of value. Hence, it can be said that there is always higher gap between equity and assets
value and due to this reason values of return on equity and return on assets remain quite different
from each other (Gibson, 2011). However, both measures reflect overall performance of the
company and due to this reason both return on equity and return on assets ratios are given due
importance.
3 | P a g e
⊘ This is a preview!⊘
Do you want full access?
Subscribe today to unlock all pages.
Trusted by 1+ million students worldwide
Stock price comparison with index
Charting of stock price and index
1 2 3 4 5 6 7 8 9 10 11 12 13 14 15 16 17 18 19 20 21 22 23
-15%
-10%
-5%
0%
5%
10%
15%
20%
Chart Title
AORD ORG
Figure 1Charting of stock price and index
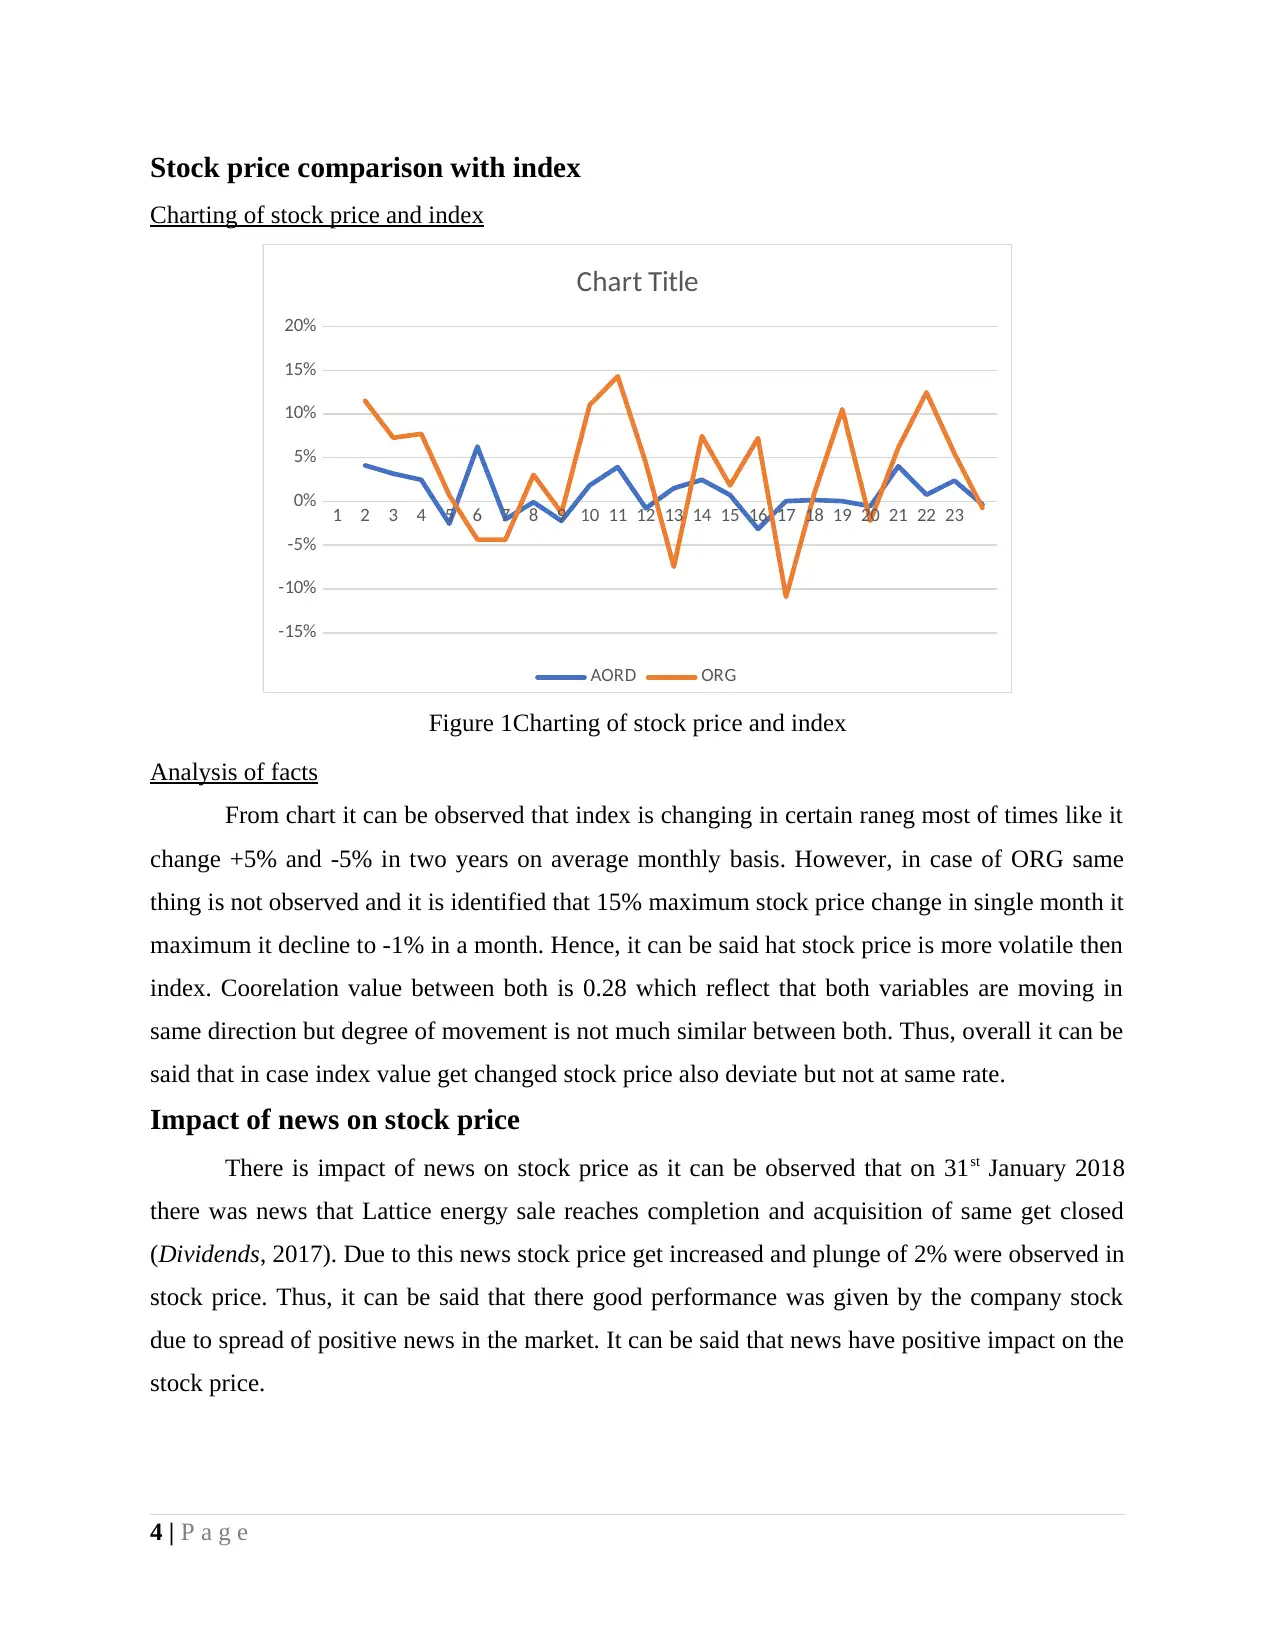
Analysis of facts
From chart it can be observed that index is changing in certain raneg most of times like it
change +5% and -5% in two years on average monthly basis. However, in case of ORG same
thing is not observed and it is identified that 15% maximum stock price change in single month it
maximum it decline to -1% in a month. Hence, it can be said hat stock price is more volatile then
index. Coorelation value between both is 0.28 which reflect that both variables are moving in
same direction but degree of movement is not much similar between both. Thus, overall it can be
said that in case index value get changed stock price also deviate but not at same rate.
Impact of news on stock price
There is impact of news on stock price as it can be observed that on 31st January 2018
there was news that Lattice energy sale reaches completion and acquisition of same get closed
(Dividends, 2017). Due to this news stock price get increased and plunge of 2% were observed in
stock price. Thus, it can be said that there good performance was given by the company stock
due to spread of positive news in the market. It can be said that news have positive impact on the
stock price.
4 | P a g e
Charting of stock price and index
1 2 3 4 5 6 7 8 9 10 11 12 13 14 15 16 17 18 19 20 21 22 23
-15%
-10%
-5%
0%
5%
10%
15%
20%
Chart Title
AORD ORG
Figure 1Charting of stock price and index
Analysis of facts
From chart it can be observed that index is changing in certain raneg most of times like it
change +5% and -5% in two years on average monthly basis. However, in case of ORG same
thing is not observed and it is identified that 15% maximum stock price change in single month it
maximum it decline to -1% in a month. Hence, it can be said hat stock price is more volatile then
index. Coorelation value between both is 0.28 which reflect that both variables are moving in
same direction but degree of movement is not much similar between both. Thus, overall it can be
said that in case index value get changed stock price also deviate but not at same rate.
Impact of news on stock price
There is impact of news on stock price as it can be observed that on 31st January 2018
there was news that Lattice energy sale reaches completion and acquisition of same get closed
(Dividends, 2017). Due to this news stock price get increased and plunge of 2% were observed in
stock price. Thus, it can be said that there good performance was given by the company stock
due to spread of positive news in the market. It can be said that news have positive impact on the
stock price.
4 | P a g e
Paraphrase This Document
Need a fresh take? Get an instant paraphrase of this document with our AI Paraphraser
Calculation of CAPM and beta value
Beta value
Beta value is 0.10 which reflect that with change in index positive change comes in stock
price. Value of slope is very low which is 0.10 and this indicate that with change in index minor
change comes in stock price.
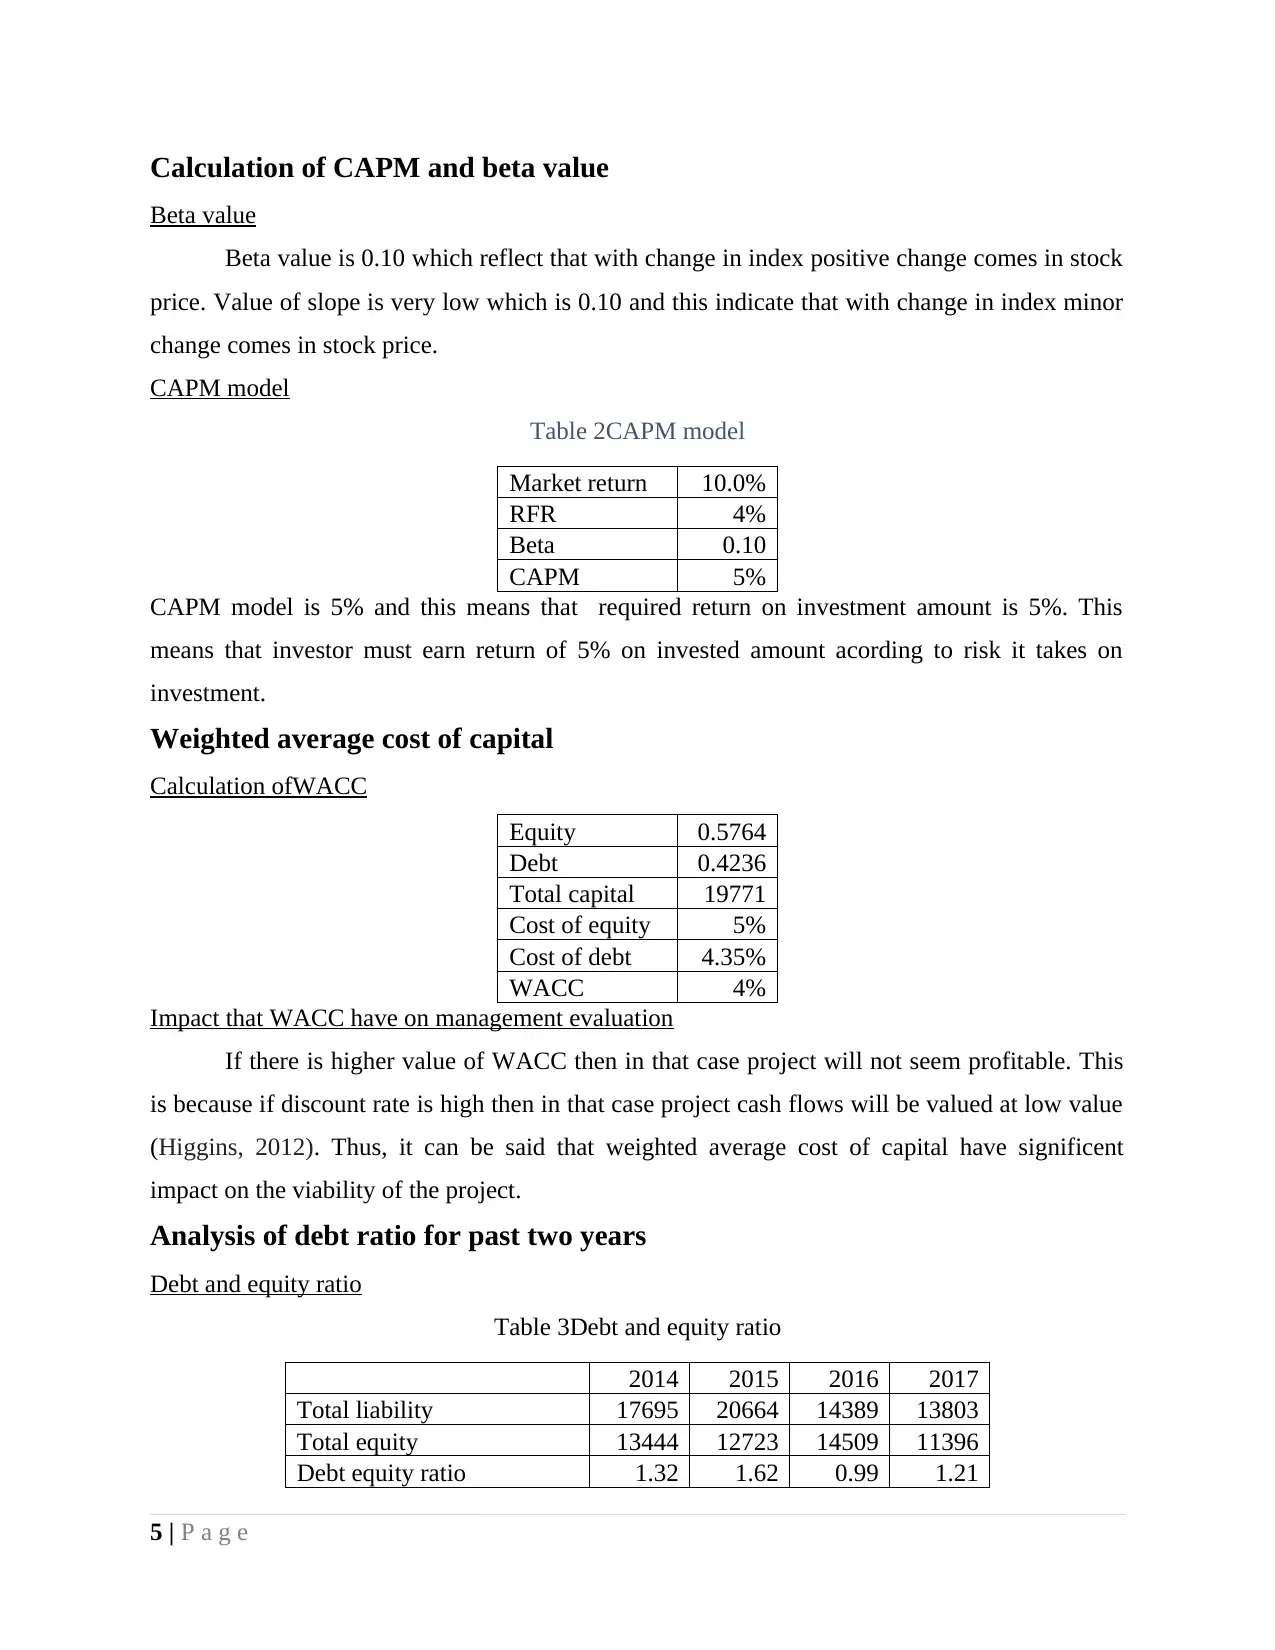
CAPM model
Table 2CAPM model
Market return 10.0%
RFR 4%
Beta 0.10
CAPM 5%
CAPM model is 5% and this means that required return on investment amount is 5%. This
means that investor must earn return of 5% on invested amount acording to risk it takes on
investment.
Weighted average cost of capital
Calculation ofWACC
Equity 0.5764
Debt 0.4236
Total capital 19771
Cost of equity 5%
Cost of debt 4.35%
WACC 4%
Impact that WACC have on management evaluation
If there is higher value of WACC then in that case project will not seem profitable. This
is because if discount rate is high then in that case project cash flows will be valued at low value
(Higgins, 2012). Thus, it can be said that weighted average cost of capital have significent
impact on the viability of the project.
Analysis of debt ratio for past two years
Debt and equity ratio
Table 3Debt and equity ratio
2014 2015 2016 2017
Total liability 17695 20664 14389 13803
Total equity 13444 12723 14509 11396
Debt equity ratio 1.32 1.62 0.99 1.21
5 | P a g e
Beta value
Beta value is 0.10 which reflect that with change in index positive change comes in stock
price. Value of slope is very low which is 0.10 and this indicate that with change in index minor
change comes in stock price.
CAPM model
Table 2CAPM model
Market return 10.0%
RFR 4%
Beta 0.10
CAPM 5%
CAPM model is 5% and this means that required return on investment amount is 5%. This
means that investor must earn return of 5% on invested amount acording to risk it takes on
investment.
Weighted average cost of capital
Calculation ofWACC
Equity 0.5764
Debt 0.4236
Total capital 19771
Cost of equity 5%
Cost of debt 4.35%
WACC 4%
Impact that WACC have on management evaluation
If there is higher value of WACC then in that case project will not seem profitable. This
is because if discount rate is high then in that case project cash flows will be valued at low value
(Higgins, 2012). Thus, it can be said that weighted average cost of capital have significent
impact on the viability of the project.
Analysis of debt ratio for past two years
Debt and equity ratio
Table 3Debt and equity ratio
2014 2015 2016 2017
Total liability 17695 20664 14389 13803
Total equity 13444 12723 14509 11396
Debt equity ratio 1.32 1.62 0.99 1.21
5 | P a g e
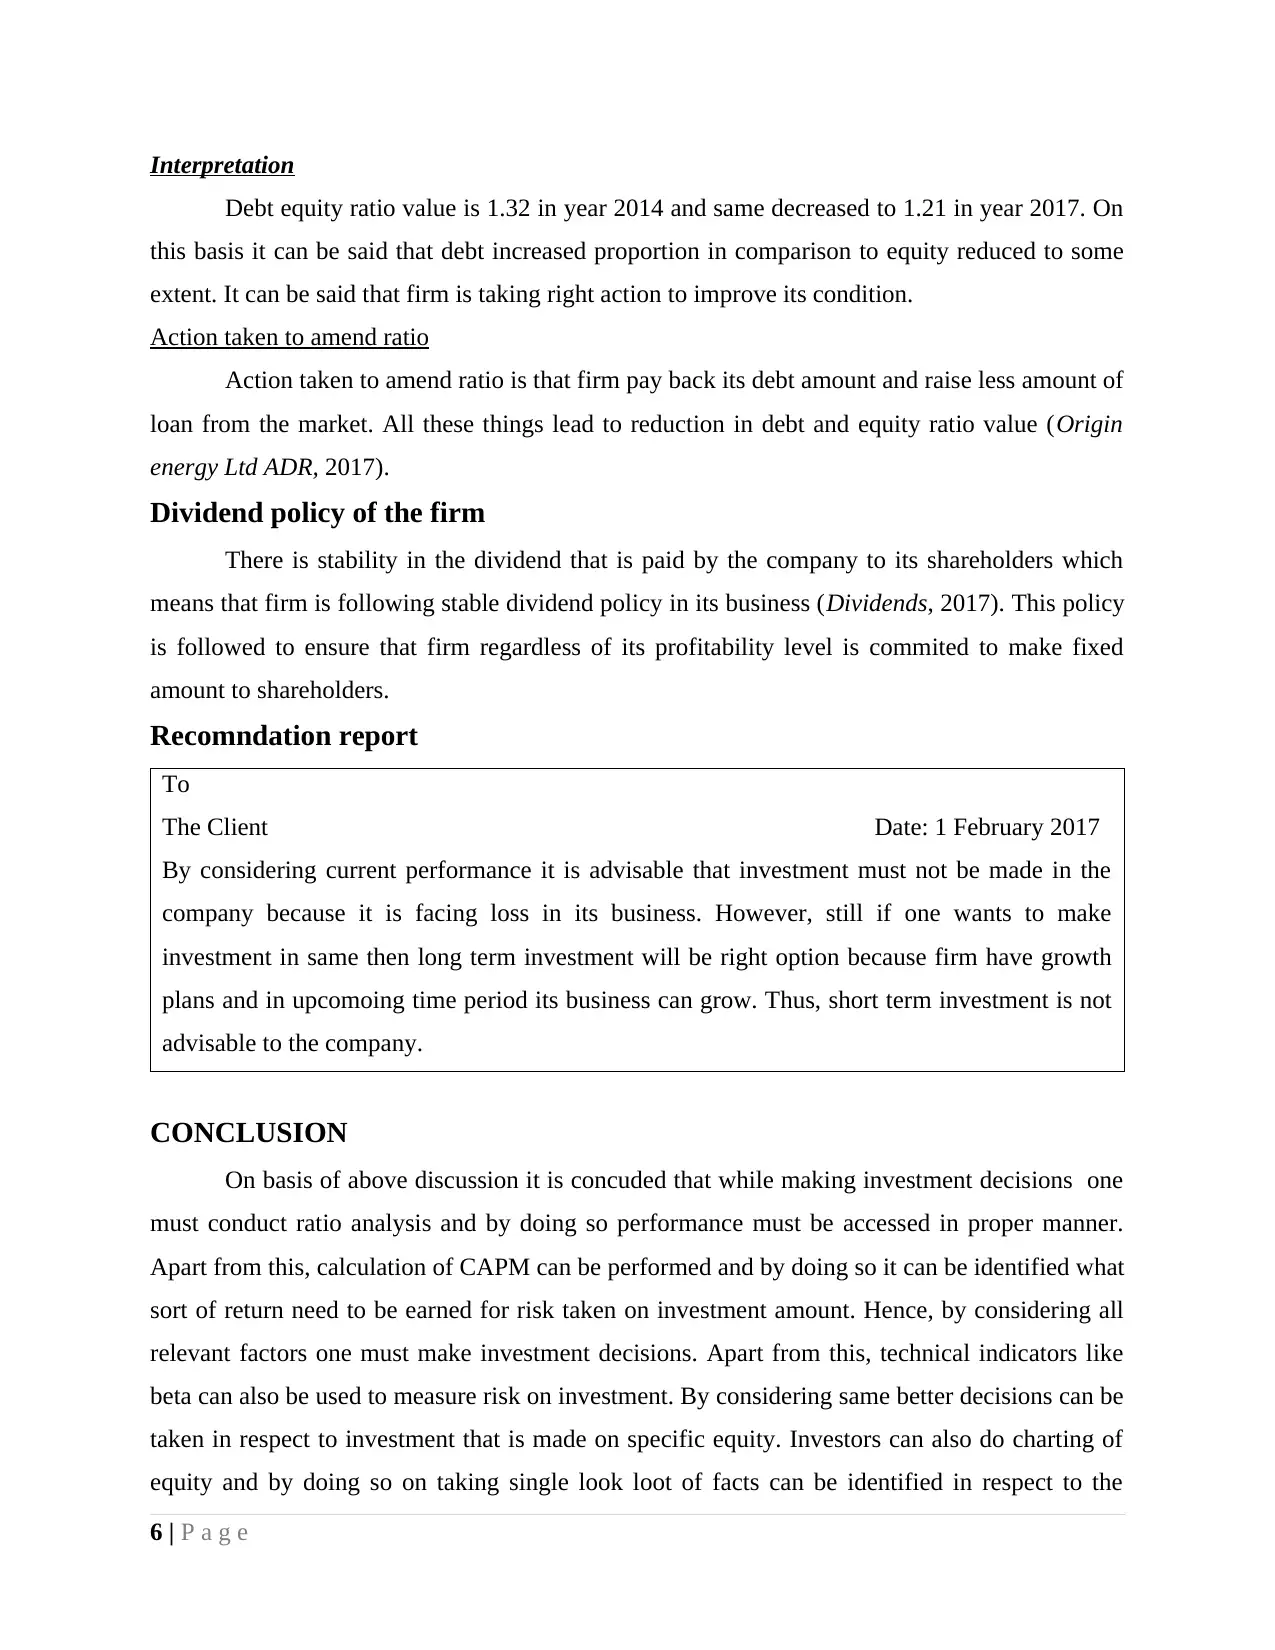
Interpretation
Debt equity ratio value is 1.32 in year 2014 and same decreased to 1.21 in year 2017. On
this basis it can be said that debt increased proportion in comparison to equity reduced to some
extent. It can be said that firm is taking right action to improve its condition.
Action taken to amend ratio
Action taken to amend ratio is that firm pay back its debt amount and raise less amount of
loan from the market. All these things lead to reduction in debt and equity ratio value (Origin
energy Ltd ADR, 2017).
Dividend policy of the firm
There is stability in the dividend that is paid by the company to its shareholders which
means that firm is following stable dividend policy in its business (Dividends, 2017). This policy
is followed to ensure that firm regardless of its profitability level is commited to make fixed
amount to shareholders.
Recomndation report
To
The Client Date: 1 February 2017
By considering current performance it is advisable that investment must not be made in the
company because it is facing loss in its business. However, still if one wants to make
investment in same then long term investment will be right option because firm have growth
plans and in upcomoing time period its business can grow. Thus, short term investment is not
advisable to the company.
CONCLUSION
On basis of above discussion it is concuded that while making investment decisions one
must conduct ratio analysis and by doing so performance must be accessed in proper manner.
Apart from this, calculation of CAPM can be performed and by doing so it can be identified what
sort of return need to be earned for risk taken on investment amount. Hence, by considering all
relevant factors one must make investment decisions. Apart from this, technical indicators like
beta can also be used to measure risk on investment. By considering same better decisions can be
taken in respect to investment that is made on specific equity. Investors can also do charting of
equity and by doing so on taking single look loot of facts can be identified in respect to the
6 | P a g e
⊘ This is a preview!⊘
Do you want full access?
Subscribe today to unlock all pages.
Trusted by 1+ million students worldwide

company stocks. Hence, by using all these tools better investment decisions can be taken by
individuals.
7 | P a g e
individuals.
7 | P a g e
Paraphrase This Document
Need a fresh take? Get an instant paraphrase of this document with our AI Paraphraser
REFERENCES
Books and Journals
Drake, P.P. and Fabozzi, F.J., 2012. Financial ratio analysis. Handbook of Finance.
Gibson, C.H., 2011. Financial reporting and analysis. South-Western Cengage Learning.
Higgins, R.C., 2012. Analysis for financial management. McGraw-Hill/Irwin.
Online
Dividends, 2017. [Online]. Available through:<
https://www.originenergy.com.au/about/investors-media/dividends.html>.
Origin energy Ltd ADR, 2017. [Online]. Available through:<
http://financials.morningstar.com/balance-sheet/bs.html?
t=OGFGY®ion=usa&culture=en-US>.
Origin, 2017. [PDF]. Available through:<
https://www.originenergy.com.au/content/dam/origin/about/investors-media/annual
%20review%202017/AnnualReport_FY2017.pdf>.
Ratio analysis, 2017. [Online]. Available through:<
http://www.zenwealth.com/BusinessFinanceOnline/RA/RatioAnalysis.html>.
8 | P a g e
1 out of 11
Related Documents


Your All-in-One AI-Powered Toolkit for Academic Success.
+13062052269
info@desklib.com
Available 24*7 on WhatsApp / Email
![[object Object]](/_next/static/media/star-bottom.7253800d.svg)
Unlock your academic potential
Copyright © 2020–2026 A2Z Services. All Rights Reserved. Developed and managed by ZUCOL.