Comparative Financial Analysis: Origin Energy and Woodside Petroleum

Verified

Added on  2023/06/05

|32
|5115
|280
Report
AI Summary
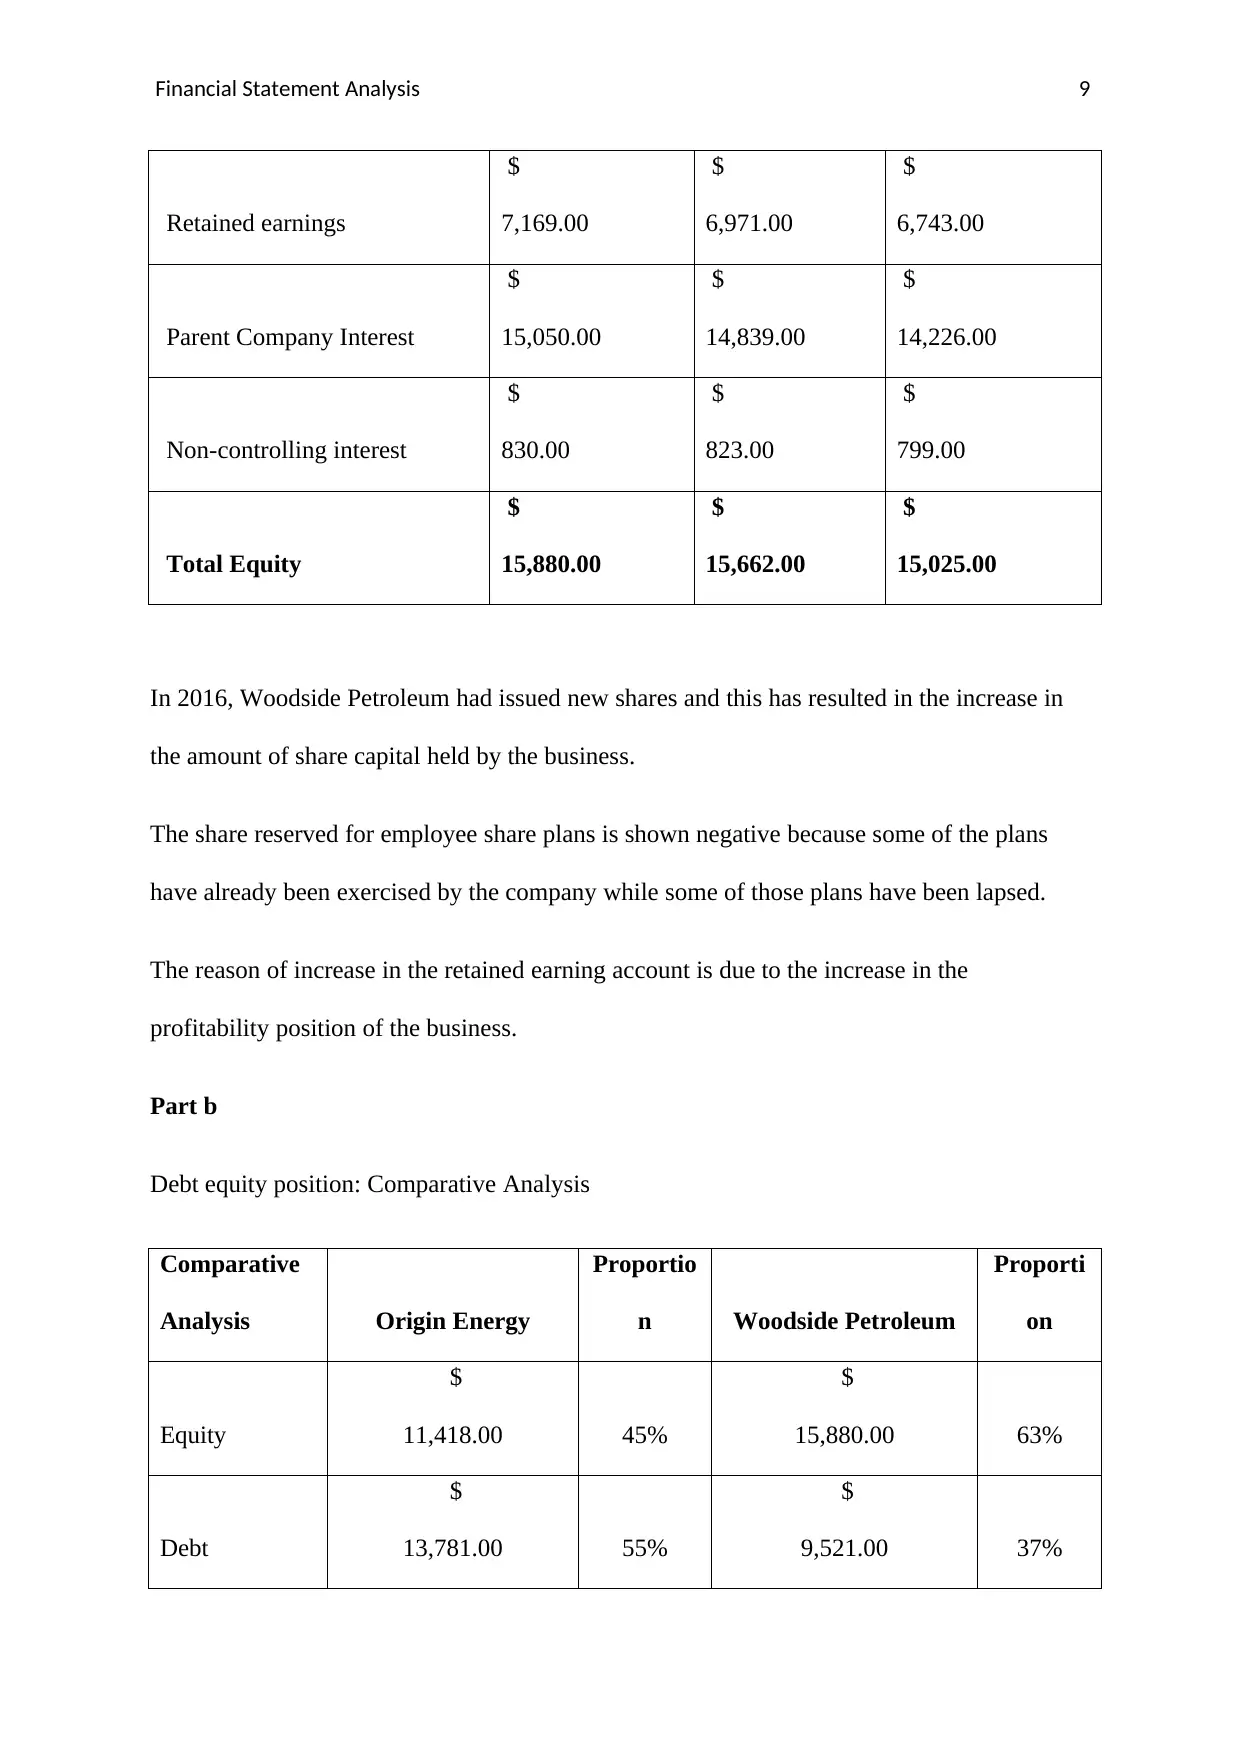
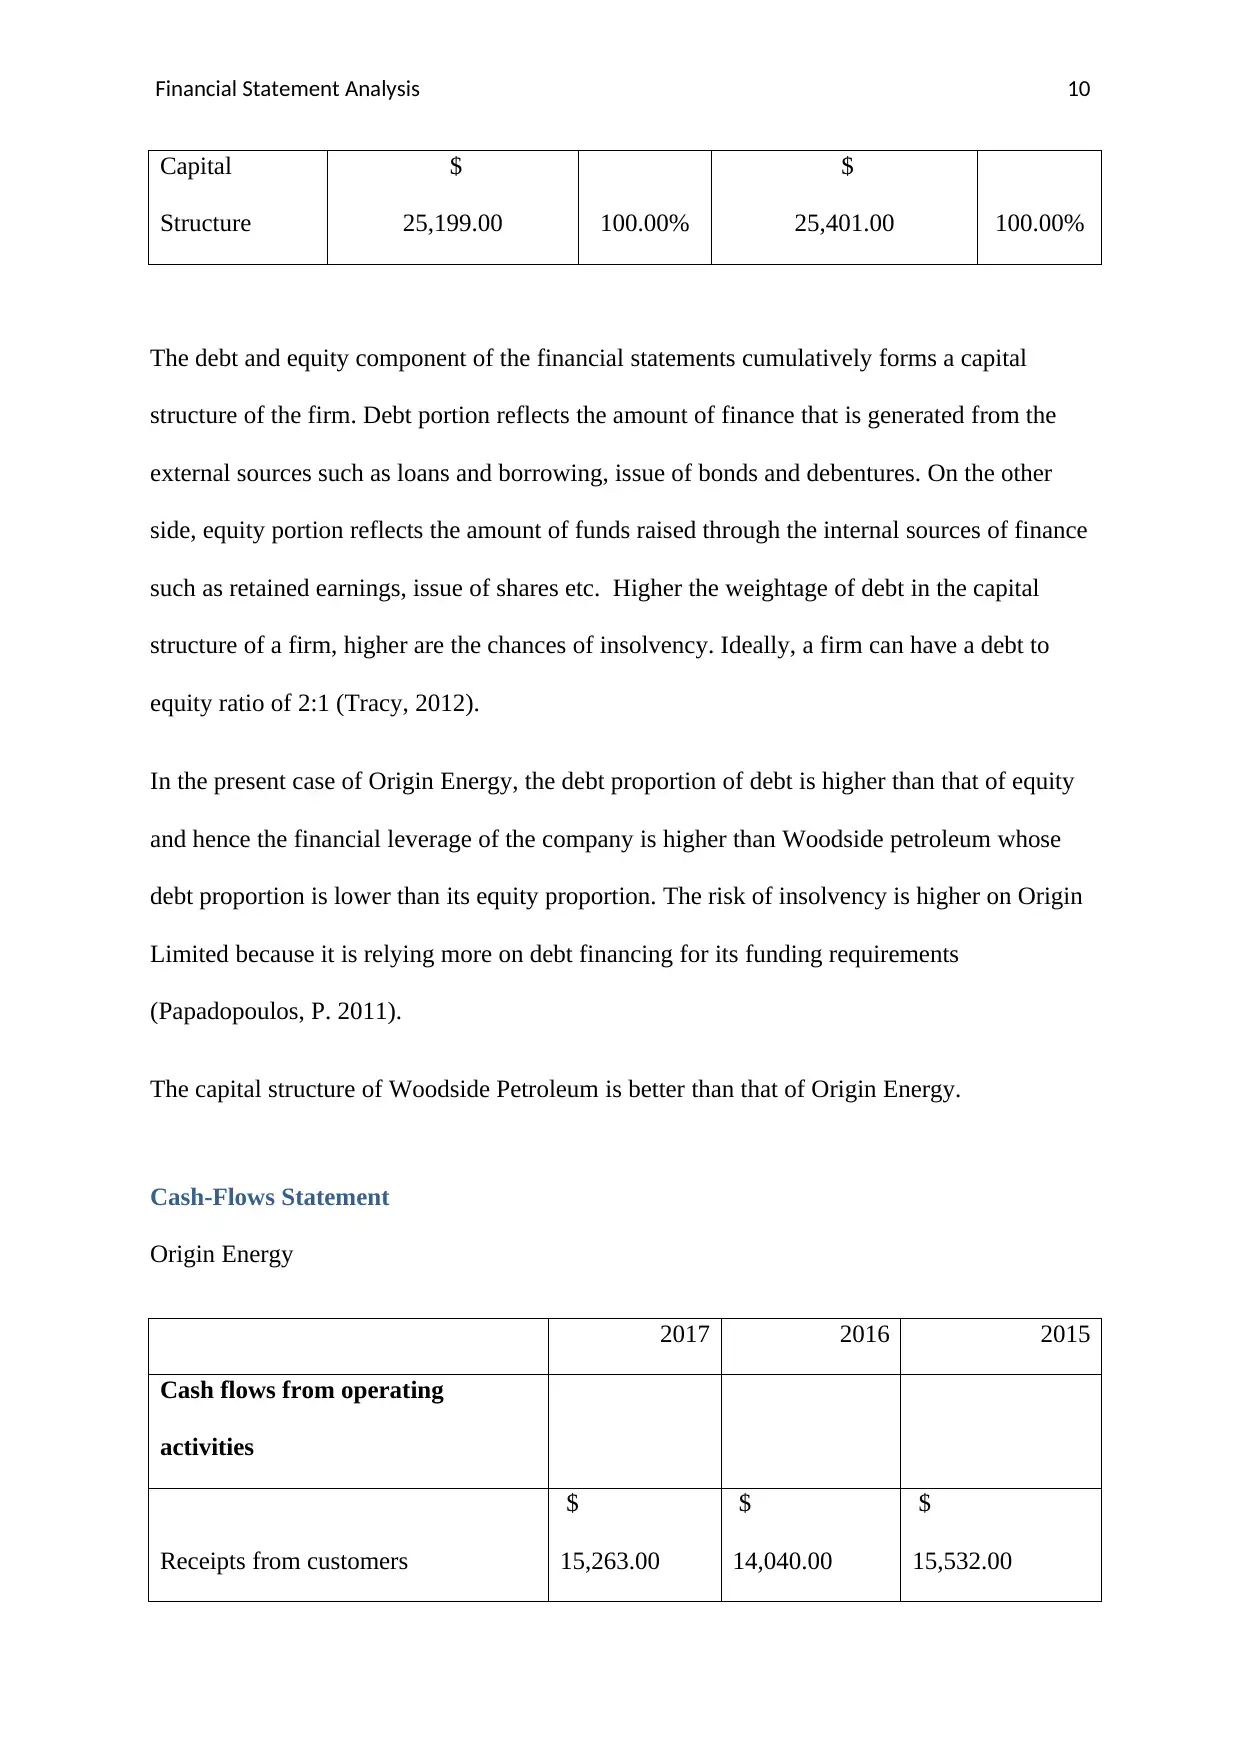
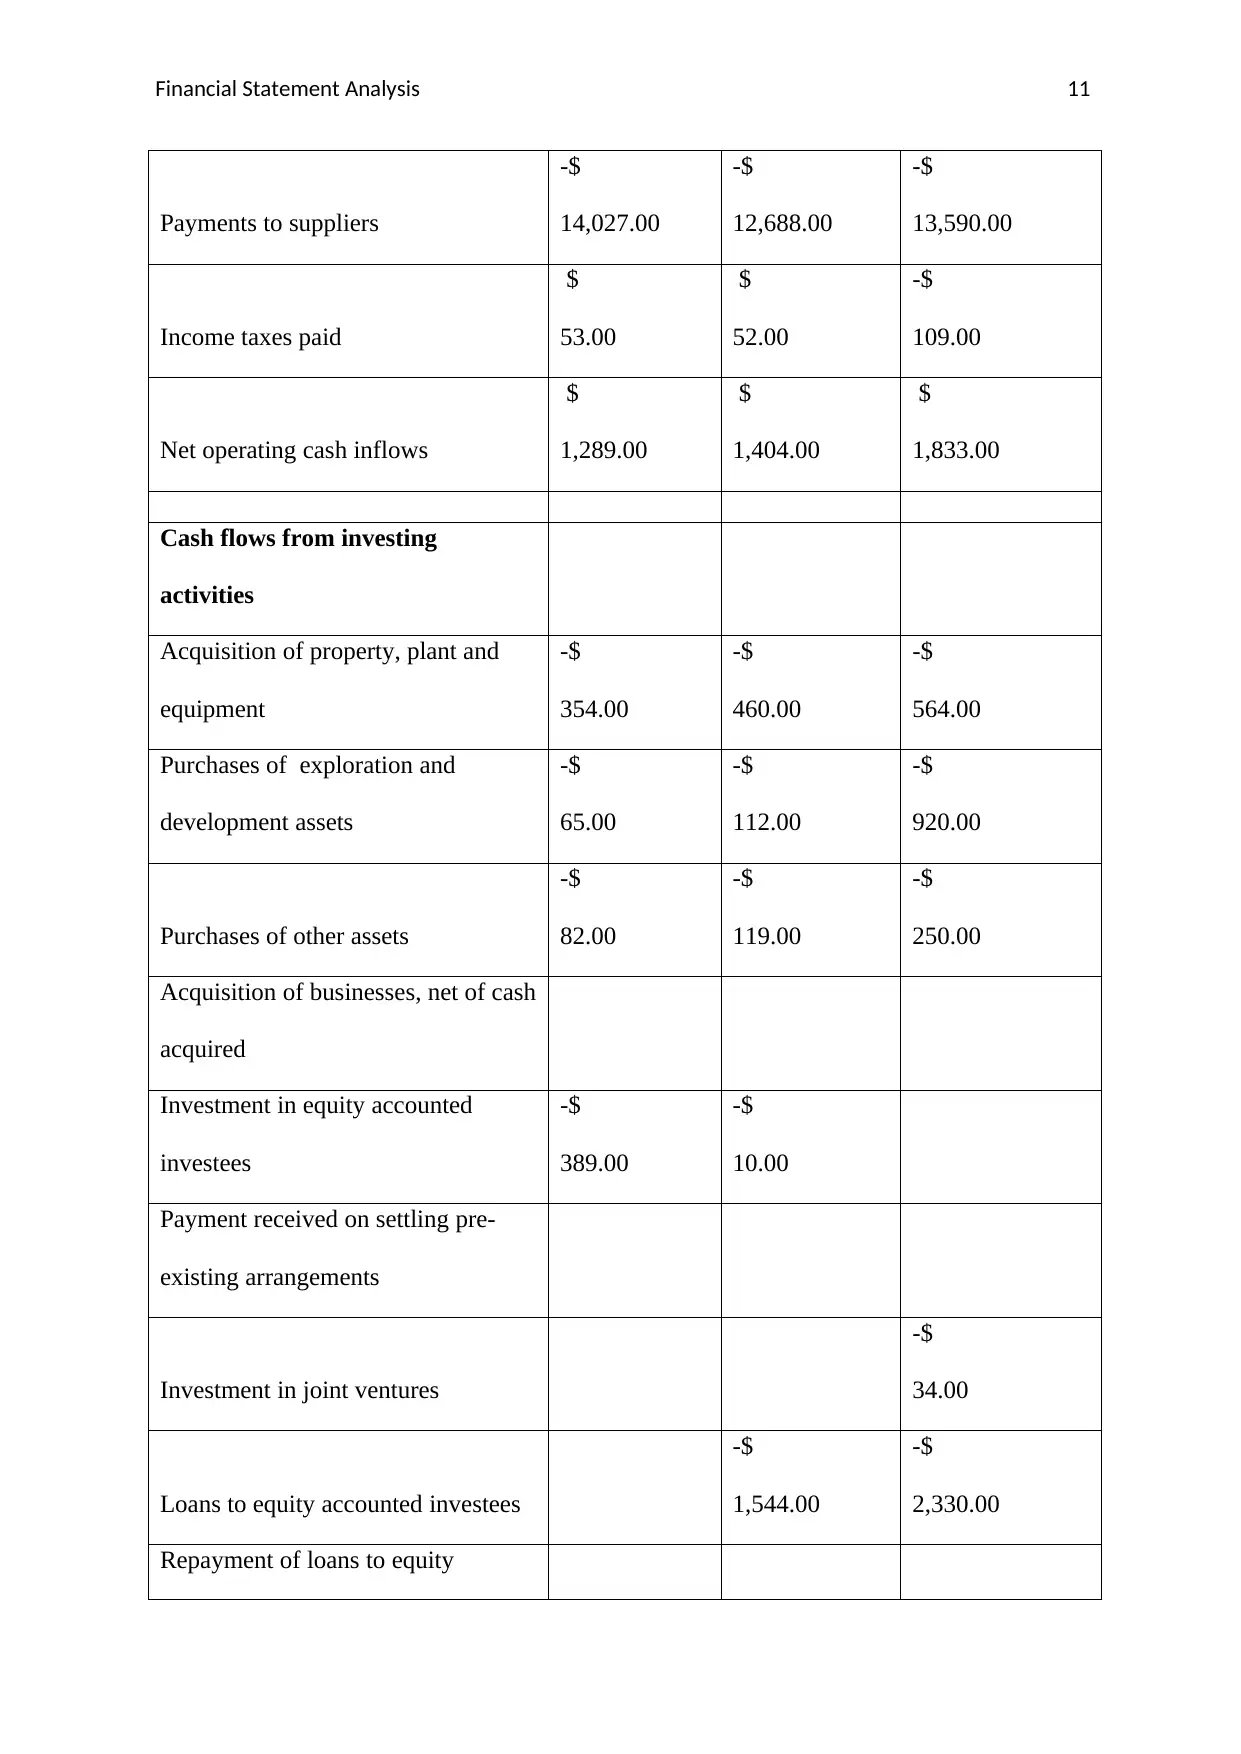
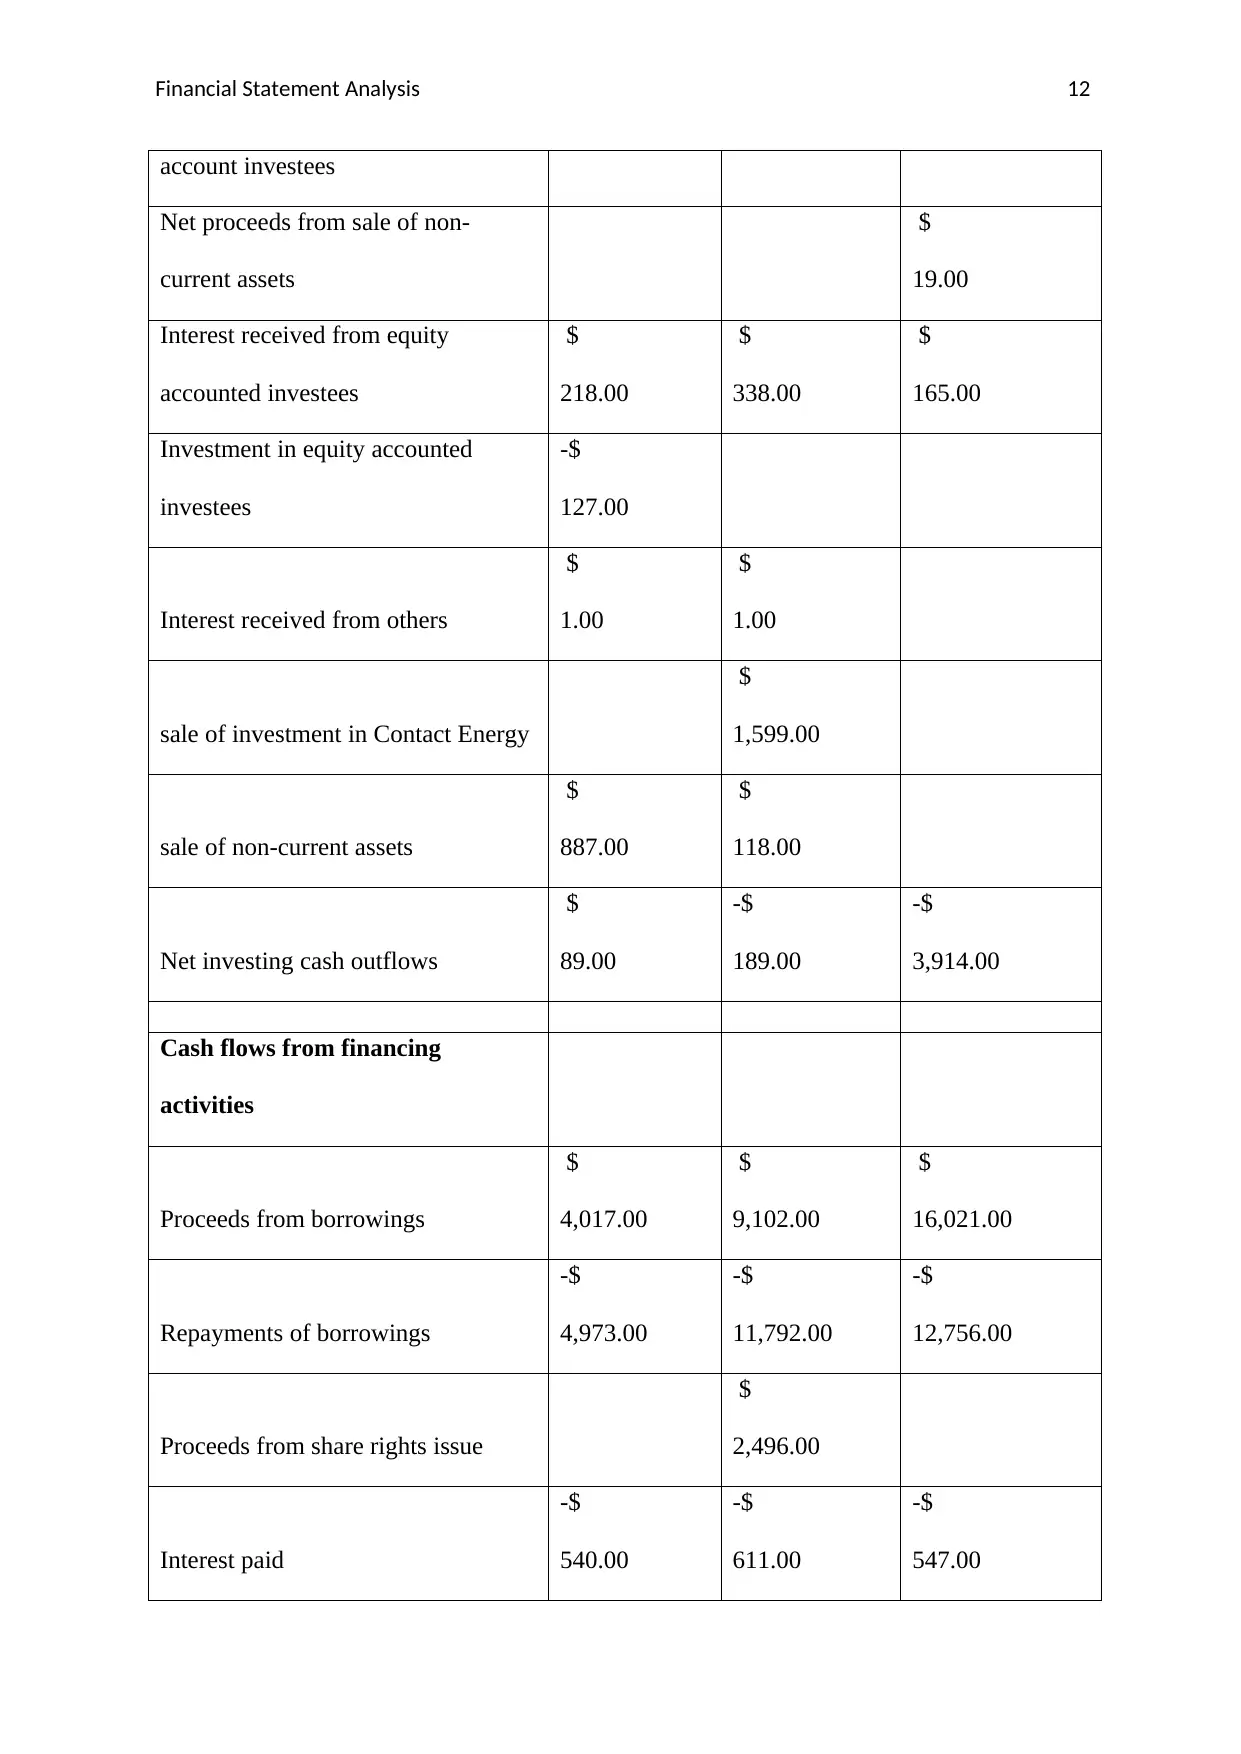
This report presents a detailed financial analysis of Origin Energy Power Limited and Woodside Petroleum Limited, two prominent companies in the Australian energy sector. The analysis utilizes financial statements from 2015 to 2017 to compare the companies' financial performance, focusing on owner's equity, cash flow statements, and debt-equity positions. The report finds that Woodside Petroleum exhibits a stronger financial position compared to Origin Energy, particularly in terms of debt management and capital structure. The analysis covers key financial metrics, including share capital, reserves, retained earnings, and cash flows from operating, investing, and financing activities, providing a comprehensive overview of the financial health of both companies. Desklib provides a platform for students to access similar solved assignments.
Document Page
Running Head: Financial Statement Analysis
Corporate Accounting
tabler-icon-diamond-filled.svg

Paraphrase This Document

Need a fresh take? Get an instant paraphrase of this document with our AI Paraphraser
Document Page
Financial Statement Analysis 2
Executive Summary:
This report deals with the analysis and evaluation of financial performance of two leading
corporations from top 100 ASX listed companies. The names of the companies are: Origin
Energy Power Limited and Woodside Petroleum Limited. For the purpose of gauging their
financial performance by way of comparative analysis, the selection of companies has been
made from a particular industry i.e. energy industry. In order to evaluate the performances of
the both the entities in financial terms, the use of annual report for the latest three financial
years i.e. 2017, 2016 and 2015 have been made. All the financial statements of both the
companies such as income statement, balance sheet and cash flow statement have been
carefully examined and it has been found that Woodside is performing better than Origin
Energy.
Document Page
Financial Statement Analysis 3
Document Page
Financial Statement Analysis 4
tabler-icon-diamond-filled.svg

Paraphrase This Document

Need a fresh take? Get an instant paraphrase of this document with our AI Paraphraser
Document Page
Financial Statement Analysis 5
Table of Contents
Executive Summary:.............................................................................................................................2
Introduction:..........................................................................................................................................6
Owner’s Equity......................................................................................................................................6
Cash-Flows Statement.........................................................................................................................10
Other comprehensive income..............................................................................................................21
Corporate tax rates...............................................................................................................................22
Conclusion:..........................................................................................................................................26
Document Page
Financial Statement Analysis 6
Introduction:
The present report is prepared in the light of financial analysis of Origin Energy Power
Limited and Woodside Petroleum Limited. The said corporations fall under the category of
top 100 ASX Listed companies and belong to the energy industry of Australia. Origin Energy
is an energy retailer of Australia and is based in Sydney. It is engaged in the business of
exploration, generation, buying and selling of energy. It has been in existence since 1990.
Origin Energy supplies energy and gas products such as solar systems, batteries, LPG
packages for domestic as well as commercial units (Bloomberg, 2018).
Woodside Petroleum is also engaged in the business of exploration, evaluation, development
of hydrocarbons. The company got incorporated in 1954 with its head office at Perth,
Australia. Woodside produces and supplies oil and gas products across the country. The main
products of the company are Liquefied Petroleum Gases, Natural gas pipelines, LPG gases
and crude oil. Along with these products, the company is also engaged in the business of
provision of processing of LNG, ship chartering and various other types of services. The
operations of the company are undertaken in various countries like Oceania, Asia, Canada
and Africa (Bloomberg, 2018)
Owner’s Equity
Part a
Origin Energy
2017 2016 2015
Share Capital
$
7,150.00
$
7,150.00
$
4,599.00
Document Page
Financial Statement Analysis 7
Reserves
$
439.00
$
857.00
$
576.00
Retained earnings
$
3,807.00
$
6,032.00
$
7,548.00
Parent Company Interest
$
11,396.00
$
14,039.00
$
12,723.00
Non-controlling interests –
Contact Energy
$
-
$
-
$
1,244.00
Non-controlling interests –
others
$
22.00
$
21.00
$
192.00
Total Equity
$
11,418.00
$
14,060.00
$
14,159.00
Share capital is the important component of firm’s equity. It reflects the quantum of funds
generated by the company through the issues of shares. The company had issued new shares
in 2016 and due to this its share capital account has been increased in 2016 as compared to
2015.
Reserves are the part of profit that is set aside for the specific purpose. These reserves are
utilised during the course of business for the purposes for which they are created. However, a
company also have a general reserve which could be prepared for the general purposes of the
business. In case of Origin Industry, the company has created foreign currency translation
reserve, hedging reserve, available for sale reserve and the share based payment reserve. The
foreign currency translation reserve has been created to account for any gains and losses on
the hedging transactions which have not yet settled. Available for sale reserves are created to
account for the changes in the fair valuation of investments. Foreign currency translation
tabler-icon-diamond-filled.svg

Paraphrase This Document

Need a fresh take? Get an instant paraphrase of this document with our AI Paraphraser
Document Page
Financial Statement Analysis 8
reserves are created to record the differences that arise on account of translation of foreign
operation transactions.
There has been loss on foreign currency translation in respect of foreign operations in 2017
due to which the cost reserves have declined. Also there was a loss on the hedging
transactions also and even the value of assets that were available for sale was reduced. All
these transactions and events have contributed to decline in the value reserves in 2017.
Retained earnings are the amounts of profits earned out of business operations and are kept
back in the business only for the use in the forthcoming years for the payment of dividend or
for the further business operations.
Due to the loss in the normal business operations in 2017, the balance of retained earning has
reduced significantly over the last 3 years (Origin Energy, 2017).
Parent company interest reflects the portion of company’s equity that is held by the holding
(parent) company. Parent company is the company which holds more than 50% or maximum
of the shares of the company.
Non-controlling interests are hold by the shareholders who belong to minority segment. They
hold less than 50% of the total shares of the company.
Woodside Petroleum 2017 2016 2015
Issued and fully paid shares
$
6,919.00
$
6,919.00
$
6,547.00
Shares reserved for employee
share plans
-$
35.00
-$
30.00
-$
27.00
Other reserves
$
997.00
$
979.00
$
963.00
Document Page
Financial Statement Analysis 9
Retained earnings
$
7,169.00
$
6,971.00
$
6,743.00
Parent Company Interest
$
15,050.00
$
14,839.00
$
14,226.00
Non-controlling interest
$
830.00
$
823.00
$
799.00
Total Equity
$
15,880.00
$
15,662.00
$
15,025.00
In 2016, Woodside Petroleum had issued new shares and this has resulted in the increase in
the amount of share capital held by the business.
The share reserved for employee share plans is shown negative because some of the plans
have already been exercised by the company while some of those plans have been lapsed.
The reason of increase in the retained earning account is due to the increase in the
profitability position of the business.
Part b
Debt equity position: Comparative Analysis
Comparative
Analysis Origin Energy
Proportio
n Woodside Petroleum
Proporti
on
Equity
$
11,418.00 45%
$
15,880.00 63%
Debt
$
13,781.00 55%
$
9,521.00 37%
Document Page
Financial Statement Analysis 10
Capital
Structure
$
25,199.00 100.00%
$
25,401.00 100.00%
The debt and equity component of the financial statements cumulatively forms a capital
structure of the firm. Debt portion reflects the amount of finance that is generated from the
external sources such as loans and borrowing, issue of bonds and debentures. On the other
side, equity portion reflects the amount of funds raised through the internal sources of finance
such as retained earnings, issue of shares etc. Higher the weightage of debt in the capital
structure of a firm, higher are the chances of insolvency. Ideally, a firm can have a debt to
equity ratio of 2:1 (Tracy, 2012).
In the present case of Origin Energy, the debt proportion of debt is higher than that of equity
and hence the financial leverage of the company is higher than Woodside petroleum whose
debt proportion is lower than its equity proportion. The risk of insolvency is higher on Origin
Limited because it is relying more on debt financing for its funding requirements
(Papadopoulos, P. 2011).
The capital structure of Woodside Petroleum is better than that of Origin Energy.
Cash-Flows Statement
Origin Energy
2017 2016 2015
Cash flows from operating
activities
Receipts from customers
$
15,263.00
$
14,040.00
$
15,532.00
tabler-icon-diamond-filled.svg

Paraphrase This Document

Need a fresh take? Get an instant paraphrase of this document with our AI Paraphraser
Document Page
Financial Statement Analysis 11
Payments to suppliers
-$
14,027.00
-$
12,688.00
-$
13,590.00
Income taxes paid
$
53.00
$
52.00
-$
109.00
Net operating cash inflows
$
1,289.00
$
1,404.00
$
1,833.00
Cash flows from investing
activities
Acquisition of property, plant and
equipment
-$
354.00
-$
460.00
-$
564.00
Purchases of exploration and
development assets
-$
65.00
-$
112.00
-$
920.00
Purchases of other assets
-$
82.00
-$
119.00
-$
250.00
Acquisition of businesses, net of cash
acquired
Investment in equity accounted
investees
-$
389.00
-$
10.00
Payment received on settling pre-
existing arrangements
Investment in joint ventures
-$
34.00
Loans to equity accounted investees
-$
1,544.00
-$
2,330.00
Repayment of loans to equity
Document Page
Financial Statement Analysis 12
account investees
Net proceeds from sale of non-
current assets
$
19.00
Interest received from equity
accounted investees
$
218.00
$
338.00
$
165.00
Investment in equity accounted
investees
-$
127.00
Interest received from others
$
1.00
$
1.00
sale of investment in Contact Energy
$
1,599.00
sale of non-current assets
$
887.00
$
118.00
Net investing cash outflows
$
89.00
-$
189.00
-$
3,914.00
Cash flows from financing
activities
Proceeds from borrowings
$
4,017.00
$
9,102.00
$
16,021.00
Repayments of borrowings
-$
4,973.00
-$
11,792.00
-$
12,756.00
Proceeds from share rights issue
$
2,496.00
Interest paid
-$
540.00
-$
611.00
-$
547.00
chevron_up_icon
1 out of 32
circle_padding
hide_on_mobile
zoom_out_icon
[object Object]