Financial Accounting Report: Oroton Group
VerifiedAdded on 2019/10/30
|12
|1898
|87
Report
AI Summary
This report provides a detailed financial analysis of the Oroton Group Limited for the fiscal year ending July 30, 2016. It begins with an overview of the company's history and principal activities, which include retailing and wholesaling leather goods, fashion apparel, and accessories. The report then examines key aspects of the annual report, including the statement of financial position, the independent auditor's report (by PricewaterhouseCoopers), and details about the directors. A significant portion of the report is dedicated to a ratio analysis, covering profitability ratios (net profit margin, return on assets, return on equity), liquidity ratios (current ratio, asset turnover), and leverage ratios (debt-to-equity ratio, interest coverage ratio). The analysis shows improvements in several key metrics compared to the previous year (2015), indicating a positive trend in the company's financial performance. The report concludes that Oroton Group's overall financial position is sound and satisfactory, with better performance than in 2015.

RUNNING HEAD: FINANCIAL ACCOUNTING
FINANCIAL ACCOUNTING
FINANCIAL ACCOUNTING
Paraphrase This Document
Need a fresh take? Get an instant paraphrase of this document with our AI Paraphraser
FINANCIAL ACCOUNTING 1
Contents
OROTON..............................................................................................................................................2
1.........................................................................................................................................................2
2.........................................................................................................................................................3
3.........................................................................................................................................................3
4.........................................................................................................................................................5
5.........................................................................................................................................................6
6.........................................................................................................................................................7
7.........................................................................................................................................................7
8.........................................................................................................................................................7
Conclusion.......................................................................................................................................11
References.......................................................................................................................................12
FINANCIAL ACCOUNTING 2
OROTON
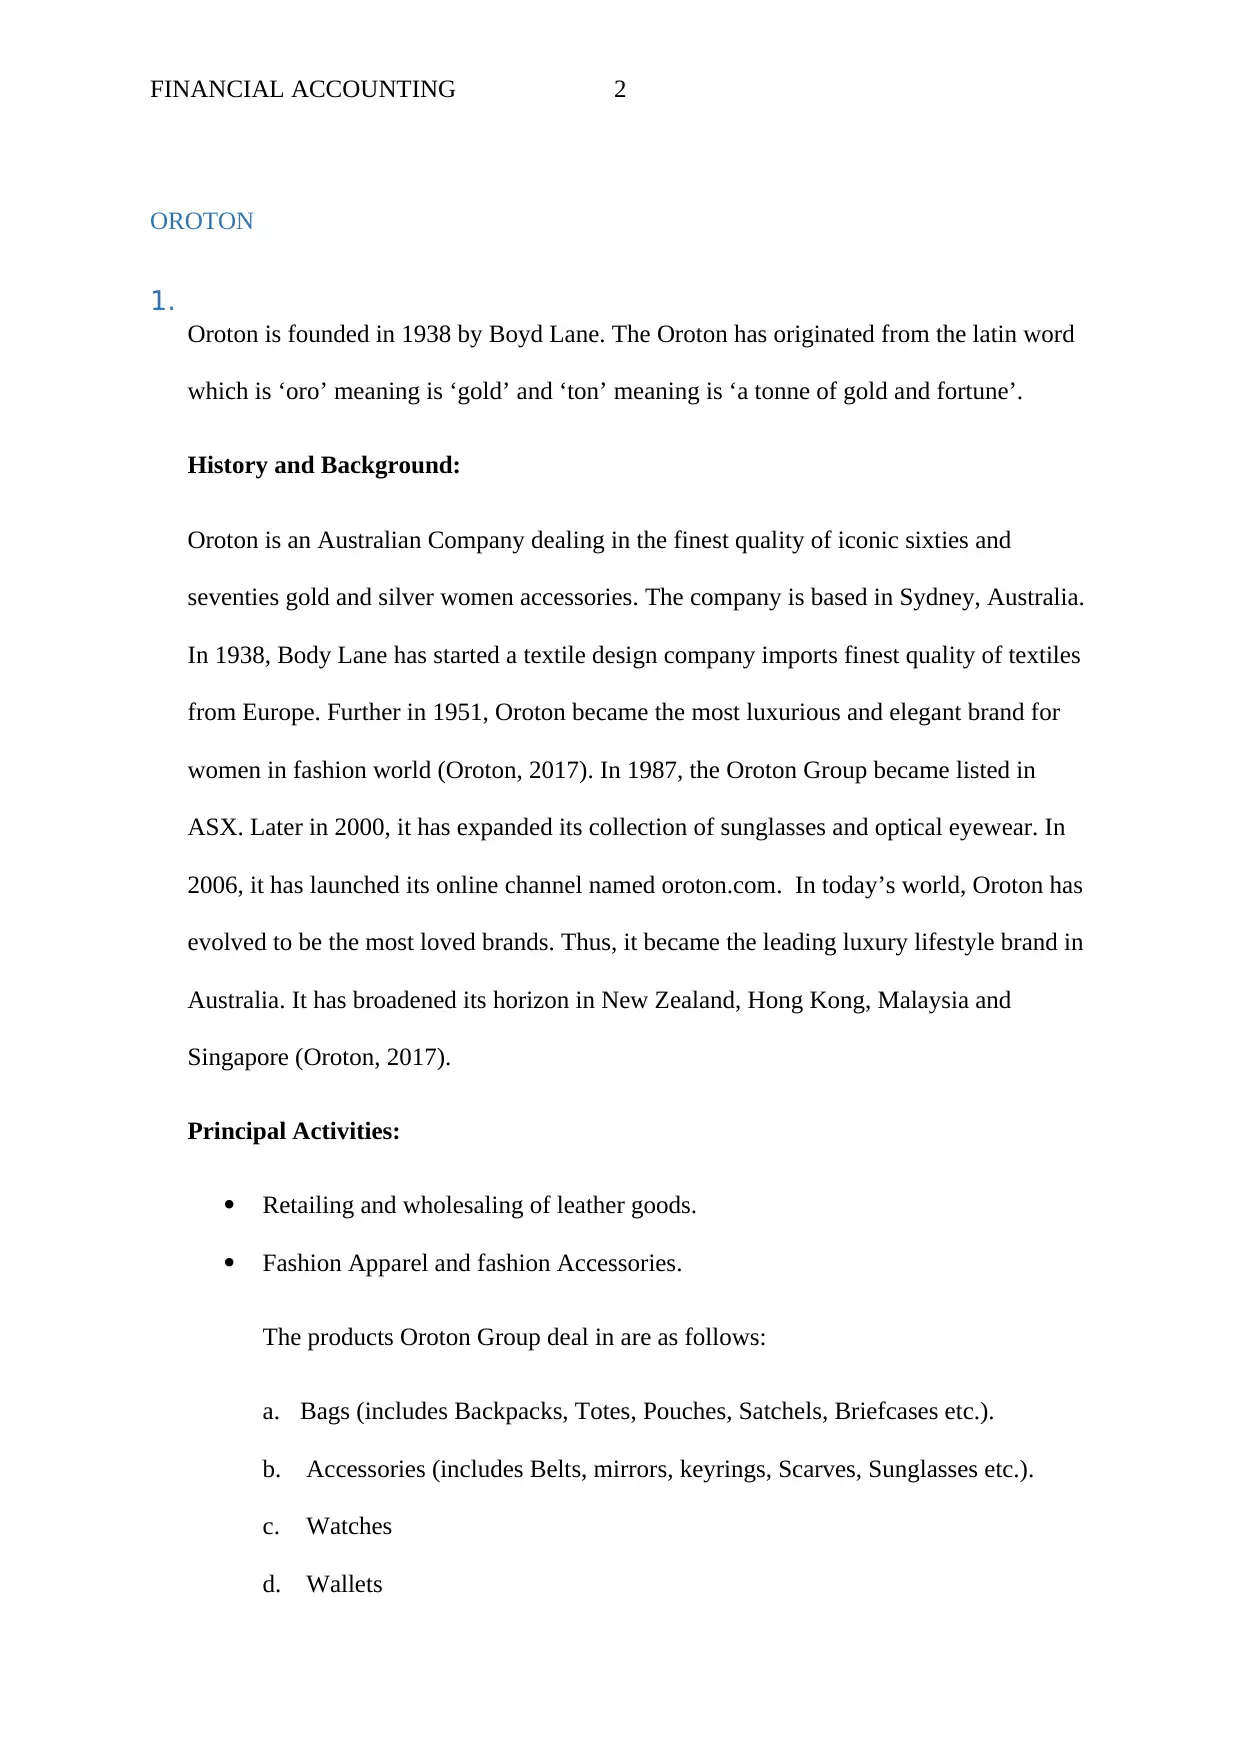
1.
Oroton is founded in 1938 by Boyd Lane. The Oroton has originated from the latin word
which is ‘oro’ meaning is ‘gold’ and ‘ton’ meaning is ‘a tonne of gold and fortune’.
History and Background:
Oroton is an Australian Company dealing in the finest quality of iconic sixties and
seventies gold and silver women accessories. The company is based in Sydney, Australia.
In 1938, Body Lane has started a textile design company imports finest quality of textiles
from Europe. Further in 1951, Oroton became the most luxurious and elegant brand for
women in fashion world (Oroton, 2017). In 1987, the Oroton Group became listed in
ASX. Later in 2000, it has expanded its collection of sunglasses and optical eyewear. In
2006, it has launched its online channel named oroton.com. In today’s world, Oroton has
evolved to be the most loved brands. Thus, it became the leading luxury lifestyle brand in
Australia. It has broadened its horizon in New Zealand, Hong Kong, Malaysia and
Singapore (Oroton, 2017).
Principal Activities:
Retailing and wholesaling of leather goods.
Fashion Apparel and fashion Accessories.
The products Oroton Group deal in are as follows:
a. Bags (includes Backpacks, Totes, Pouches, Satchels, Briefcases etc.).
b. Accessories (includes Belts, mirrors, keyrings, Scarves, Sunglasses etc.).
c. Watches
d. Wallets
OROTON
1.
Oroton is founded in 1938 by Boyd Lane. The Oroton has originated from the latin word
which is ‘oro’ meaning is ‘gold’ and ‘ton’ meaning is ‘a tonne of gold and fortune’.
History and Background:
Oroton is an Australian Company dealing in the finest quality of iconic sixties and
seventies gold and silver women accessories. The company is based in Sydney, Australia.
In 1938, Body Lane has started a textile design company imports finest quality of textiles
from Europe. Further in 1951, Oroton became the most luxurious and elegant brand for
women in fashion world (Oroton, 2017). In 1987, the Oroton Group became listed in
ASX. Later in 2000, it has expanded its collection of sunglasses and optical eyewear. In
2006, it has launched its online channel named oroton.com. In today’s world, Oroton has
evolved to be the most loved brands. Thus, it became the leading luxury lifestyle brand in
Australia. It has broadened its horizon in New Zealand, Hong Kong, Malaysia and
Singapore (Oroton, 2017).
Principal Activities:
Retailing and wholesaling of leather goods.
Fashion Apparel and fashion Accessories.
The products Oroton Group deal in are as follows:
a. Bags (includes Backpacks, Totes, Pouches, Satchels, Briefcases etc.).
b. Accessories (includes Belts, mirrors, keyrings, Scarves, Sunglasses etc.).
c. Watches
d. Wallets
⊘ This is a preview!⊘
Do you want full access?
Subscribe today to unlock all pages.
Trusted by 1+ million students worldwide
FINANCIAL ACCOUNTING 3
e. Fragrances
f. Jewellery
Retailing of fashion label under GAP Label
Licensing of Oroton Brand Name (Annual report, 2016).
The fiscal year under review is 30 July 2016.
2.
Looking at the contents page, section of ‘Statement of financial position’ and
‘Independent auditors report’ dominates the report (Annual report, 2016).
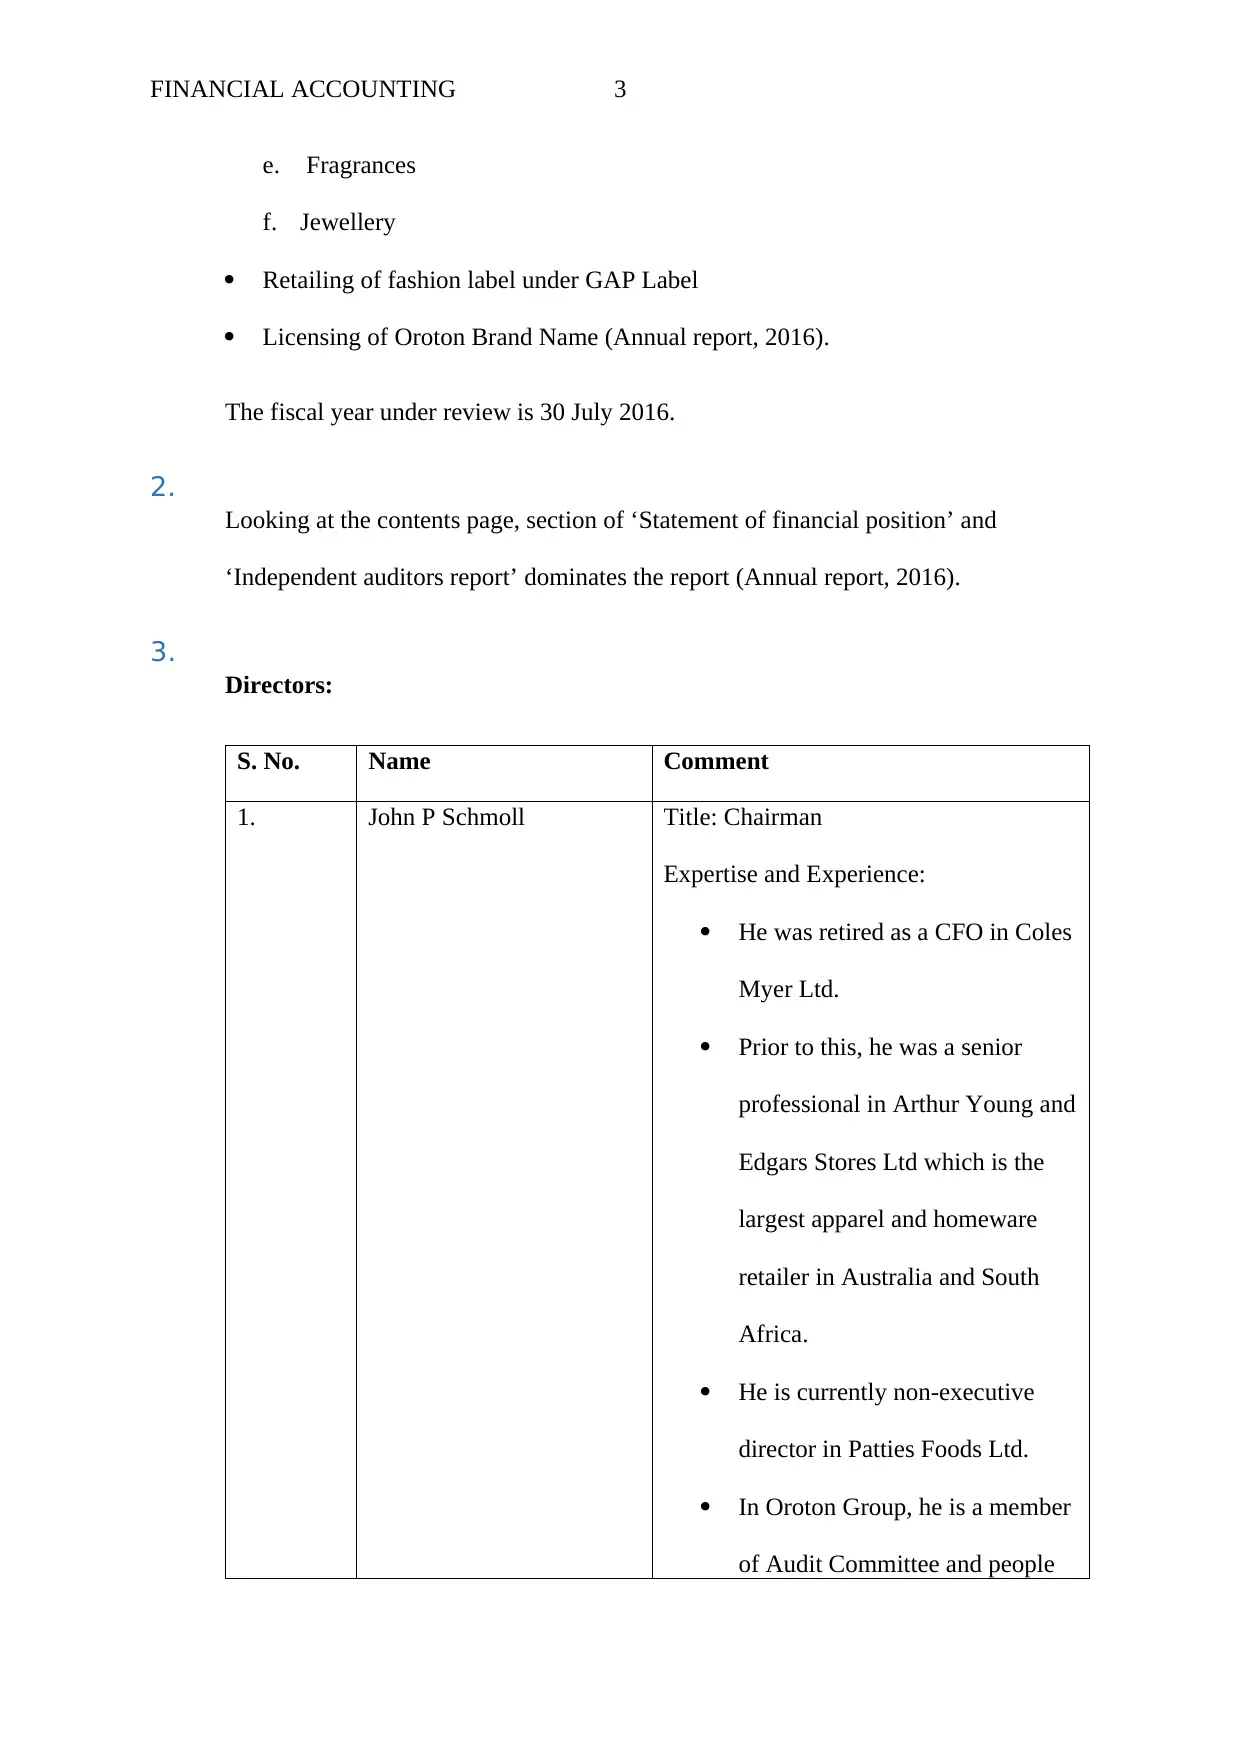
3.
Directors:
S. No. Name Comment
1. John P Schmoll Title: Chairman
Expertise and Experience:
He was retired as a CFO in Coles
Myer Ltd.
Prior to this, he was a senior
professional in Arthur Young and
Edgars Stores Ltd which is the
largest apparel and homeware
retailer in Australia and South
Africa.
He is currently non-executive
director in Patties Foods Ltd.
In Oroton Group, he is a member
of Audit Committee and people
e. Fragrances
f. Jewellery
Retailing of fashion label under GAP Label
Licensing of Oroton Brand Name (Annual report, 2016).
The fiscal year under review is 30 July 2016.
2.
Looking at the contents page, section of ‘Statement of financial position’ and
‘Independent auditors report’ dominates the report (Annual report, 2016).
3.
Directors:
S. No. Name Comment
1. John P Schmoll Title: Chairman
Expertise and Experience:
He was retired as a CFO in Coles
Myer Ltd.
Prior to this, he was a senior
professional in Arthur Young and
Edgars Stores Ltd which is the
largest apparel and homeware
retailer in Australia and South
Africa.
He is currently non-executive
director in Patties Foods Ltd.
In Oroton Group, he is a member
of Audit Committee and people
Paraphrase This Document
Need a fresh take? Get an instant paraphrase of this document with our AI Paraphraser
FINANCIAL ACCOUNTING 4
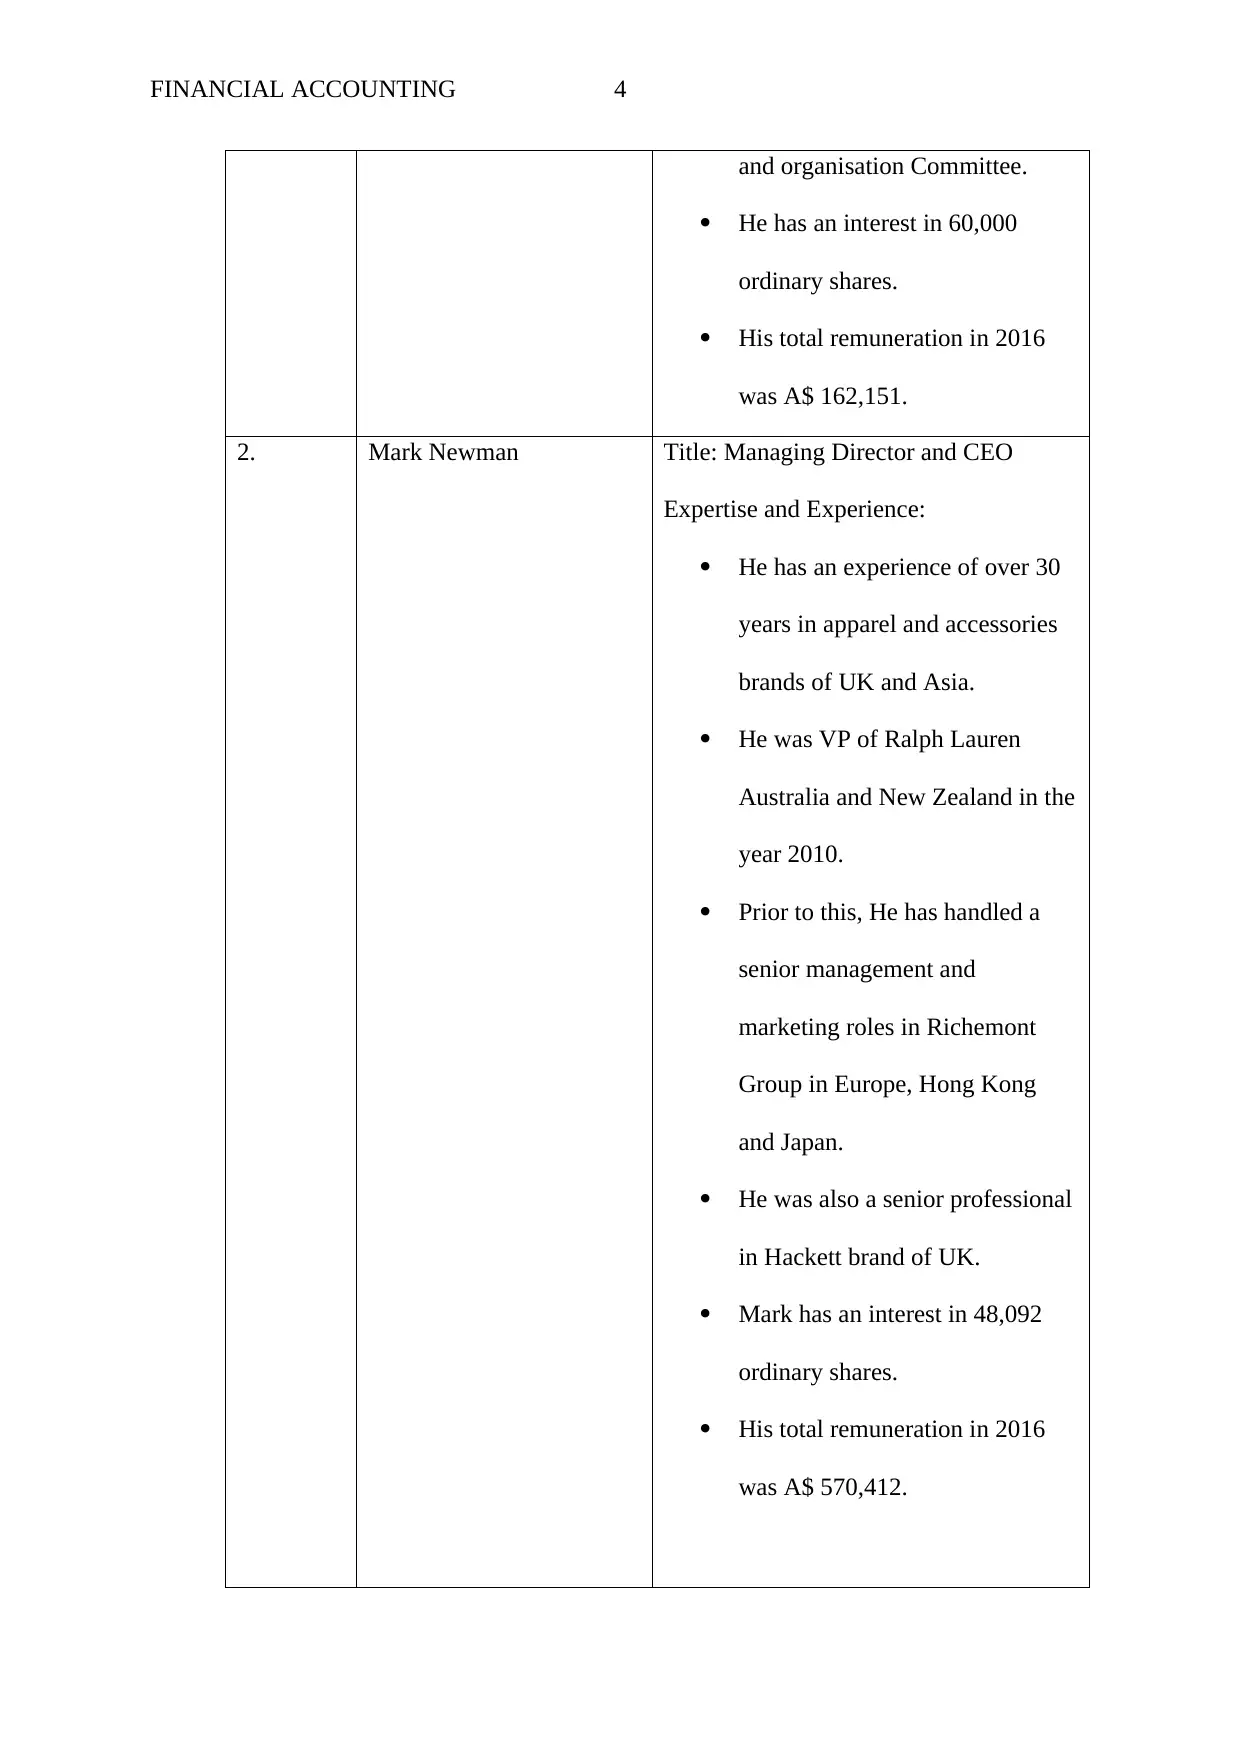
and organisation Committee.
He has an interest in 60,000
ordinary shares.
His total remuneration in 2016
was A$ 162,151.
2. Mark Newman Title: Managing Director and CEO
Expertise and Experience:
He has an experience of over 30
years in apparel and accessories
brands of UK and Asia.
He was VP of Ralph Lauren
Australia and New Zealand in the
year 2010.
Prior to this, He has handled a
senior management and
marketing roles in Richemont
Group in Europe, Hong Kong
and Japan.
He was also a senior professional
in Hackett brand of UK.
Mark has an interest in 48,092
ordinary shares.
His total remuneration in 2016
was A$ 570,412.
FINANCIAL ACCOUNTING 5
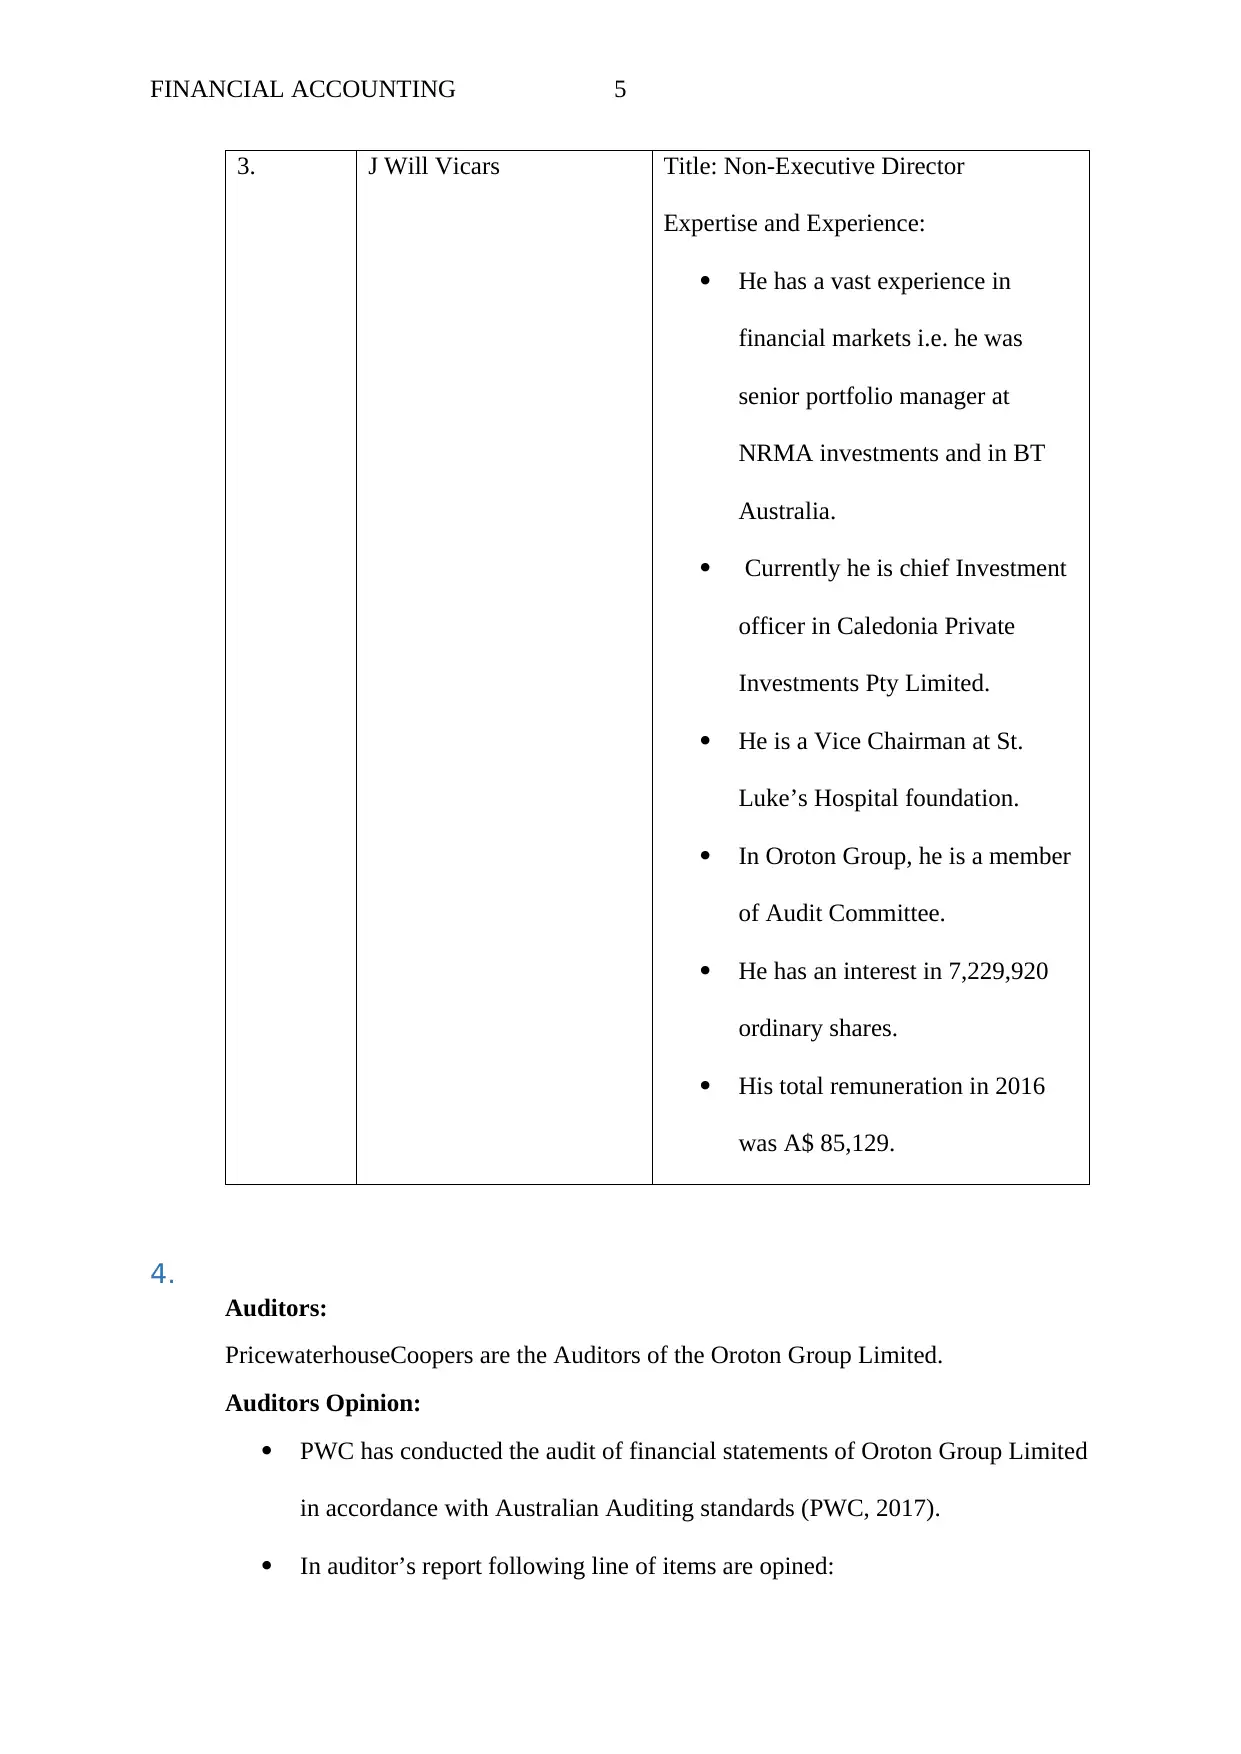
3. J Will Vicars Title: Non-Executive Director
Expertise and Experience:
He has a vast experience in
financial markets i.e. he was
senior portfolio manager at
NRMA investments and in BT
Australia.
Currently he is chief Investment
officer in Caledonia Private
Investments Pty Limited.
He is a Vice Chairman at St.
Luke’s Hospital foundation.
In Oroton Group, he is a member
of Audit Committee.
He has an interest in 7,229,920
ordinary shares.
His total remuneration in 2016
was A$ 85,129.
4.
Auditors:
PricewaterhouseCoopers are the Auditors of the Oroton Group Limited.
Auditors Opinion:
PWC has conducted the audit of financial statements of Oroton Group Limited
in accordance with Australian Auditing standards (PWC, 2017).
In auditor’s report following line of items are opined:
⊘ This is a preview!⊘
Do you want full access?
Subscribe today to unlock all pages.
Trusted by 1+ million students worldwide
FINANCIAL ACCOUNTING 6
o Report on the financial report:
PWC has declared that the Oroton Group Limited has not made any
contravention in preparing financial statements of the year ended 30
July 2016. They have prepared the financial report in accordance with
Australian Accounting Standards (AASB 101) which is in comply with
IFRS as well as Corporation Act 2001.
o Report on the remuneration report:
In remuneration report, the auditors declare that section 300A of the
Corporation Act 2001 are fully complied with (PWC, 2017).
Further there were no contraventions in auditor independence requirements in
Corporation Act 2001 as well as no contraventions of any code of professional
conduct in relation to conducting audit.
The financial statements were signed by Kristin Stubbins (Partner).
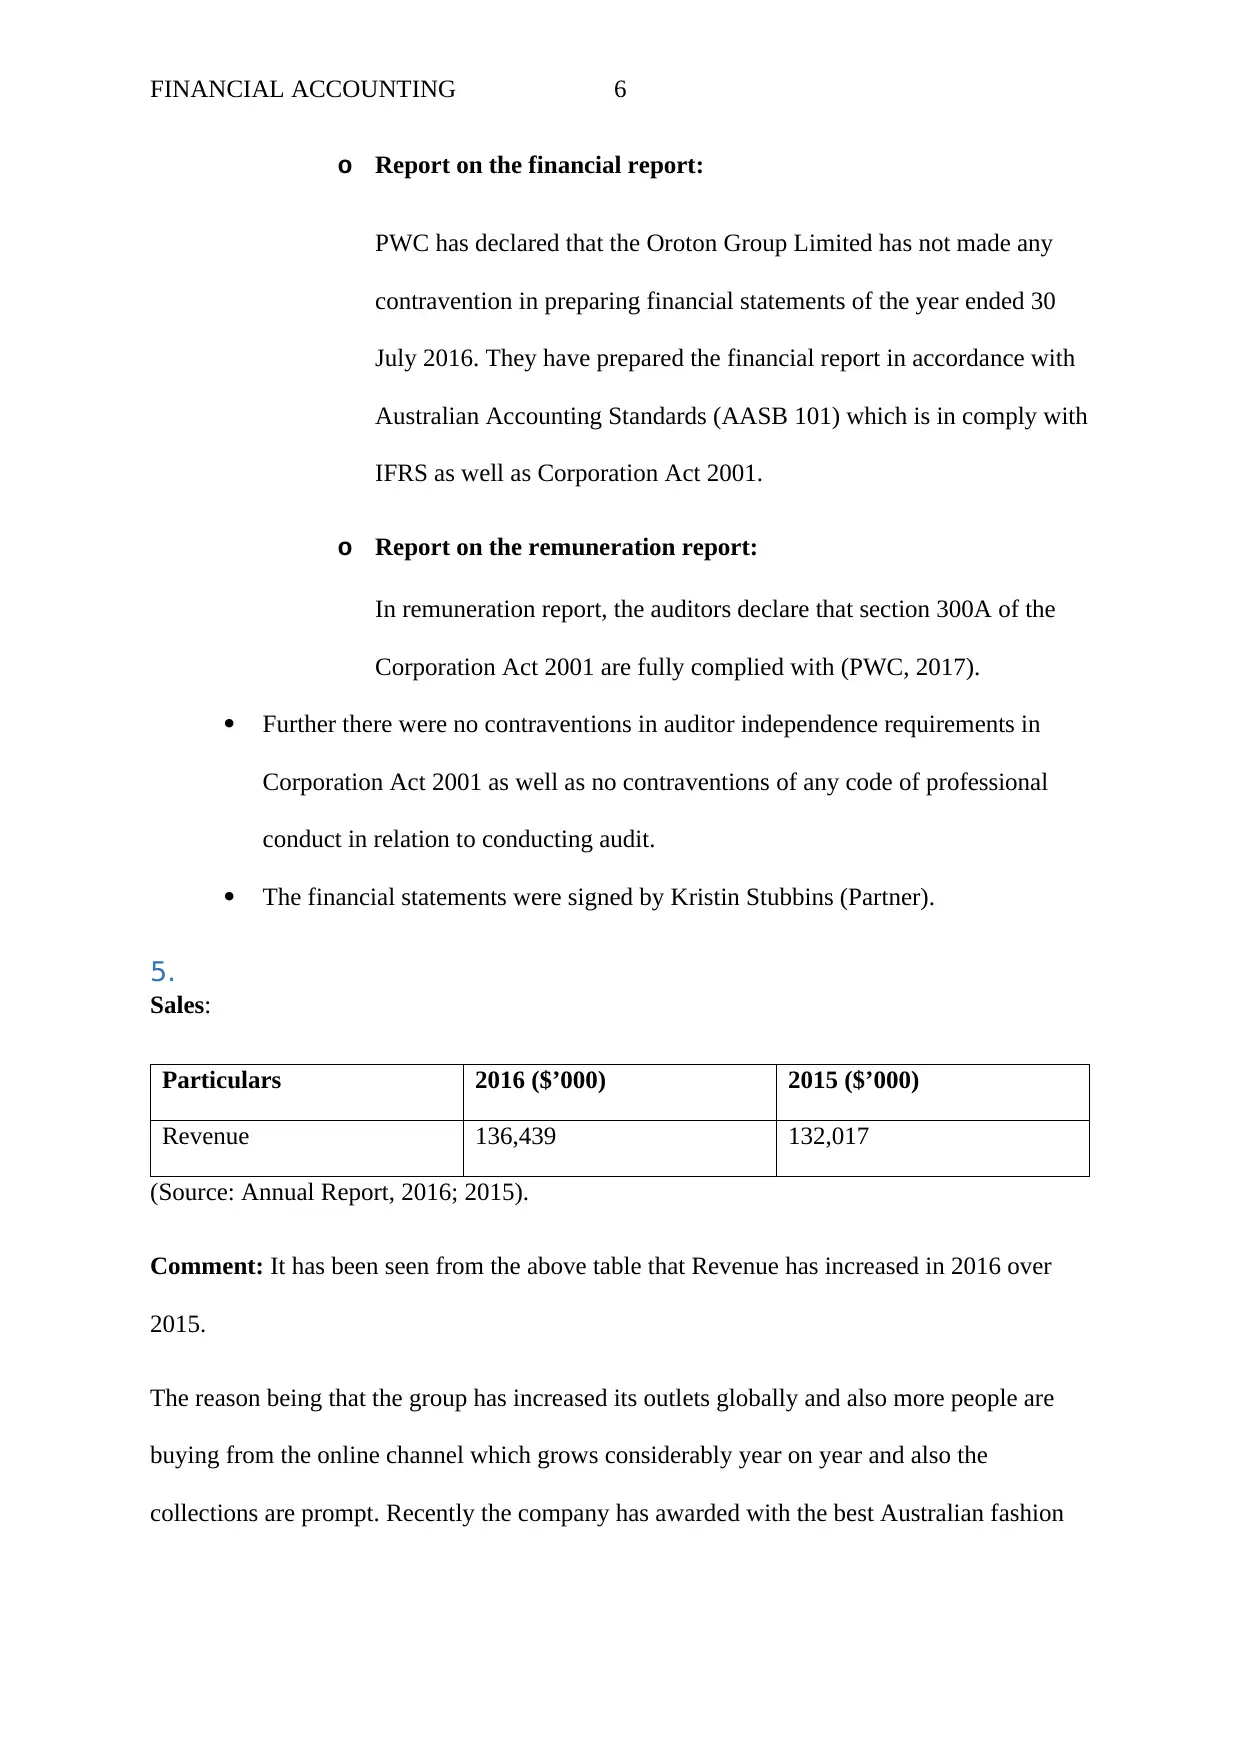
5.
Sales:
Particulars 2016 ($’000) 2015 ($’000)
Revenue 136,439 132,017
(Source: Annual Report, 2016; 2015).
Comment: It has been seen from the above table that Revenue has increased in 2016 over
2015.
The reason being that the group has increased its outlets globally and also more people are
buying from the online channel which grows considerably year on year and also the
collections are prompt. Recently the company has awarded with the best Australian fashion
o Report on the financial report:
PWC has declared that the Oroton Group Limited has not made any
contravention in preparing financial statements of the year ended 30
July 2016. They have prepared the financial report in accordance with
Australian Accounting Standards (AASB 101) which is in comply with
IFRS as well as Corporation Act 2001.
o Report on the remuneration report:
In remuneration report, the auditors declare that section 300A of the
Corporation Act 2001 are fully complied with (PWC, 2017).
Further there were no contraventions in auditor independence requirements in
Corporation Act 2001 as well as no contraventions of any code of professional
conduct in relation to conducting audit.
The financial statements were signed by Kristin Stubbins (Partner).
5.
Sales:
Particulars 2016 ($’000) 2015 ($’000)
Revenue 136,439 132,017
(Source: Annual Report, 2016; 2015).
Comment: It has been seen from the above table that Revenue has increased in 2016 over
2015.
The reason being that the group has increased its outlets globally and also more people are
buying from the online channel which grows considerably year on year and also the
collections are prompt. Recently the company has awarded with the best Australian fashion
Paraphrase This Document
Need a fresh take? Get an instant paraphrase of this document with our AI Paraphraser
FINANCIAL ACCOUNTING 7
brand. Moreover, in 2015 the group has come up with the 2 new designs which signifies that
the sales must have increased due to these factors.
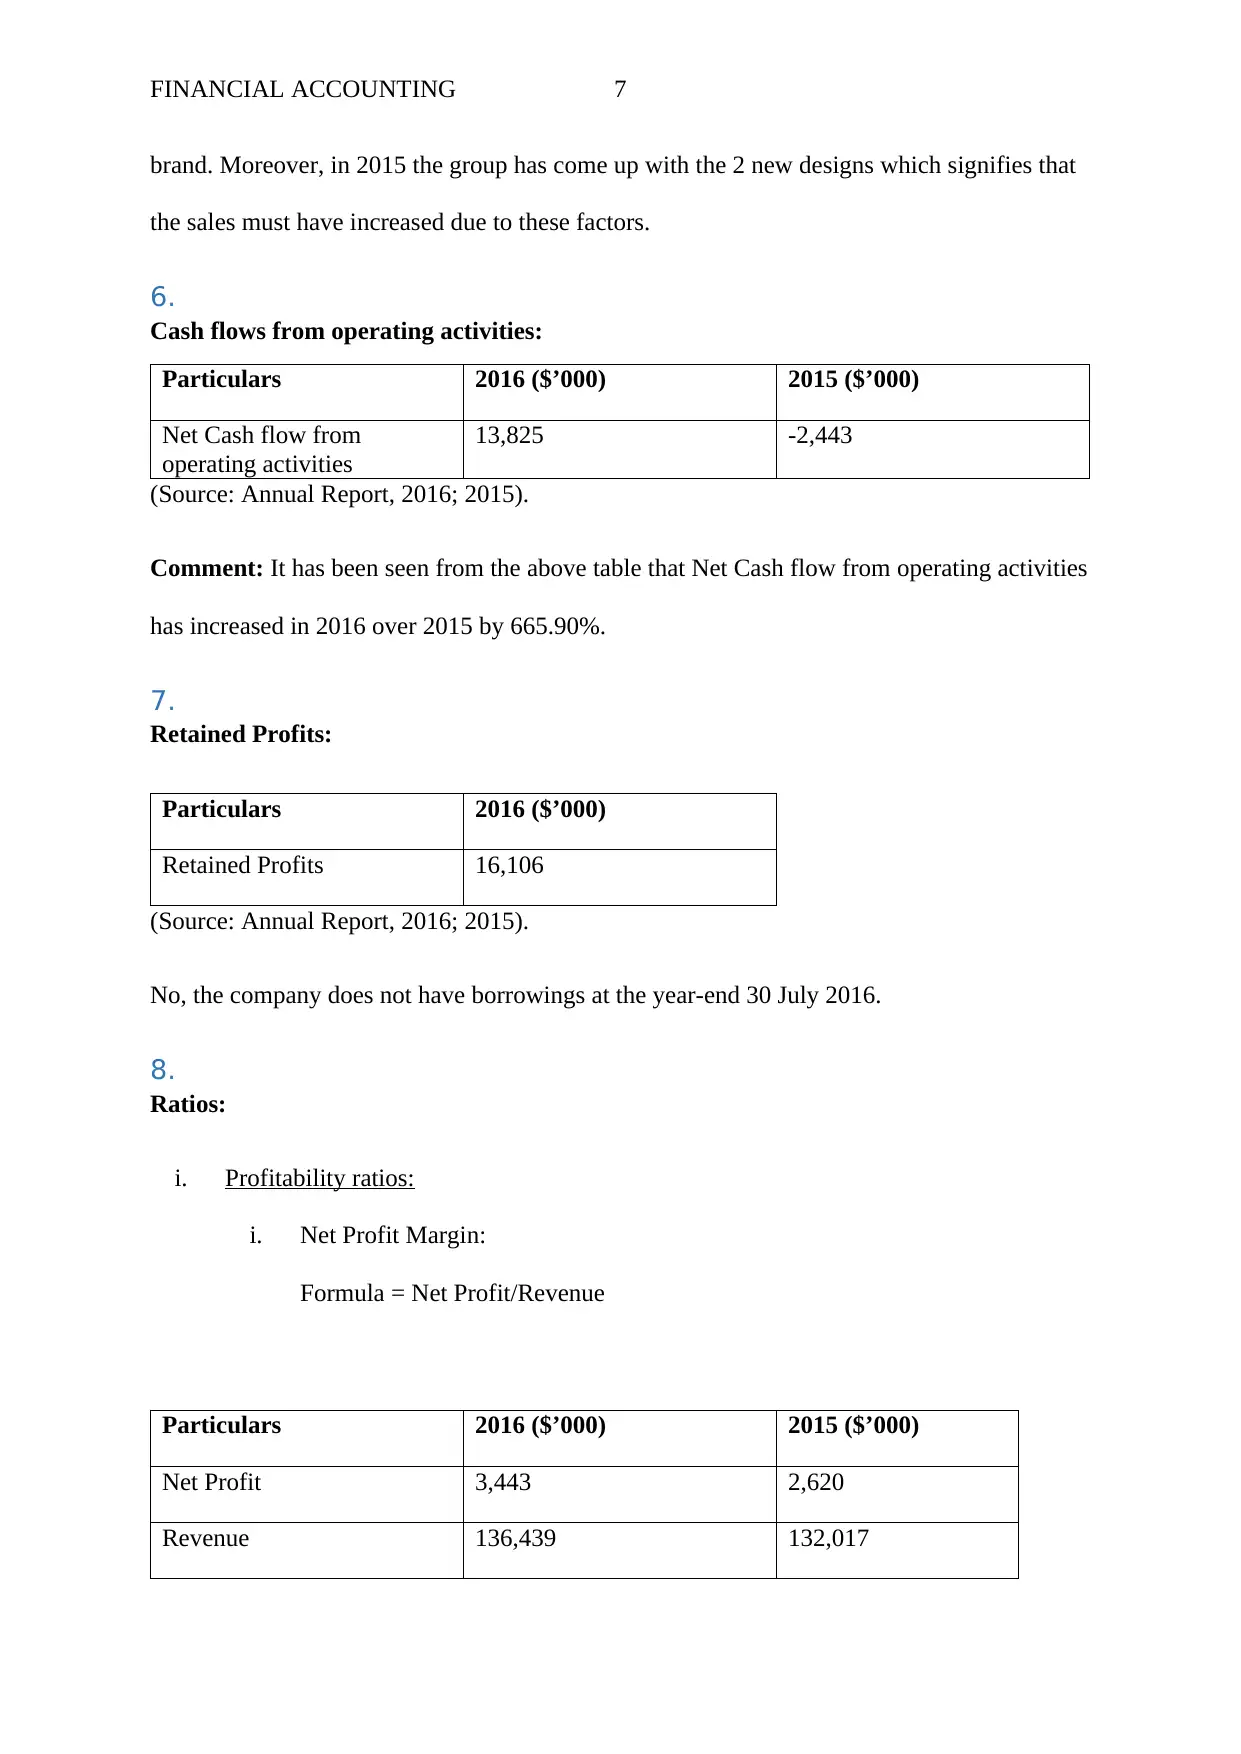
6.
Cash flows from operating activities:
Particulars 2016 ($’000) 2015 ($’000)
Net Cash flow from
operating activities
13,825 -2,443
(Source: Annual Report, 2016; 2015).
Comment: It has been seen from the above table that Net Cash flow from operating activities
has increased in 2016 over 2015 by 665.90%.
7.
Retained Profits:
Particulars 2016 ($’000)
Retained Profits 16,106
(Source: Annual Report, 2016; 2015).
No, the company does not have borrowings at the year-end 30 July 2016.
8.
Ratios:
i. Profitability ratios:
i. Net Profit Margin:
Formula = Net Profit/Revenue
Particulars 2016 ($’000) 2015 ($’000)
Net Profit 3,443 2,620
Revenue 136,439 132,017
brand. Moreover, in 2015 the group has come up with the 2 new designs which signifies that
the sales must have increased due to these factors.
6.
Cash flows from operating activities:
Particulars 2016 ($’000) 2015 ($’000)
Net Cash flow from
operating activities
13,825 -2,443
(Source: Annual Report, 2016; 2015).
Comment: It has been seen from the above table that Net Cash flow from operating activities
has increased in 2016 over 2015 by 665.90%.
7.
Retained Profits:
Particulars 2016 ($’000)
Retained Profits 16,106
(Source: Annual Report, 2016; 2015).
No, the company does not have borrowings at the year-end 30 July 2016.
8.
Ratios:
i. Profitability ratios:
i. Net Profit Margin:
Formula = Net Profit/Revenue
Particulars 2016 ($’000) 2015 ($’000)
Net Profit 3,443 2,620
Revenue 136,439 132,017
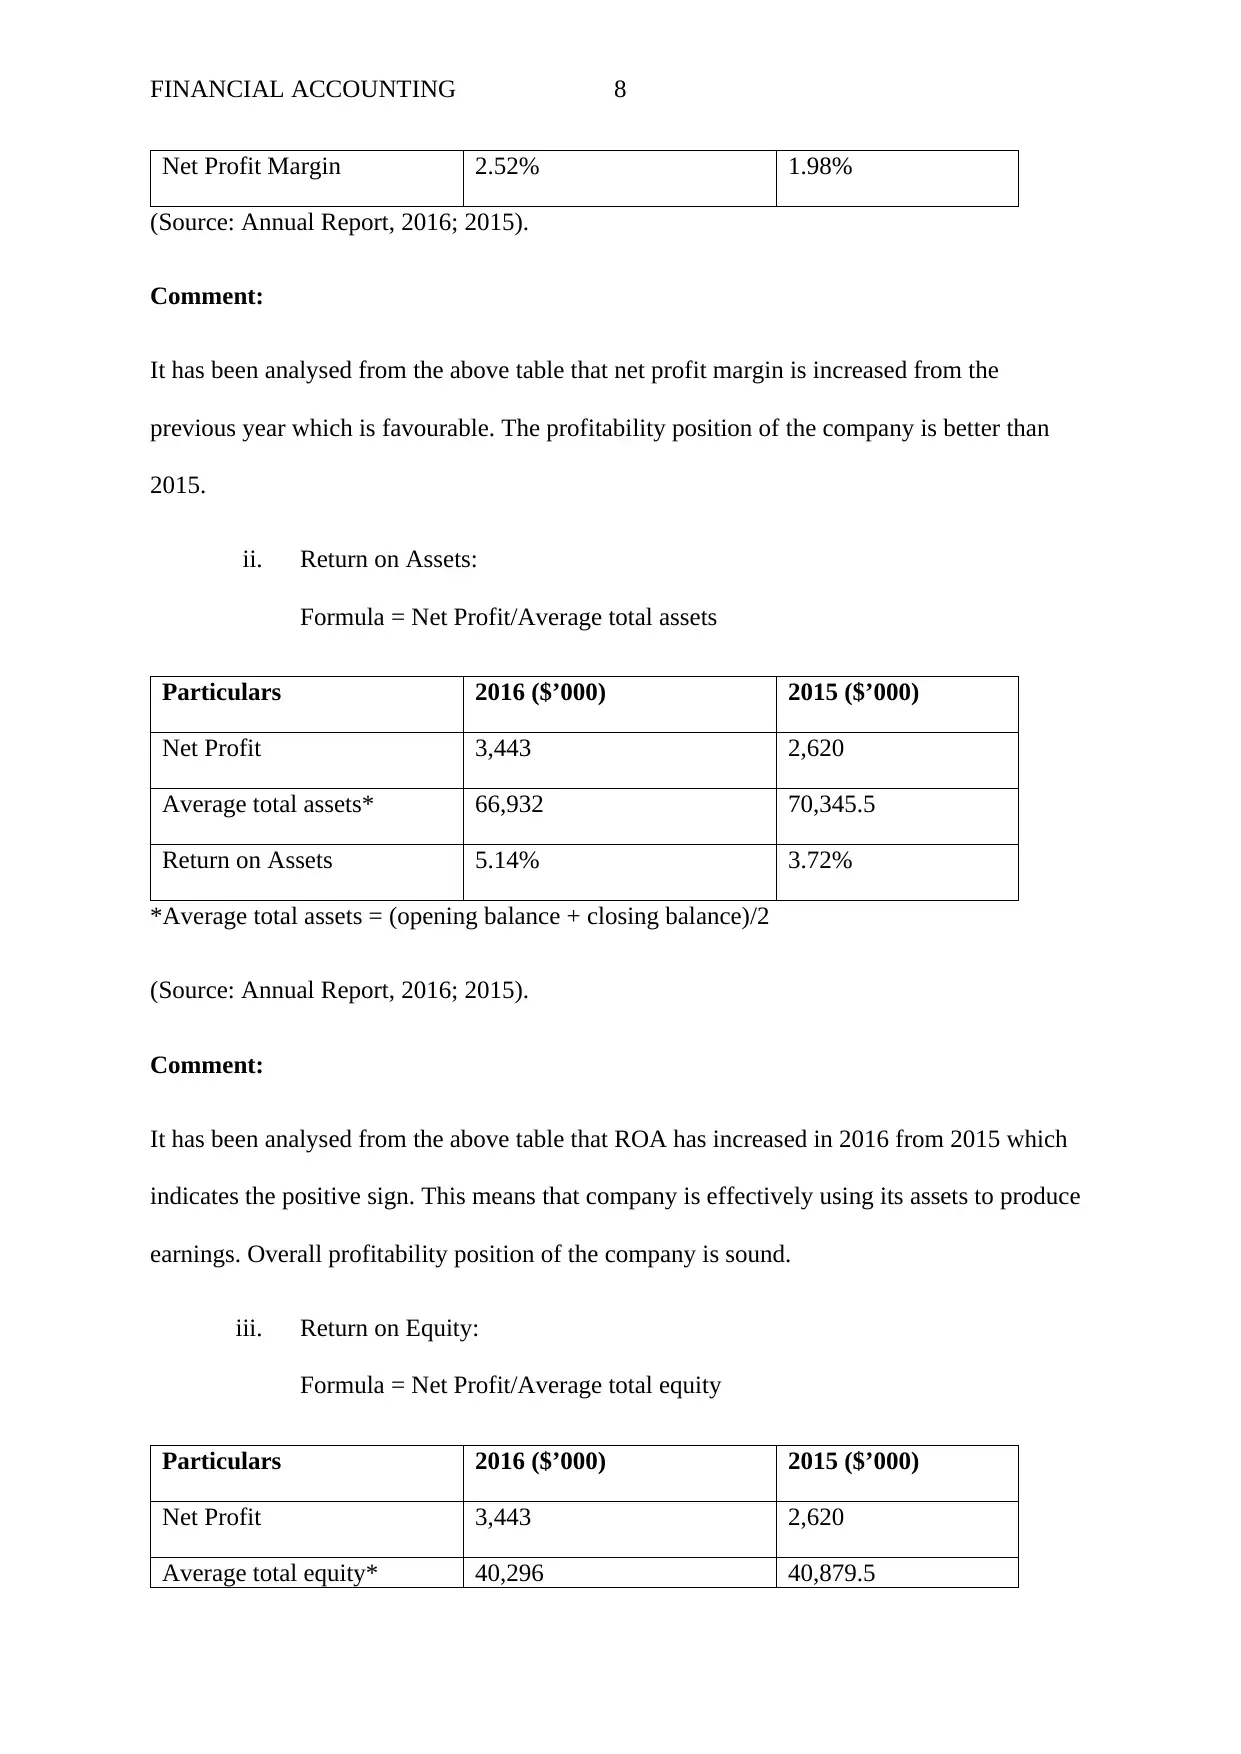
FINANCIAL ACCOUNTING 8
Net Profit Margin 2.52% 1.98%
(Source: Annual Report, 2016; 2015).
Comment:
It has been analysed from the above table that net profit margin is increased from the
previous year which is favourable. The profitability position of the company is better than
2015.
ii. Return on Assets:
Formula = Net Profit/Average total assets
Particulars 2016 ($’000) 2015 ($’000)
Net Profit 3,443 2,620
Average total assets* 66,932 70,345.5
Return on Assets 5.14% 3.72%
*Average total assets = (opening balance + closing balance)/2
(Source: Annual Report, 2016; 2015).
Comment:
It has been analysed from the above table that ROA has increased in 2016 from 2015 which
indicates the positive sign. This means that company is effectively using its assets to produce
earnings. Overall profitability position of the company is sound.
iii. Return on Equity:
Formula = Net Profit/Average total equity
Particulars 2016 ($’000) 2015 ($’000)
Net Profit 3,443 2,620
Average total equity* 40,296 40,879.5
⊘ This is a preview!⊘
Do you want full access?
Subscribe today to unlock all pages.
Trusted by 1+ million students worldwide
FINANCIAL ACCOUNTING 9
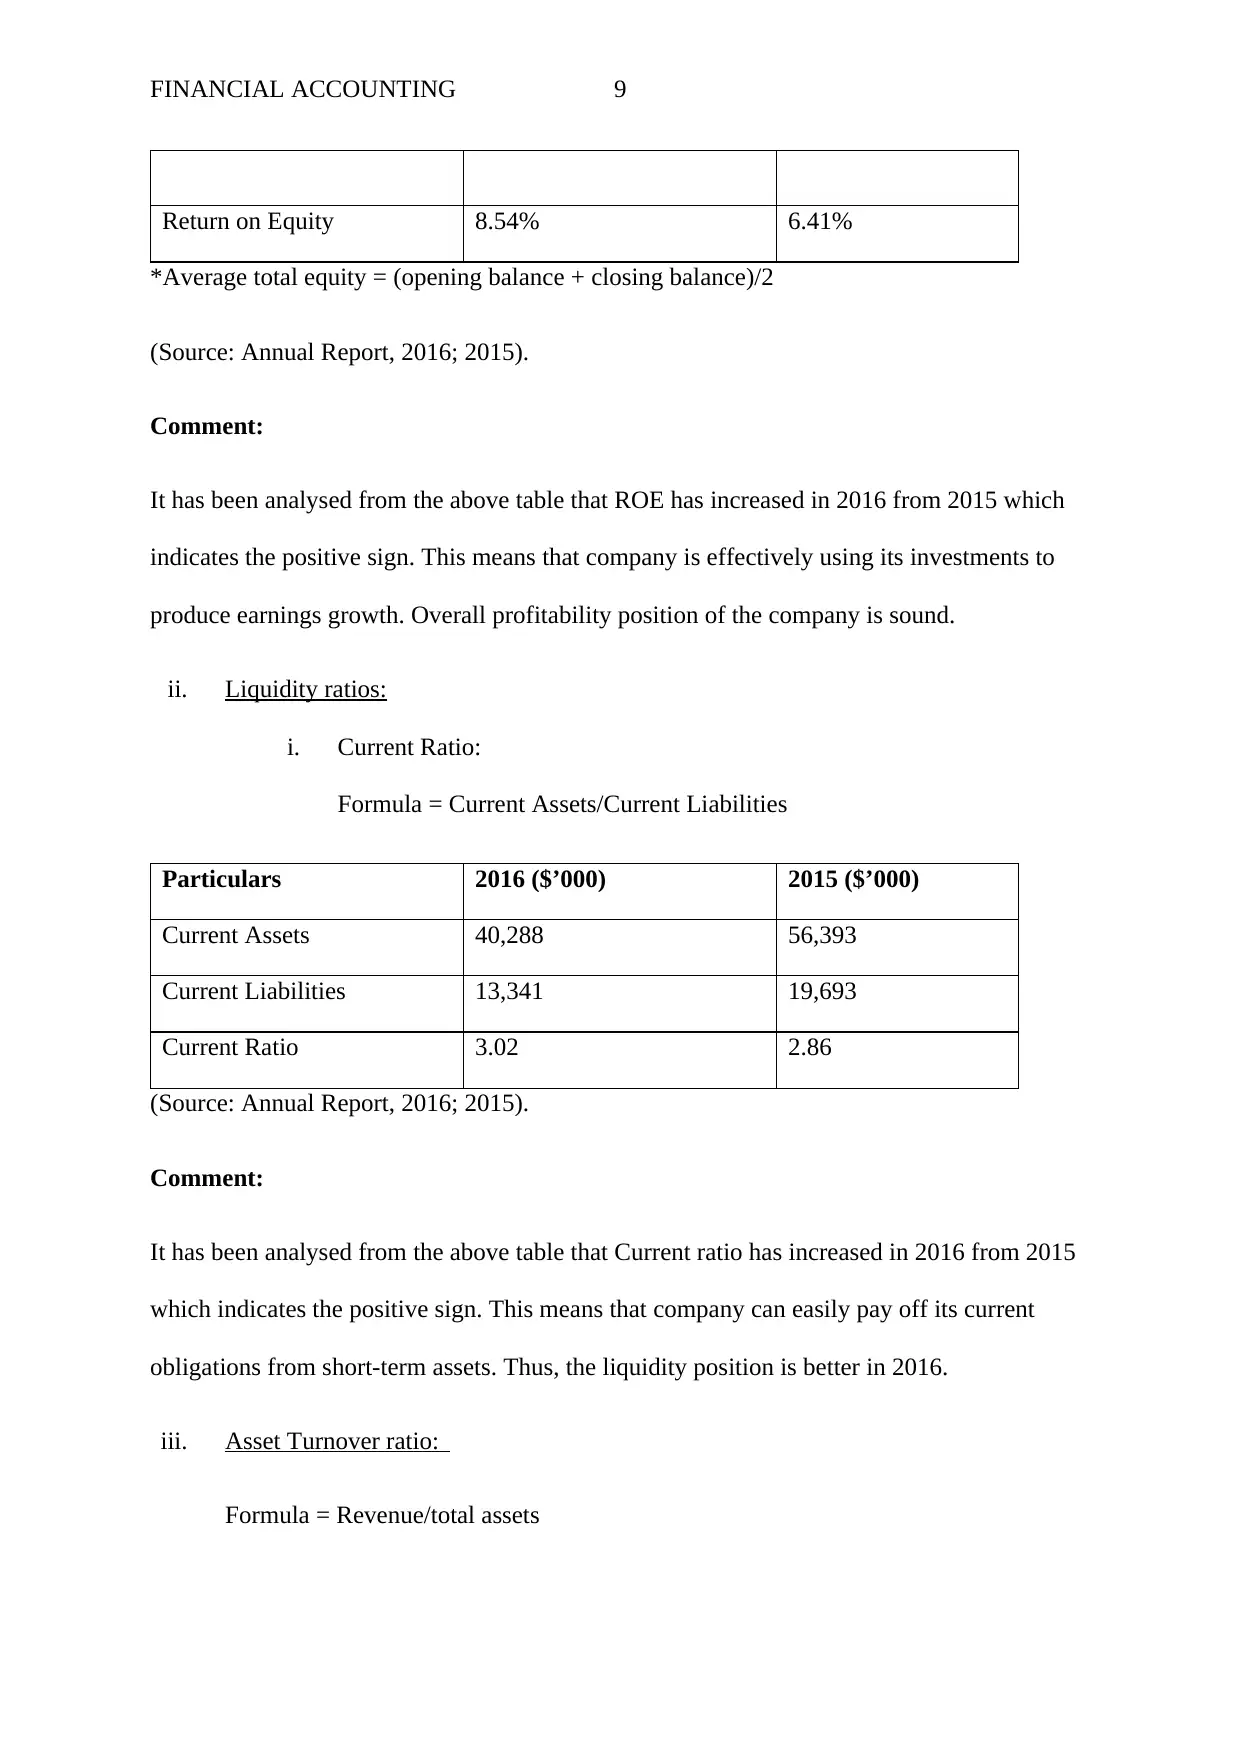
Return on Equity 8.54% 6.41%
*Average total equity = (opening balance + closing balance)/2
(Source: Annual Report, 2016; 2015).
Comment:
It has been analysed from the above table that ROE has increased in 2016 from 2015 which
indicates the positive sign. This means that company is effectively using its investments to
produce earnings growth. Overall profitability position of the company is sound.
ii. Liquidity ratios:
i. Current Ratio:
Formula = Current Assets/Current Liabilities
Particulars 2016 ($’000) 2015 ($’000)
Current Assets 40,288 56,393
Current Liabilities 13,341 19,693
Current Ratio 3.02 2.86
(Source: Annual Report, 2016; 2015).
Comment:
It has been analysed from the above table that Current ratio has increased in 2016 from 2015
which indicates the positive sign. This means that company can easily pay off its current
obligations from short-term assets. Thus, the liquidity position is better in 2016.
iii. Asset Turnover ratio:
Formula = Revenue/total assets
Paraphrase This Document
Need a fresh take? Get an instant paraphrase of this document with our AI Paraphraser
FINANCIAL ACCOUNTING 10
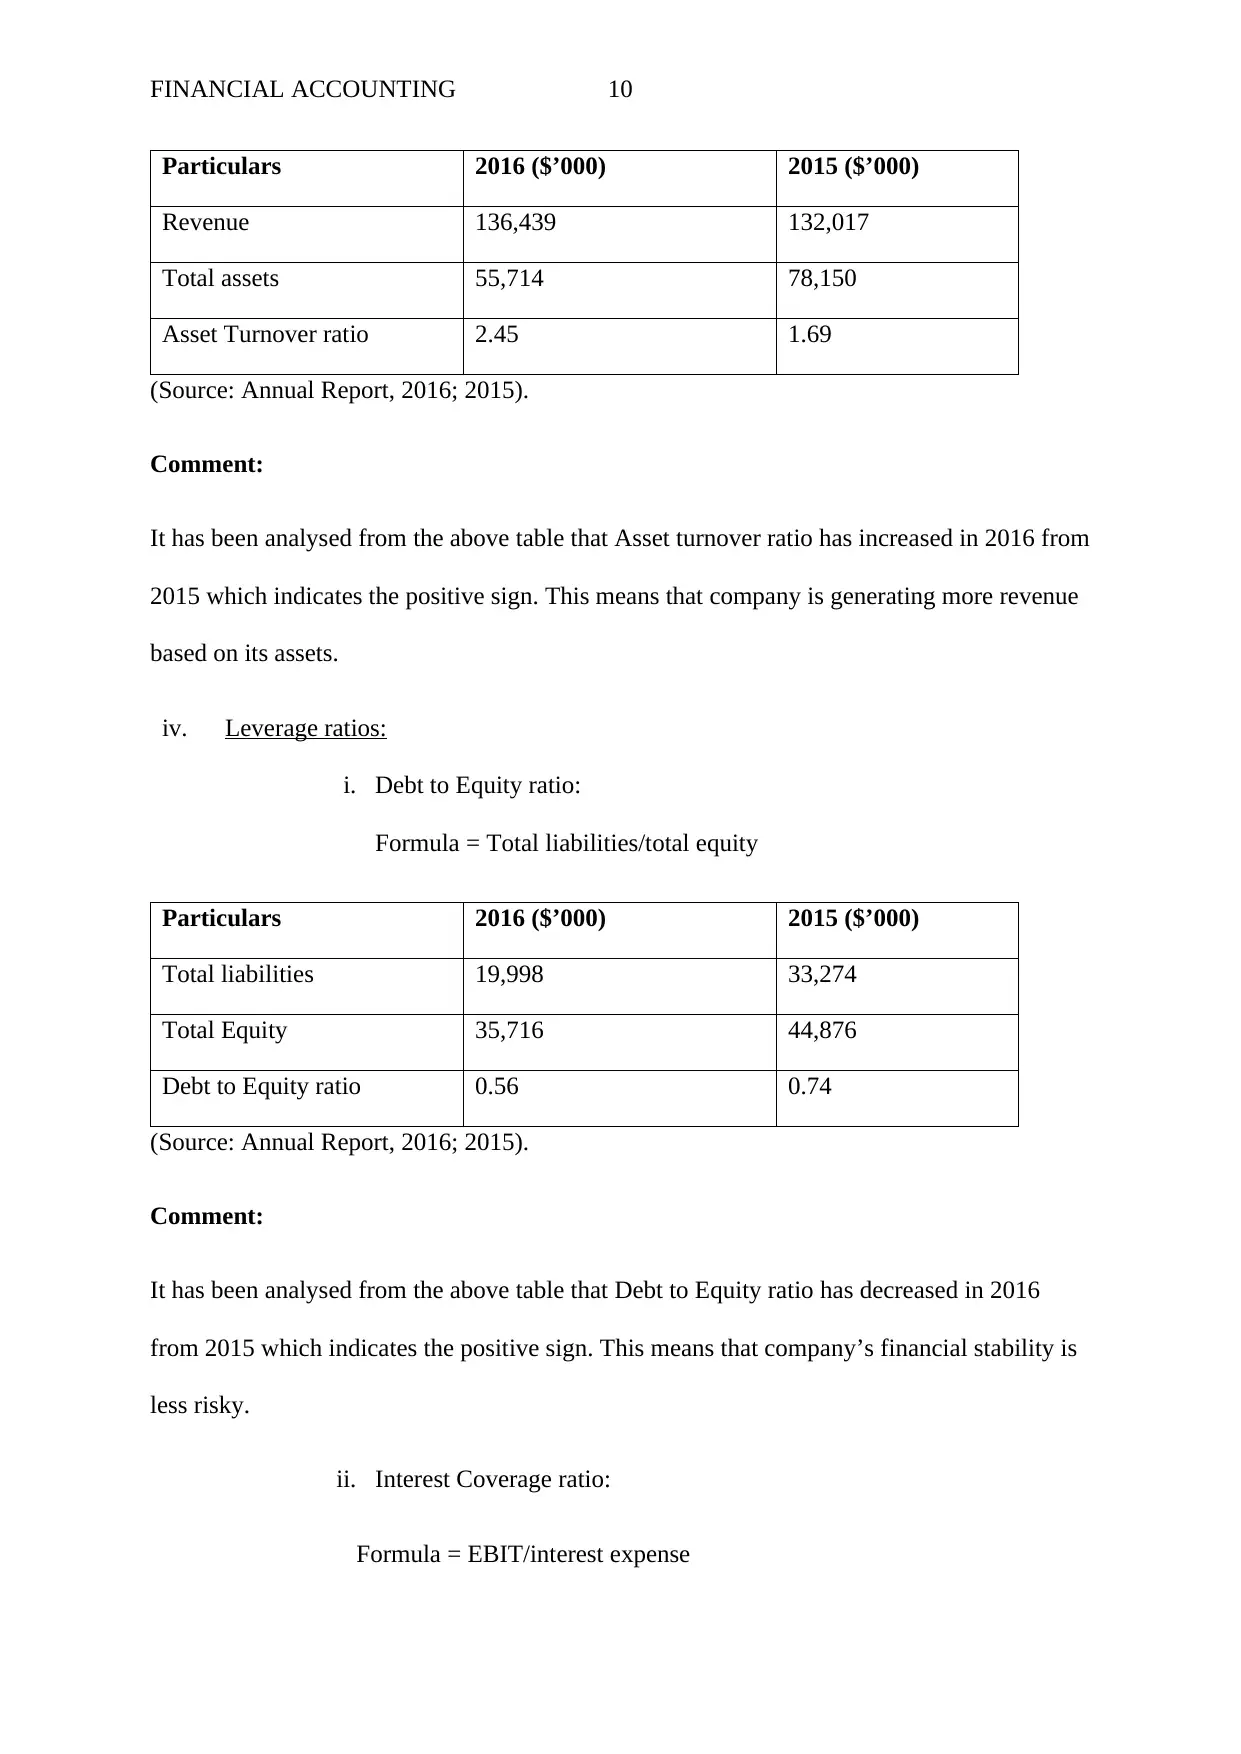
Particulars 2016 ($’000) 2015 ($’000)
Revenue 136,439 132,017
Total assets 55,714 78,150
Asset Turnover ratio 2.45 1.69
(Source: Annual Report, 2016; 2015).
Comment:
It has been analysed from the above table that Asset turnover ratio has increased in 2016 from
2015 which indicates the positive sign. This means that company is generating more revenue
based on its assets.
iv. Leverage ratios:
i. Debt to Equity ratio:
Formula = Total liabilities/total equity
Particulars 2016 ($’000) 2015 ($’000)
Total liabilities 19,998 33,274
Total Equity 35,716 44,876
Debt to Equity ratio 0.56 0.74
(Source: Annual Report, 2016; 2015).
Comment:
It has been analysed from the above table that Debt to Equity ratio has decreased in 2016
from 2015 which indicates the positive sign. This means that company’s financial stability is
less risky.
ii. Interest Coverage ratio:
Formula = EBIT/interest expense
Particulars 2016 ($’000) 2015 ($’000)
Revenue 136,439 132,017
Total assets 55,714 78,150
Asset Turnover ratio 2.45 1.69
(Source: Annual Report, 2016; 2015).
Comment:
It has been analysed from the above table that Asset turnover ratio has increased in 2016 from
2015 which indicates the positive sign. This means that company is generating more revenue
based on its assets.
iv. Leverage ratios:
i. Debt to Equity ratio:
Formula = Total liabilities/total equity
Particulars 2016 ($’000) 2015 ($’000)
Total liabilities 19,998 33,274
Total Equity 35,716 44,876
Debt to Equity ratio 0.56 0.74
(Source: Annual Report, 2016; 2015).
Comment:
It has been analysed from the above table that Debt to Equity ratio has decreased in 2016
from 2015 which indicates the positive sign. This means that company’s financial stability is
less risky.
ii. Interest Coverage ratio:
Formula = EBIT/interest expense
FINANCIAL ACCOUNTING 11
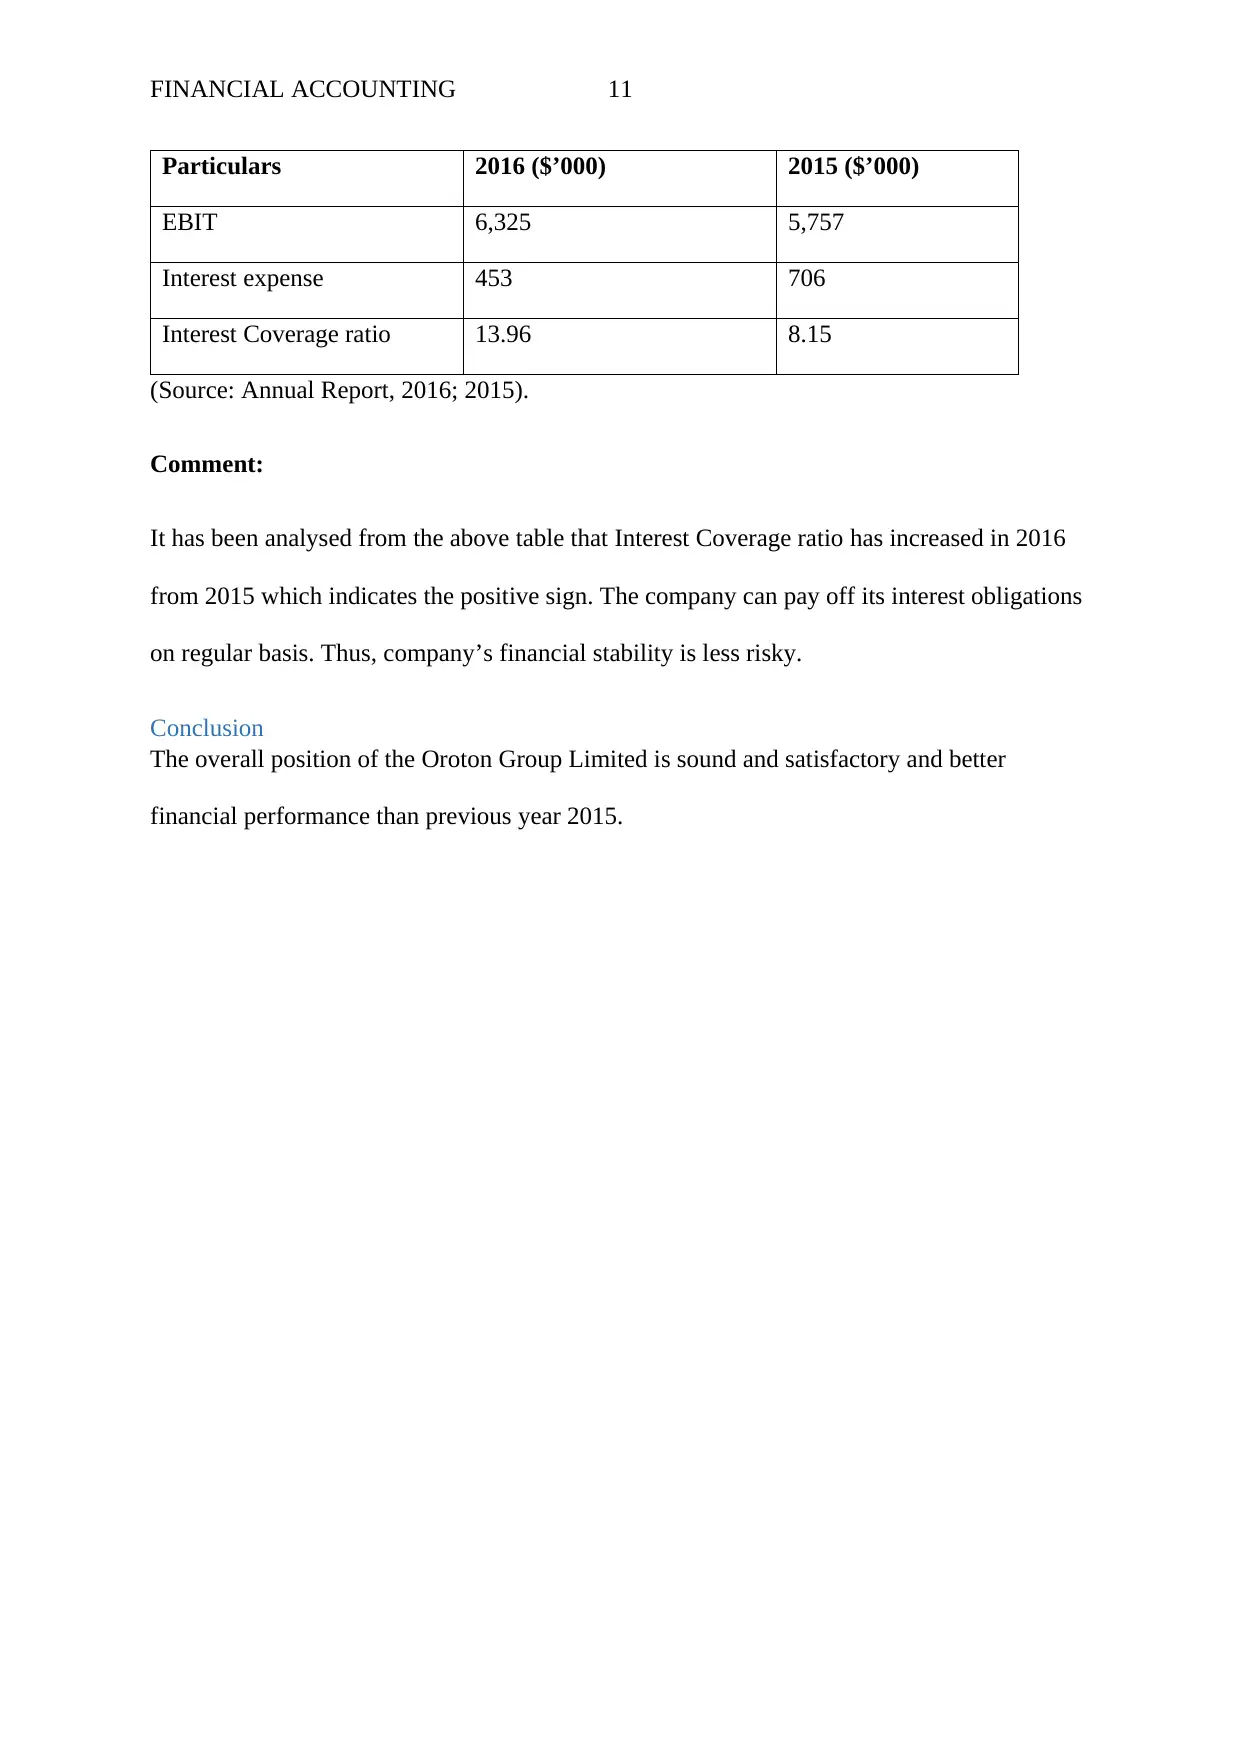
Particulars 2016 ($’000) 2015 ($’000)
EBIT 6,325 5,757
Interest expense 453 706
Interest Coverage ratio 13.96 8.15
(Source: Annual Report, 2016; 2015).
Comment:
It has been analysed from the above table that Interest Coverage ratio has increased in 2016
from 2015 which indicates the positive sign. The company can pay off its interest obligations
on regular basis. Thus, company’s financial stability is less risky.
Conclusion
The overall position of the Oroton Group Limited is sound and satisfactory and better
financial performance than previous year 2015.
⊘ This is a preview!⊘
Do you want full access?
Subscribe today to unlock all pages.
Trusted by 1+ million students worldwide
1 out of 12
Your All-in-One AI-Powered Toolkit for Academic Success.
+13062052269
info@desklib.com
Available 24*7 on WhatsApp / Email
![[object Object]](/_next/static/media/star-bottom.7253800d.svg)
Unlock your academic potential
Copyright © 2020–2026 A2Z Services. All Rights Reserved. Developed and managed by ZUCOL.