OrotonGroup Limited and Kathmandu Limited: Ratio Analysis Report

Verified

Added on  2020/02/24

|7
|1488
|62
Report
AI Summary
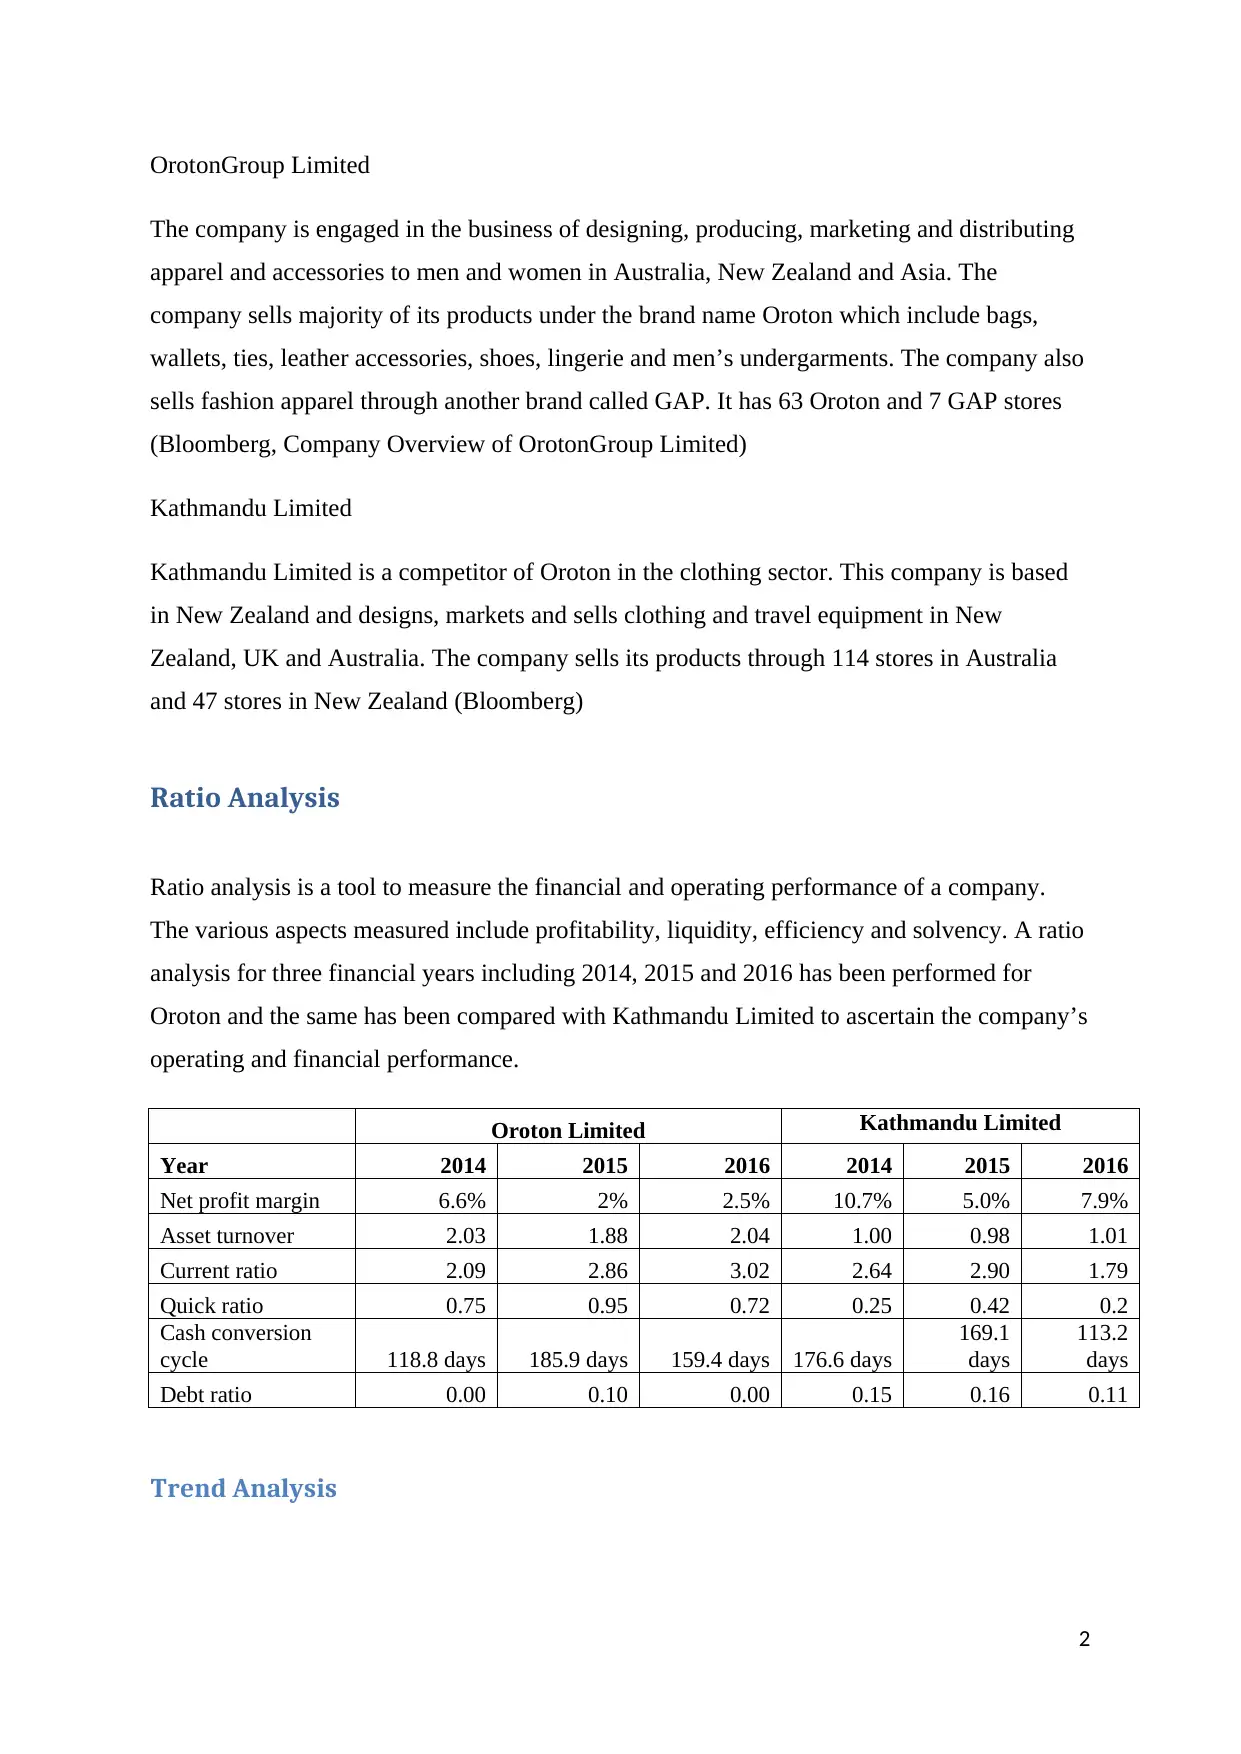
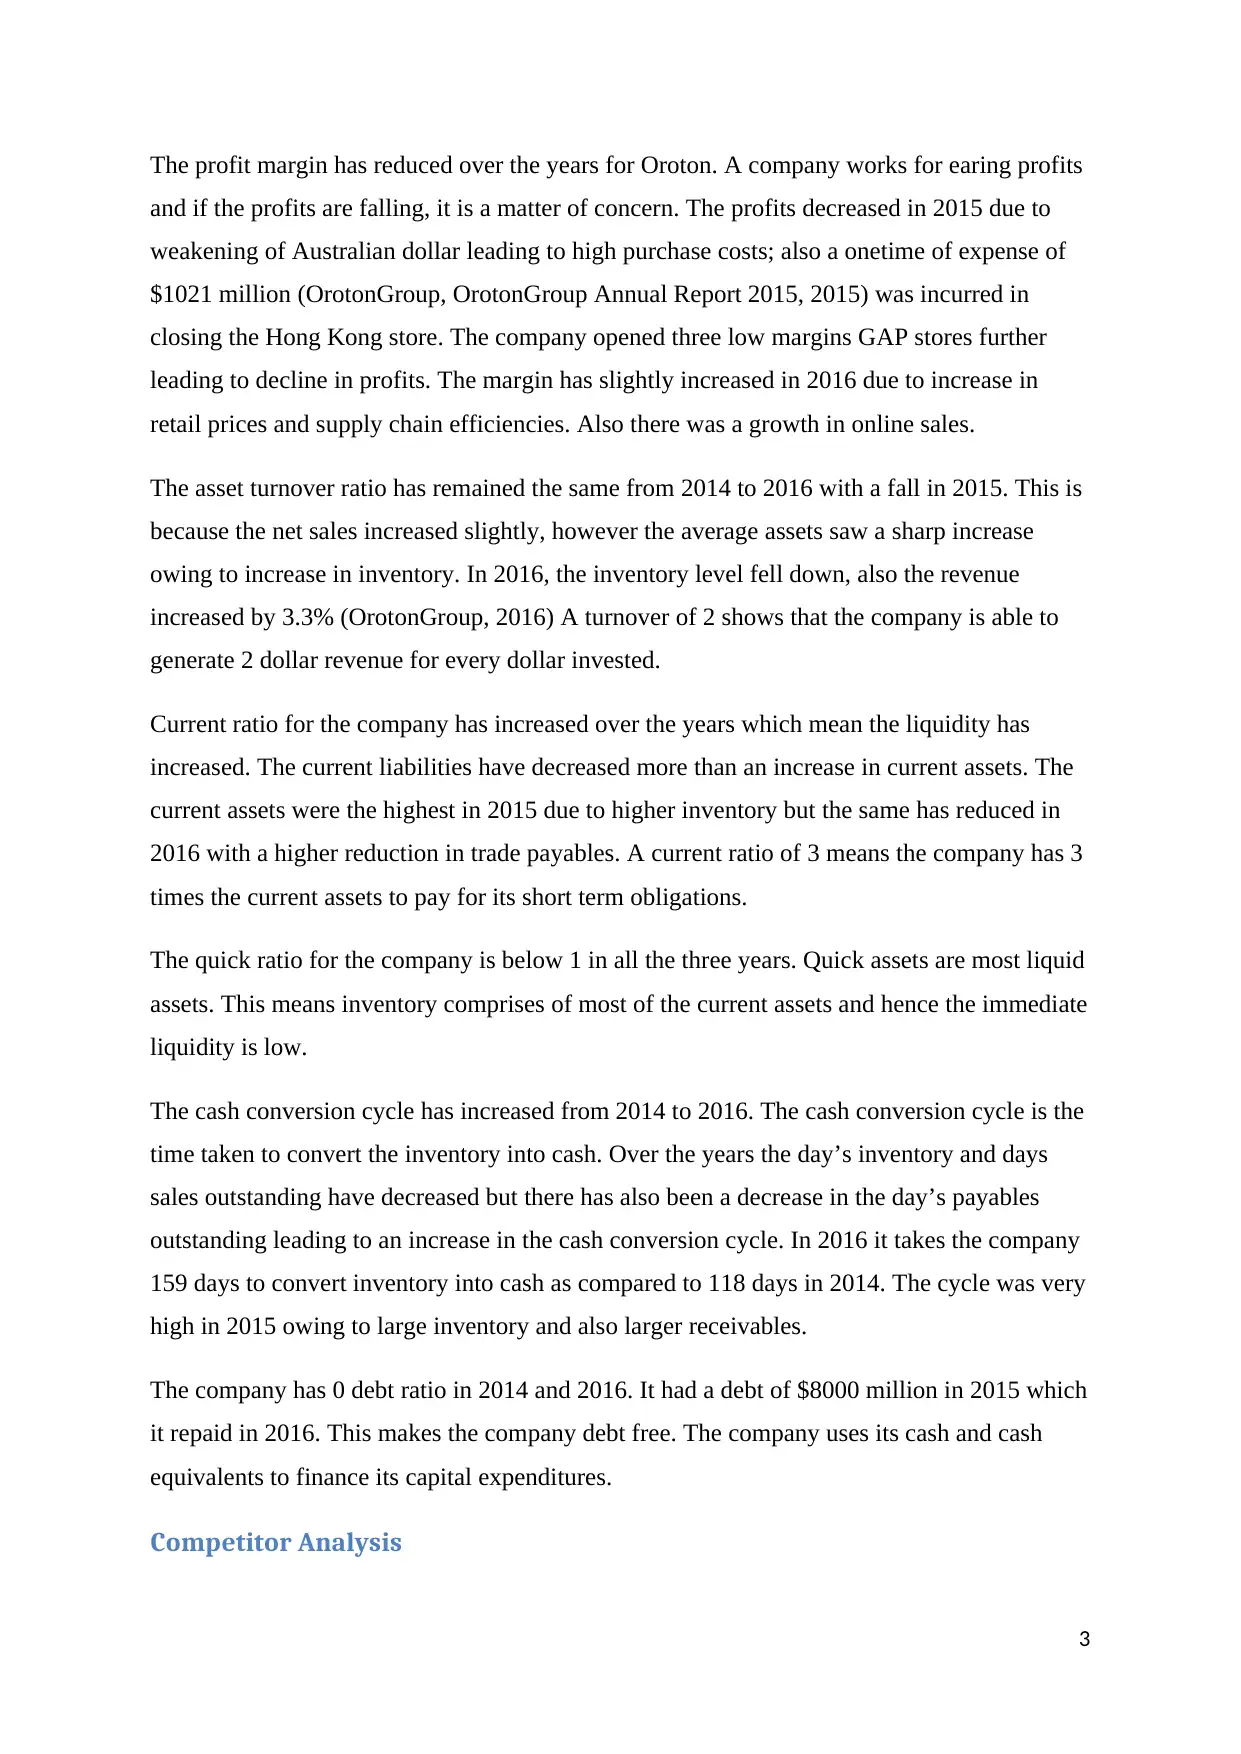
This report presents a detailed ratio analysis comparing the financial performance of OrotonGroup Limited and Kathmandu Limited over three years (2014-2016). The analysis covers key financial ratios, including net profit margin, asset turnover, current ratio, quick ratio, cash conversion cycle, and debt ratio. The report examines trends in these ratios for both companies, highlighting OrotonGroup's lower profit margins but higher asset turnover compared to Kathmandu. A competitor analysis is performed to benchmark Oroton's performance against Kathmandu. The report concludes with recommendations for OrotonGroup to improve its financial performance, focusing on strategies to enhance profit margins, reduce the cash conversion cycle, and improve receivables collection. Data from the companies' annual reports is used to support the calculations and findings.
tabler-icon-diamond-filled.svg

Contribute Materials

Your contribution can guide someone’s learning journey. Share your documents today.
Document Page
OrotonGroup Limited and Kathmandu Limited
Ratio Analysis and Comparison
tabler-icon-diamond-filled.svg

Secure Best Marks with AI Grader

Need help grading? Try our AI Grader for instant feedback on your assignments.
Document Page
Contents
Introduction...........................................................................................................................................2
Ratio Analysis........................................................................................................................................3
Trend Analysis...................................................................................................................................3
Competitor Analysis...........................................................................................................................4
Recommendations.................................................................................................................................5
Bibliography...........................................................................................................................................5
Appendix...............................................................................................................................................5
Introduction
1
Document Page
OrotonGroup Limited
The company is engaged in the business of designing, producing, marketing and distributing
apparel and accessories to men and women in Australia, New Zealand and Asia. The
company sells majority of its products under the brand name Oroton which include bags,
wallets, ties, leather accessories, shoes, lingerie and men’s undergarments. The company also
sells fashion apparel through another brand called GAP. It has 63 Oroton and 7 GAP stores
(Bloomberg, Company Overview of OrotonGroup Limited)
Kathmandu Limited
Kathmandu Limited is a competitor of Oroton in the clothing sector. This company is based
in New Zealand and designs, markets and sells clothing and travel equipment in New
Zealand, UK and Australia. The company sells its products through 114 stores in Australia
and 47 stores in New Zealand (Bloomberg)
Ratio Analysis
Ratio analysis is a tool to measure the financial and operating performance of a company.
The various aspects measured include profitability, liquidity, efficiency and solvency. A ratio
analysis for three financial years including 2014, 2015 and 2016 has been performed for
Oroton and the same has been compared with Kathmandu Limited to ascertain the company’s
operating and financial performance.
Oroton Limited Kathmandu Limited
Year 2014 2015 2016 2014 2015 2016
Net profit margin 6.6% 2% 2.5% 10.7% 5.0% 7.9%
Asset turnover 2.03 1.88 2.04 1.00 0.98 1.01
Current ratio 2.09 2.86 3.02 2.64 2.90 1.79
Quick ratio 0.75 0.95 0.72 0.25 0.42 0.2
Cash conversion
cycle 118.8 days 185.9 days 159.4 days 176.6 days
169.1
days
113.2
days
Debt ratio 0.00 0.10 0.00 0.15 0.16 0.11
Trend Analysis
2
Document Page
The profit margin has reduced over the years for Oroton. A company works for earing profits
and if the profits are falling, it is a matter of concern. The profits decreased in 2015 due to
weakening of Australian dollar leading to high purchase costs; also a onetime of expense of
$1021 million (OrotonGroup, OrotonGroup Annual Report 2015, 2015) was incurred in
closing the Hong Kong store. The company opened three low margins GAP stores further
leading to decline in profits. The margin has slightly increased in 2016 due to increase in
retail prices and supply chain efficiencies. Also there was a growth in online sales.
The asset turnover ratio has remained the same from 2014 to 2016 with a fall in 2015. This is
because the net sales increased slightly, however the average assets saw a sharp increase
owing to increase in inventory. In 2016, the inventory level fell down, also the revenue
increased by 3.3% (OrotonGroup, 2016) A turnover of 2 shows that the company is able to
generate 2 dollar revenue for every dollar invested.
Current ratio for the company has increased over the years which mean the liquidity has
increased. The current liabilities have decreased more than an increase in current assets. The
current assets were the highest in 2015 due to higher inventory but the same has reduced in
2016 with a higher reduction in trade payables. A current ratio of 3 means the company has 3
times the current assets to pay for its short term obligations.
The quick ratio for the company is below 1 in all the three years. Quick assets are most liquid
assets. This means inventory comprises of most of the current assets and hence the immediate
liquidity is low.
The cash conversion cycle has increased from 2014 to 2016. The cash conversion cycle is the
time taken to convert the inventory into cash. Over the years the day’s inventory and days
sales outstanding have decreased but there has also been a decrease in the day’s payables
outstanding leading to an increase in the cash conversion cycle. In 2016 it takes the company
159 days to convert inventory into cash as compared to 118 days in 2014. The cycle was very
high in 2015 owing to large inventory and also larger receivables.
The company has 0 debt ratio in 2014 and 2016. It had a debt of $8000 million in 2015 which
it repaid in 2016. This makes the company debt free. The company uses its cash and cash
equivalents to finance its capital expenditures.
Competitor Analysis
3
tabler-icon-diamond-filled.svg

Secure Best Marks with AI Grader

Need help grading? Try our AI Grader for instant feedback on your assignments.
Document Page
All the above ratios were calculated for Oroton’s competitor Kathmandu Limited to see how
the company is performing against its peers in the industry. Oroton has lower profit margins
as compared to Kathmandu limited. However, the trend of profit margins remains the same
for both the companies owing to weakening of Australian dollar. Oroton has a better asset
turnover ratio and almost double of Kathmandu. This means Oroton is more efficient in using
its assets to generate sales. Even the current ratio of Oroton is better. There is a huge gap in
the current ratio in 2016 as the ratio is below 2 for Kathmandu. This is because the current
assets have decreased in the form of inventory and liabilities have increased. Even the quick
ratio is higher for Oroton as Kathmandu has huge level of inventory. Kathmandu has a lower
cash conversion cycle due to lower day’s sales outstanding. The day’s inventory outstanding
is also decreasing due to lower inventory levels. The company has implemented a demand
planning software which has reduced the inventory levels (Limited, 2016). The company also
has increase in day’s payables outstanding. The debt ratio of Orton is lower as it has no debt
in two years. But Kathmandu also has lower debt ratio in the range of 11% to 15%.
Recommendations
We see that Oroton has much lower margins as compared to Kathmandu and the margins
have reduced over the years. The company should focus on improving margins by reducing
costs and increasing its revenue further from online sales. The company also has higher cash
conversion cycle which can be improved by reducing the day’s sales outstanding. Its
competitor Kathmandu has very low days sales outstanding, hence Oroton should improve its
receivables collection. Also it should increase its payables outstanding as done by its
competitor to increase the cycle. This is possible by maintaining good supplier relations.
The comparison to Kathmandu Limited may not be perfectly accurate as both companies may
use different accounting policies which can result in different results of ratios.
Bibliography
Bloomberg. (n.d.). Company Overview of Kathmandu Holdings Limited. Retrieved August 28, 2017,
from https://www.bloomberg.com/research/stocks/private/snapshot.asp?
privcapId=26813745
Bloomberg. (n.d.). Company Overview of OrotonGroup Limited. Retrieved August 28, 2017, from
https://www.bloomberg.com/research/stocks/private/snapshot.asp?privcapId=4492775
4
Document Page
Limited, K. (2016). 2016 Annual Report Kathmandu. Australia.
OrotonGroup. (2015). OrotonGroup Annual Report 2015. Australia.
OrotonGroup. (2016). OrotonGroup Annual Report 2016. Australia.
Appendix
The company data used in calculation of the above ratios is presented below:
Oroton Limited ($million)
Kathmandu Limited ($
millions)
2014 2015 2016 2014 2015 2016
Net sales 1,24,889 1,32,017 1,36,439 3,92,918 4,09,372 4,25,593
Net profit 8,258 2,620 3,443 42,152 20,419 33,521
Average Total assets 61,496 70,346 66,932 3,92,257 4,19,374 4,21,852
Current assets 43,031 56,393 40,288 1,14,748 1,32,348 1,07,358
Current liabilities 20,634 19,693 13,341 43,458 45,700 59,825
Inventory 27,598 37,713 30,656 1,03,767 1,13,270 95,436
Accounts receivables 5,287 7,482 5,446 3,779 3,741 5,031
Accounts payables 17,625 18,750 12,334 37,489 44,048 51,084
Cost of sales 46,875 51,909 54,408 1,44,777 1,57,482 1,59,232
Total debt - 8,000 - 62,715 71,015 43,691
Total assets 62,541 78,150 55,714 4,08,297 4,30,451 4,13,253
The formulas used in calculation of the ratios are presented below:
Ratio Formula
Net profit margin Net profit / net sales
Asset turnover Net sales / average total assets
Current ratio Current assets / current liabilities
5
Document Page
Quick ratio (Current assets – inventory) / current
liabilities
Days inventory outstanding (Inventory / cost of sales) *365
Days sales outstanding (accounts receivables / cost of sales) *365
Days payables outstanding (accounts payables / cost of sales) *365
Cash conversion cycle Days inventory outstanding + Days sales
outstanding - Days payables outstanding
Debt ratio Total debt / total assets
6
chevron_up_icon
1 out of 7
circle_padding
hide_on_mobile
zoom_out_icon
logo.png

Your All-in-One AI-Powered Toolkit for Academic Success.

Available 24*7 on WhatsApp / Email

[object Object]