Determination of Orthophosphate: A Colorimetric Analysis Report
VerifiedAdded on 2023/04/22
|14
|2200
|375
Practical Assignment
AI Summary
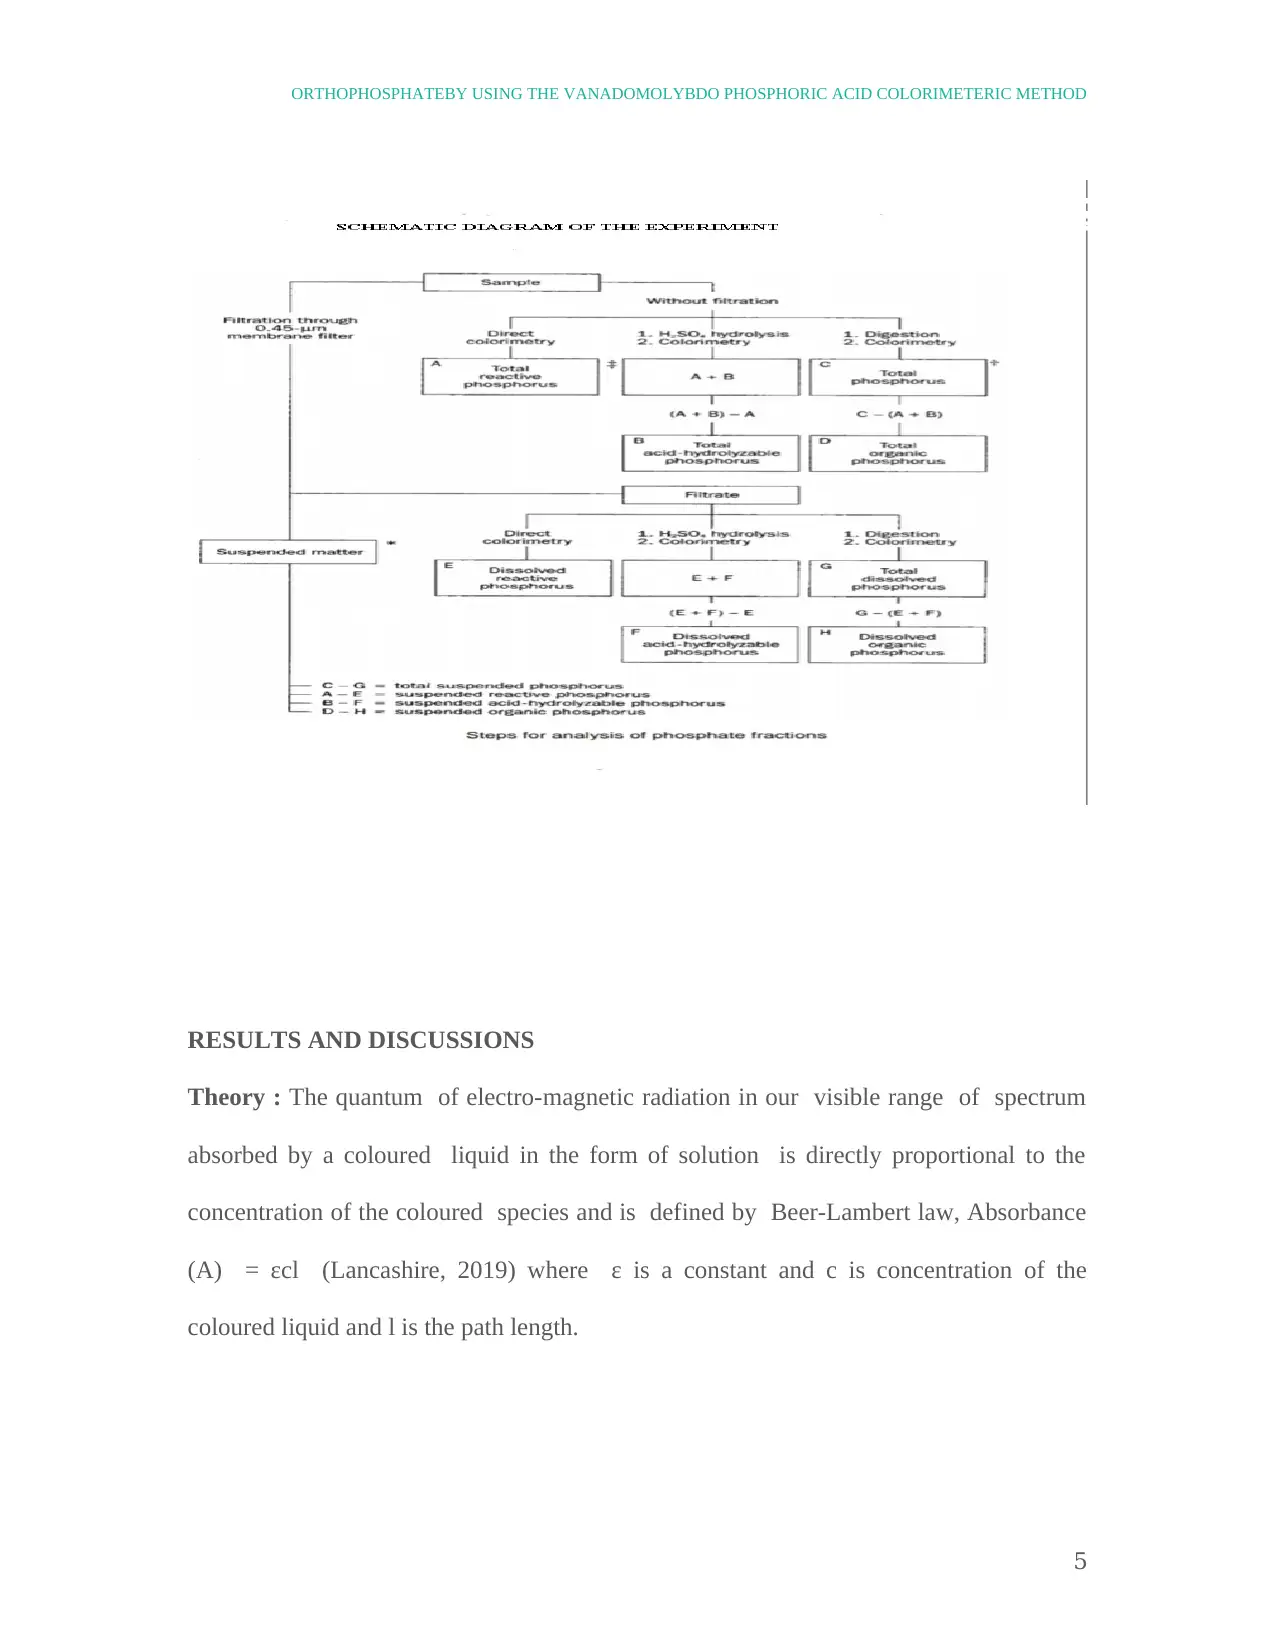
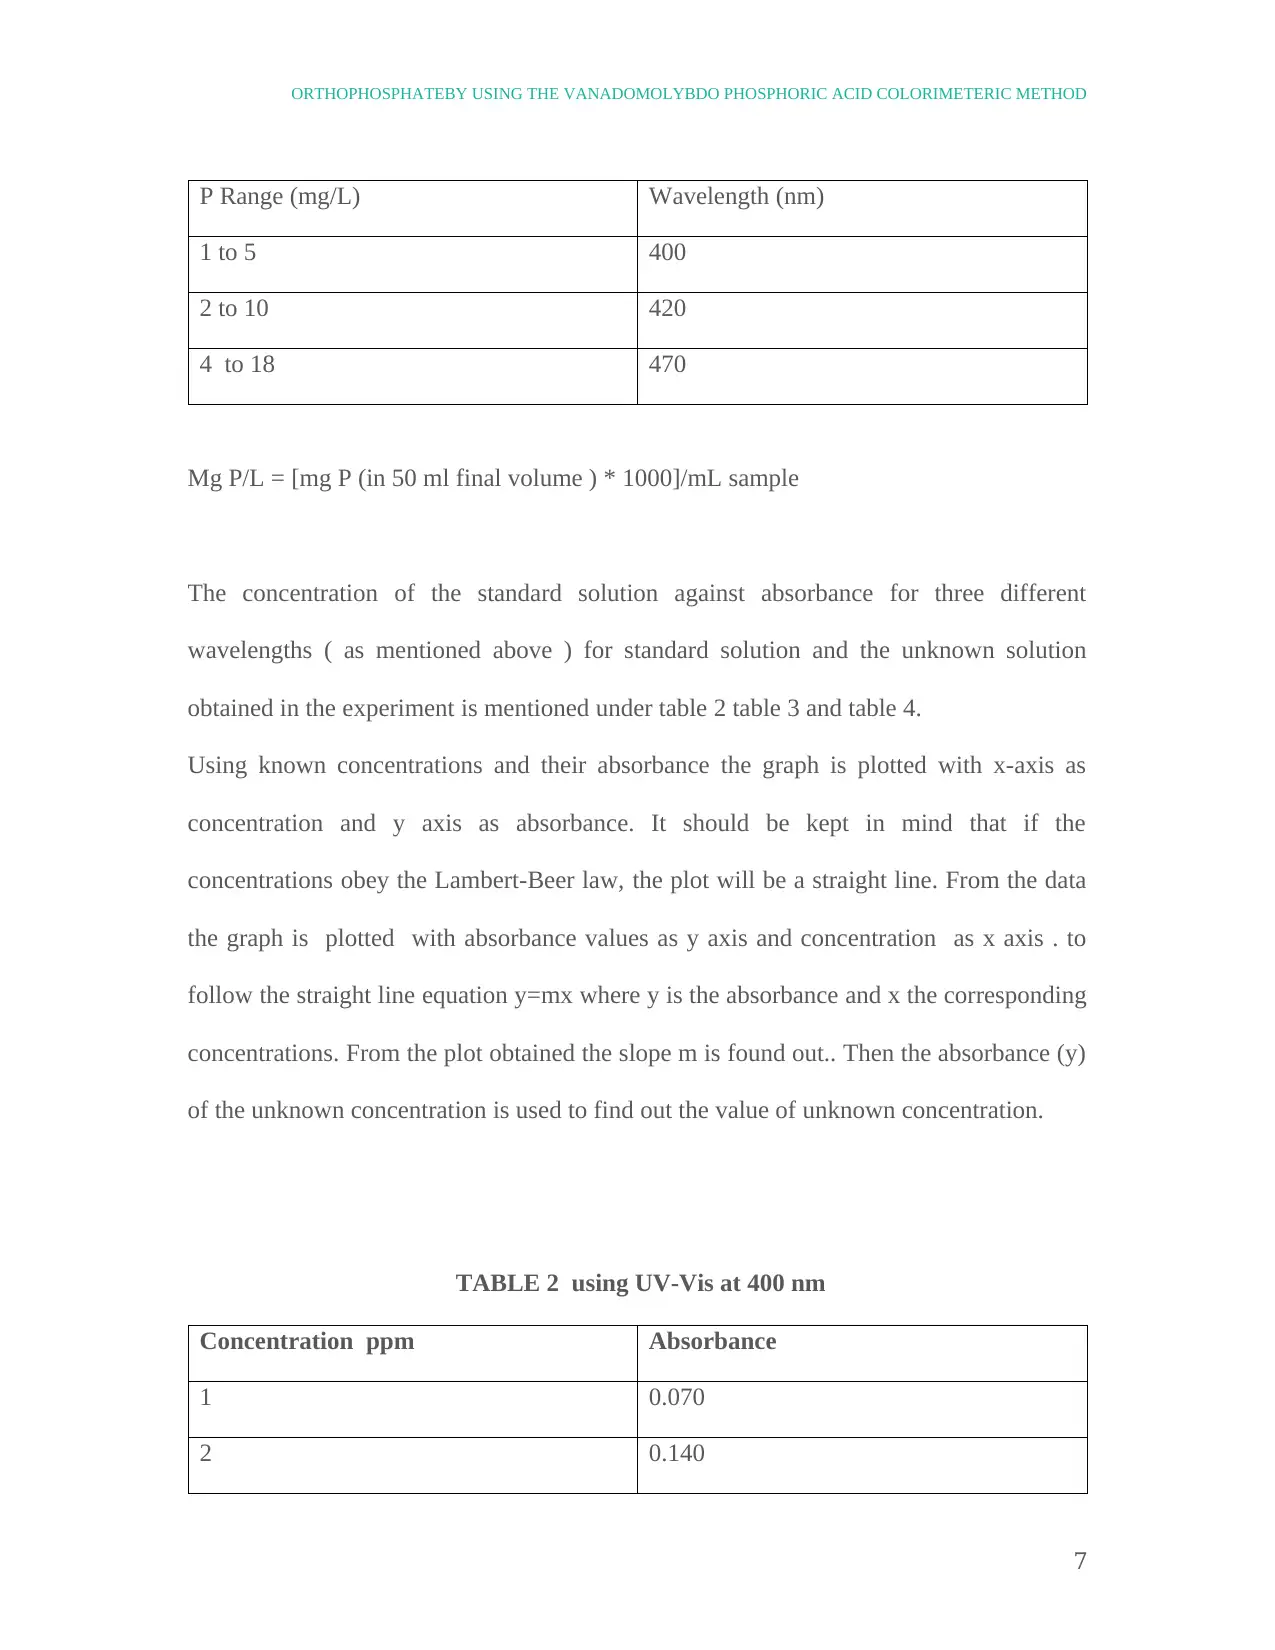
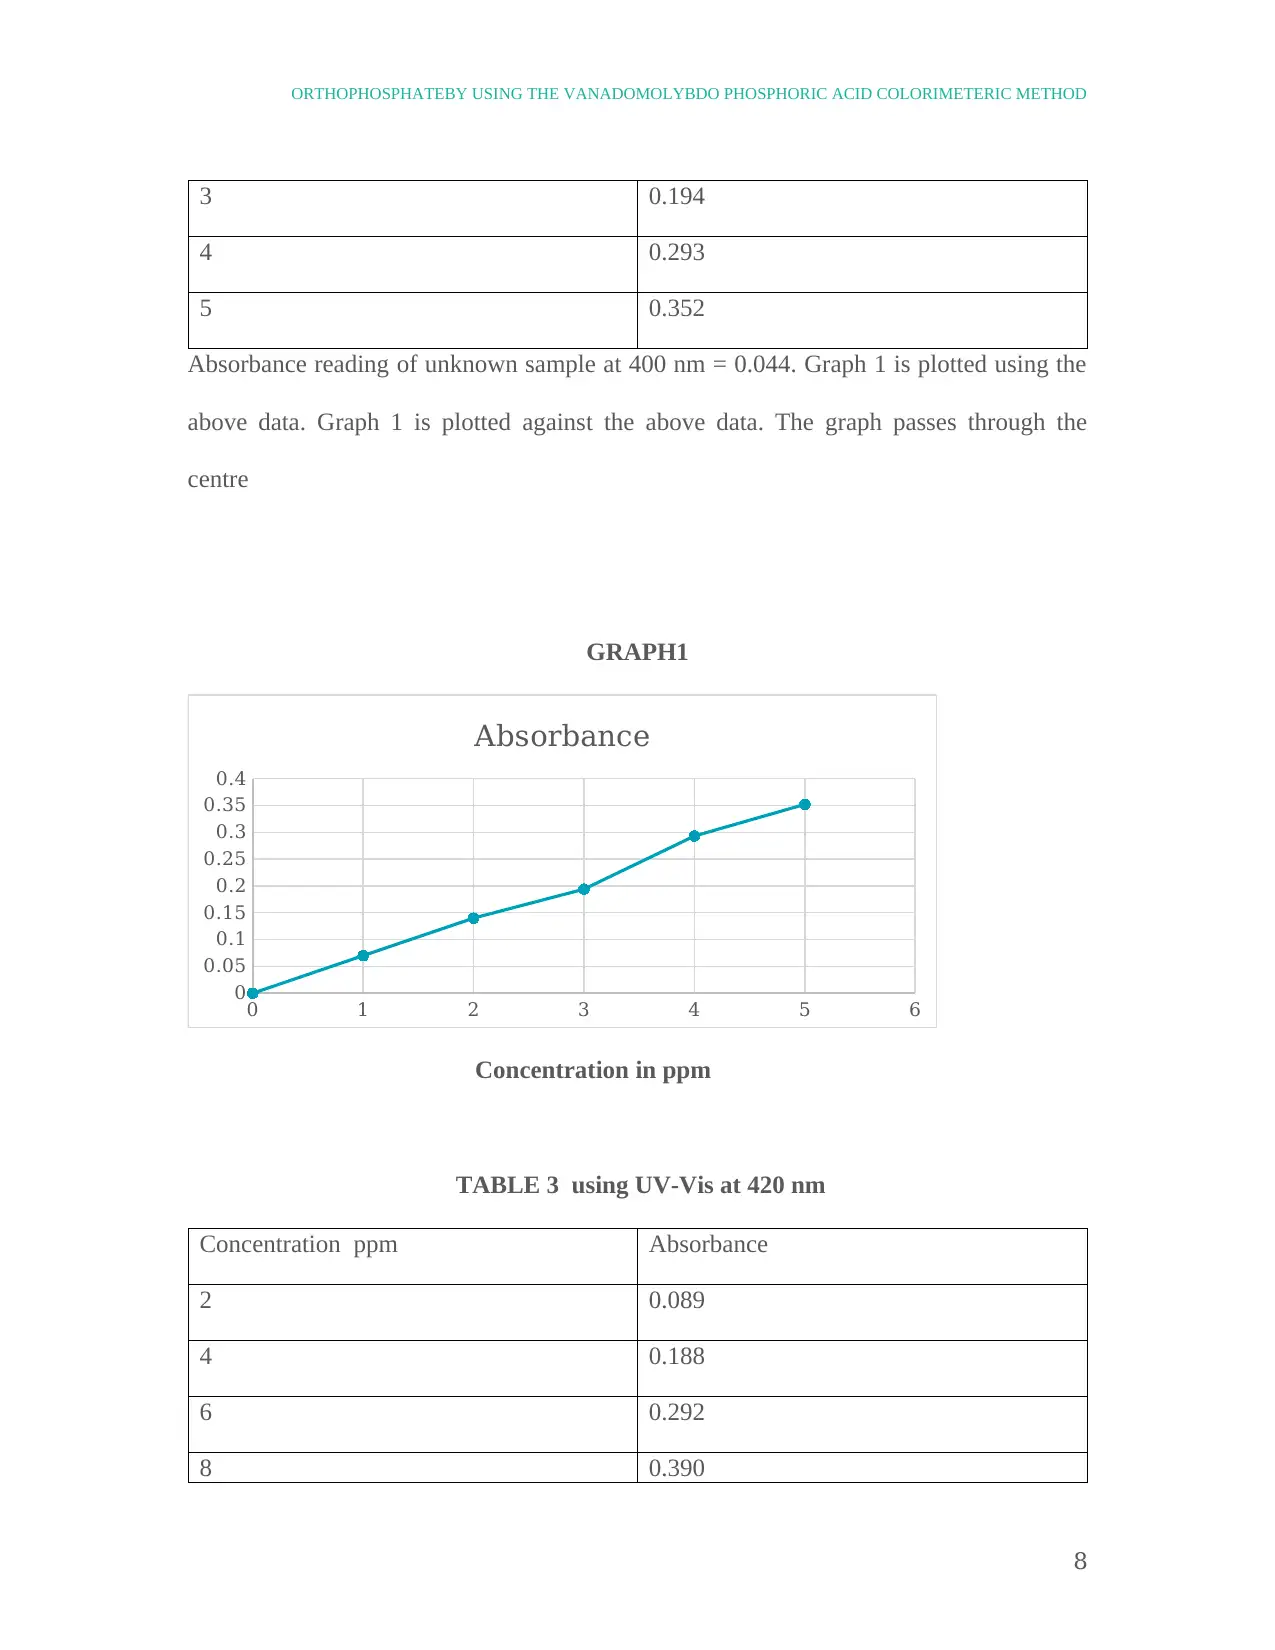
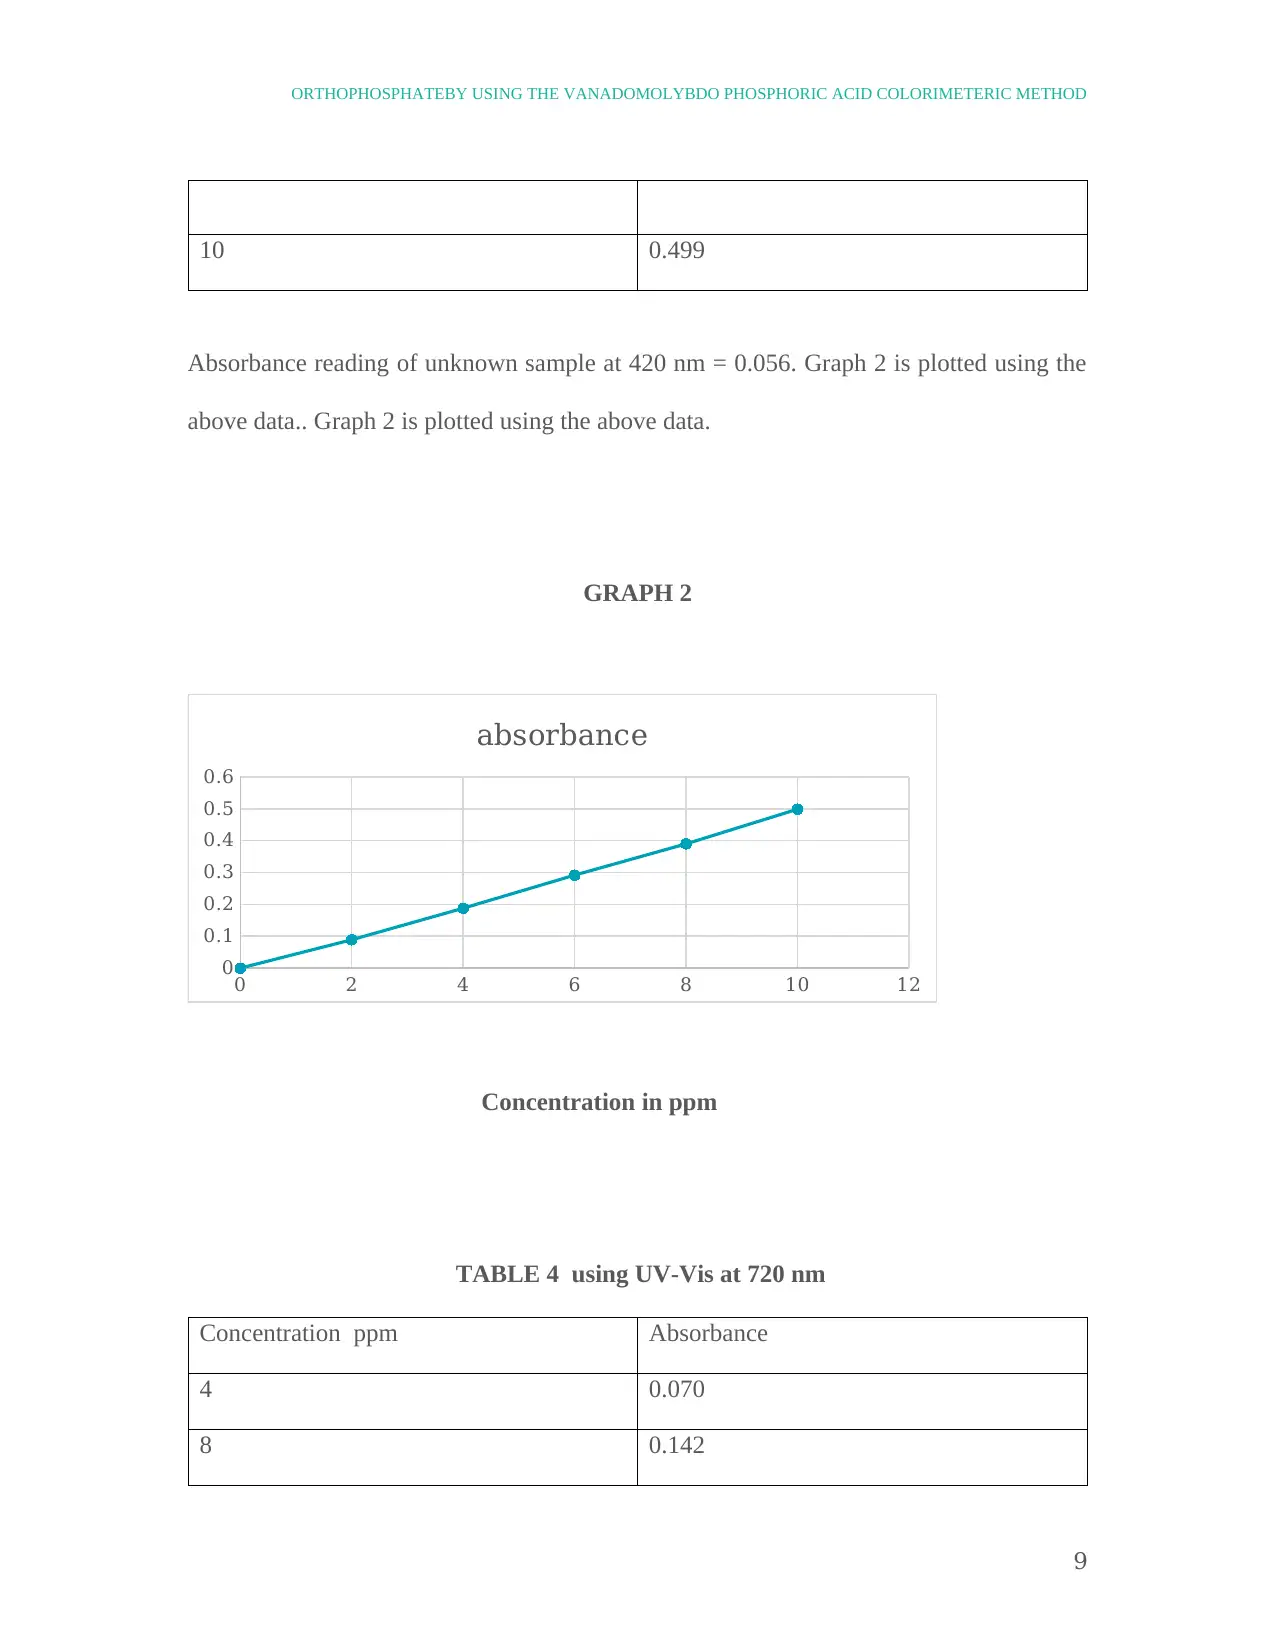
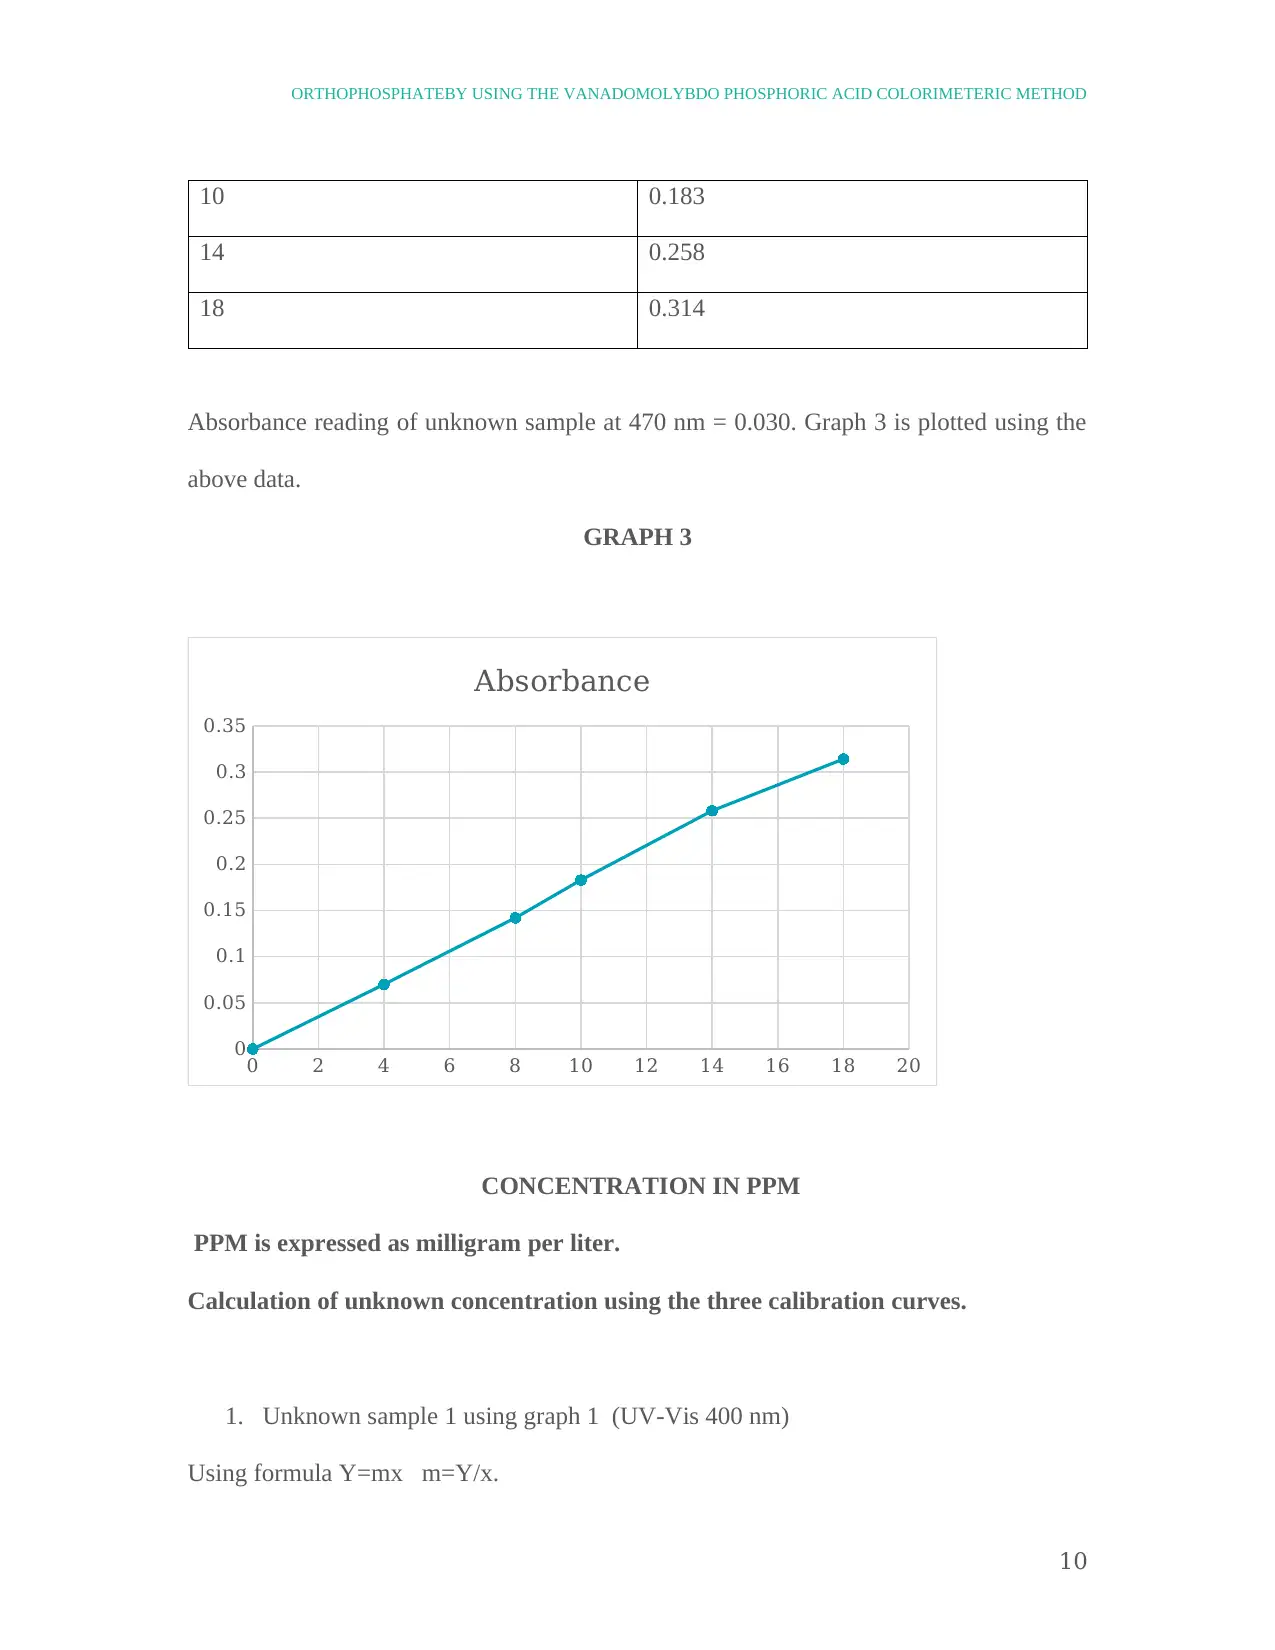
This practical assignment focuses on determining orthophosphate levels using the vanadomolybdophosphoric acid colorimetric method. The experiment involves creating a set of standards for calibration and measuring the absorption of solutions at specified wavelengths using a UV/Vis spectrophotometer. By applying Beer-Lambert Law, the concentration of phosphorus in a water solution is determined. The experiment explores the reaction between ammonium molybdate and orthophosphate in an acidic environment to form molybdophosphoric acid, with vanadium enhancing the yellow color intensity, which is directly proportional to the phosphate concentration. Calibration curves are generated from absorbance readings at different wavelengths (400 nm, 420 nm, and 470 nm) to determine the concentration of unknown samples. The results, presented in tables and graphs, demonstrate the relationship between concentration and absorbance, validating the Beer-Lambert Law. The document concludes by highlighting the learning outcomes, including the identification of spectrophotometer components, measurement of absorbance, application of Beer-Lambert Law, and the use of calibration curves for determining phosphorus concentration.

DETERMINATION OF ORTHOPHOSPHATE
BY USING THE VANADOMOLYBDO
PHOSPHORIC ACID COLORIMETERIC
METHOD
Name | Course Title | Date
ABSTRACT
BY USING THE VANADOMOLYBDO
PHOSPHORIC ACID COLORIMETERIC
METHOD
Name | Course Title | Date
ABSTRACT
Secure Best Marks with AI Grader
Need help grading? Try our AI Grader for instant feedback on your assignments.

ORTHOPHOSPHATEBY USING THE VANADOMOLYBDO PHOSPHORIC ACID COLORIMETERIC METHOD
In this experiment, the main purpose was to find out the absorbance versus the
concentration of samples placed in flasks with different concentrations of working
phosphate solution. After introducing the different concentrations of the sample into the
spectrophotometer, the results were recorded and analyzed. The concentration range used
was divided into three categories for three selected wavelengths and a calibration curve
was drawn. The study of spectrophotometry deals with the interaction of light with
matter. Chemical substances can be categorized by the specific emission or absorption of
light. In this experiment, the analytical methods based on the amount of light that is
transmitted or absorbed when it passes through a sample.. Based on this concept, the
phosphorus concentration in a water solution is determined. The developed method helps
to determine the phosphorus content in traces of water with reduced reagent
consumption, low waste production and high sensitivity. (NEVES et al., 2008)
OBJECTIVES
To identify the components and functions of different components of a UV / Vis
spectrophotometer
Preparation of a set of standards for calibration
Measurement of the absorption of solutions at the specified wavelength.
Application of Beer-Lambert Law to find out the concentration of a colored species in
solution.
To draw and make use of calibration curves to determine the concentration of
phosphorus in the analytical solution (Worsfold et al., 2016)
1

ORTHOPHOSPHATEBY USING THE VANADOMOLYBDO PHOSPHORIC ACID COLORIMETERIC METHOD
INTRODUCTION
Phosphorus is found in abundance as phosphate in natural water and wastewater. These
phosphorus is classified as, condensed phosphates (pyro-, meta- and other
polyphosphates) and orthophosphates and phosphates in the form of organic
compounds. They are found in many solutions in the dissolved form , in many particles
or detritus or in the aquatic organisms like fish etc.
These phosphates actually is found because they are coming from different sources.
Some water supplies are treated with small amounts of condensed phosphate during the
treatment. Because of these compounds are used in our washing and cleaning processes,
they contribute to the major share of the phosphorus found in water bodies like lakes,
rivers etc. Phosphates, which are used as fertilizers in irrigation lands are swept away by
storm water into surface waters and to a lesser extent with snow. Phosphates found in
organic materials are formed due to biological processes. .Because of that the sewage
water which contain waste of these organic organisms , food residues and from biological
treatment processes in the form of orthophosphates contribute to high phosphorus
percent.
Phosphorus is known to be the major nutrient needed for algae growth in inland
landscapes (Federation 2005). The accelerated eutrophication is one of the major
challenge of the nation's water bodies.. Eutrophication, caused by too many nutrients in
the water, can cause a number of water quality issues, including fish deaths, harmful
2

ORTHOPHOSPHATEBY USING THE VANADOMOLYBDO PHOSPHORIC ACID COLORIMETERIC METHOD
odors and odors, clogged piping, and limited recovery. In freshwater, phosphorus is
responsible for accelerated eutrophication. Many algal blooms in rivers and lakes are
attributed to increased phosphorus levels due to human activities. The reason for
phosphorus contamination in water bodies is because of waste water from agriculture,
industry and urban sewage treatment plants. (Adams, 2017)
There is no criteria in place regarding what should be the concentration of phosphorus
compounds in water, Anyway to arrest EPO and eutrophication, there are some
recommendations (Jastrzębska, 2009) followed in some countries listed below :
• The phosphates content should not cross 50 μg / l ( phosphorus) at the entry point of a
lake or reservoir.
• Total phosphorus in small waterways which do not flow into lakes or reservoirs should
not exceed 100 μg / l.
Municipal wastewater treatment plants are required to be established in more areas to
remove phosphorus in their treatment plants .Though biological treatment plants can
remove some quantum of phosphorus ,but phosphorus precipitation in the form of
insoluble metal phosphates is required to be treated in most cases to meet the discharge
requirements. (Grobbelaar, 2013)
The removal of insoluble phosphorus involves two steps: (a) conversion of insoluble
phosphorus to dissolved orthophosphate and (b) to determine quantum of dissolved
orthophosphates using calorimetric method. (Nagarkatti, 1991)
3
Secure Best Marks with AI Grader
Need help grading? Try our AI Grader for instant feedback on your assignments.

ORTHOPHOSPHATEBY USING THE VANADOMOLYBDO PHOSPHORIC ACID COLORIMETERIC METHOD
EXPERIMENT :
4
EXPERIMENT :
4

ORTHOPHOSPHATEBY USING THE VANADOMOLYBDO PHOSPHORIC ACID COLORIMETERIC METHOD
RESULTS AND DISCUSSIONS
Theory : The quantum of electro-magnetic radiation in our visible range of spectrum
absorbed by a coloured liquid in the form of solution is directly proportional to the
concentration of the coloured species and is defined by Beer-Lambert law, Absorbance
(A) = εcl (Lancashire, 2019) where ε is a constant and c is concentration of the
coloured liquid and l is the path length.
5

ORTHOPHOSPHATEBY USING THE VANADOMOLYBDO PHOSPHORIC ACID COLORIMETERIC METHOD
The intensity is measured using a spectrophotometer. If a light beam having intensity
I1 is focused on a sample and portion I2 is absorbed by the analyte , then the amount of
absorbed light is expressed as:
A = log (I1 / I2)
A plot of absorbance versus concentration gives a straight line the slope of which is the
molar absorptivity, ε * length.
Principle: Ammonium molybdate reacts in acidic environment In a dilute
orthophosphate solution, to form a heteropolyacid, molybdophosphoric acid .,
vanadomolybdophosphoric acidwhich is yellow in colour is formed In the presence of
vanadium. The intensity of the yellow color is directly proportional to the concentration
of phosphate.
Interference: Positive interference caused by heating of the sample by arsenate and
silica. Negative interference is caused by arsenate
The lowestdetectable concentration is 200 micrograms / PL in a 1 cm spectrometer cell.
("Determination of a Phosphate Calibration Curve through Colorimetric Analysis to
Determine the Concentration of an Unknown Solution", 2019)
Spectrometer at 400 to 490 nm
Concentration ranges for different wavelengths are
Table 1
6
Paraphrase This Document
Need a fresh take? Get an instant paraphrase of this document with our AI Paraphraser

ORTHOPHOSPHATEBY USING THE VANADOMOLYBDO PHOSPHORIC ACID COLORIMETERIC METHOD
P Range (mg/L) Wavelength (nm)
1 to 5 400
2 to 10 420
4 to 18 470
Mg P/L = [mg P (in 50 ml final volume ) * 1000]/mL sample
The concentration of the standard solution against absorbance for three different
wavelengths ( as mentioned above ) for standard solution and the unknown solution
obtained in the experiment is mentioned under table 2 table 3 and table 4.
Using known concentrations and their absorbance the graph is plotted with x-axis as
concentration and y axis as absorbance. It should be kept in mind that if the
concentrations obey the Lambert-Beer law, the plot will be a straight line. From the data
the graph is plotted with absorbance values as y axis and concentration as x axis . to
follow the straight line equation y=mx where y is the absorbance and x the corresponding
concentrations. From the plot obtained the slope m is found out.. Then the absorbance (y)
of the unknown concentration is used to find out the value of unknown concentration.
TABLE 2 using UV-Vis at 400 nm
Concentration ppm Absorbance
1 0.070
2 0.140
7

ORTHOPHOSPHATEBY USING THE VANADOMOLYBDO PHOSPHORIC ACID COLORIMETERIC METHOD
3 0.194
4 0.293
5 0.352
Absorbance reading of unknown sample at 400 nm = 0.044. Graph 1 is plotted using the
above data. Graph 1 is plotted against the above data. The graph passes through the
centre
GRAPH1
0 1 2 3 4 5 6
0
0.05
0.1
0.15
0.2
0.25
0.3
0.35
0.4
Absorbance
Concentration in ppm
TABLE 3 using UV-Vis at 420 nm
Concentration ppm Absorbance
2 0.089
4 0.188
6 0.292
8 0.390
8

ORTHOPHOSPHATEBY USING THE VANADOMOLYBDO PHOSPHORIC ACID COLORIMETERIC METHOD
10 0.499
Absorbance reading of unknown sample at 420 nm = 0.056. Graph 2 is plotted using the
above data.. Graph 2 is plotted using the above data.
GRAPH 2
0 2 4 6 8 10 12
0
0.1
0.2
0.3
0.4
0.5
0.6
absorbance
Concentration in ppm
TABLE 4 using UV-Vis at 720 nm
Concentration ppm Absorbance
4 0.070
8 0.142
9
Secure Best Marks with AI Grader
Need help grading? Try our AI Grader for instant feedback on your assignments.

ORTHOPHOSPHATEBY USING THE VANADOMOLYBDO PHOSPHORIC ACID COLORIMETERIC METHOD
10 0.183
14 0.258
18 0.314
Absorbance reading of unknown sample at 470 nm = 0.030. Graph 3 is plotted using the
above data.
GRAPH 3
0 2 4 6 8 10 12 14 16 18 20
0
0.05
0.1
0.15
0.2
0.25
0.3
0.35
Absorbance
CONCENTRATION IN PPM
PPM is expressed as milligram per liter.
Calculation of unknown concentration using the three calibration curves.
1. Unknown sample 1 using graph 1 (UV-Vis 400 nm)
Using formula Y=mx m=Y/x.
10

ORTHOPHOSPHATEBY USING THE VANADOMOLYBDO PHOSPHORIC ACID COLORIMETERIC METHOD
m = 0.07/1=0.07
unknown concentration = x=y/m = 0.044//0.07 =0.628 ppm
2. Unknown sample 2 using graph 2 (UV-Vis – 420 nm)
Using formula Y=mx m= Y/X
m= 0.3/6/ = 0.05
Unknown concentration = Y/m = 0.056 / 0.05 = 1.12 ppm
3. Unknown sample 3 using graph 3 (UV-Vis – 470 nm)
Using formula Y=mx m= Y/X
m= 0.18/10 = 0.018
Unknown concentration = Y/m = 0.030 / 0.18 = 0.166 ppm
Analysis of result: All the three calibration curves pass through the origin. It proves that
the experimental environment including reagents are in order.
The results given for the unknown concentrations were very close to the values that
would theoretically be expected; that is, the expected values for the concentrations based
on their absorbance make sense when plotted on the graph of the calibration curve. The
degree of margin of error though small may be because of the calculation of gradient and
also because of possible margin of error during creation of the sample for testing.
Learning points from this experiment :
11

ORTHOPHOSPHATEBY USING THE VANADOMOLYBDO PHOSPHORIC ACID COLORIMETERIC METHOD
a. We can identify the components and functions of different components of a UV /
Vis spectrophotometer . Use of spectrometer using different different
wavelengths.
b. We can measure absorbance at specific wavelength.
c. We can apply Beer-Lambert Law to find out the concentration of a coloured
species in solution both with solution with known concentration and solution with
unknown concentration.
d. We can draw the calibration curve using concentration as x axis and absorbance
as Y Axis. It is exciting that all the three calibration curves pass through origin.
e. We can calculate the gradient of the calibration curves.
f. We can apply formula to find out concentration of phosphorus of unknown
sample from the value of absorbance using the calibration curve.
1.
References
Adams, V. D. (2017). Water and wastewater examination manual. Routledge
Determine the Concentration of an Unknown Solution. (2019). Retrieved from
https://www.theodysseyonline.com/determination-phosphate-calibration-curve-
colorimetric-analysis
Federation, W. E., & American Public Health Association. (2005). Standard methods for
the examination of water and wastewater. American Public Health Association
(APHA): Washington, DC, USA.
Grobbelaar, J. U. (2013). Inorganic algal nutrition. In Handbook of Microalgal
Culture (pp. 123-133) . Oxford: John Wiley & Sons.
12
Paraphrase This Document
Need a fresh take? Get an instant paraphrase of this document with our AI Paraphraser

ORTHOPHOSPHATEBY USING THE VANADOMOLYBDO PHOSPHORIC ACID COLORIMETERIC METHOD
Jastrzębska, A. (2009). Modifications of spectrophotometric methods for total
phosphorus
determination in meat samples. Chemical Papers, 63(1), 47-54.
Lancashire, P. (2019). Colourimetric determination of phosphate. Retrieved from
http://wwwchem.uwimona.edu.jm/lab_manuals/c10expt36.html
Nagarkatti, M. (1991). Water & Wastewater Examination Manual. Journal Of
Environment Quality, 20(4), 882. doi:
10.2134/jeq1991.00472425002000040041x
NEVES, M., SOUTO, M., TOTH, I., VICTAL, S., DRUMOND, M., & RANGEL, A.(2008)
Spectrophotometric flow system using vanadomolybdophosphate detection
chemistry and a liquid waveguide capillary cell for the determination of
phosphate with improved sensitivity in surface and ground water
samples. Talanta, 77(2), 527-532. doi: 10.1016/j.talanta.2008.03.014
Worsfold, P., McKelvie, I., & Monbet, P. (2016). Determination of phosphorus in natural
waters: a historical review. Analytica chimica acta, 918, 8-20.
.
13
1 out of 14
Related Documents

Your All-in-One AI-Powered Toolkit for Academic Success.
+13062052269
info@desklib.com
Available 24*7 on WhatsApp / Email
Unlock your academic potential
© 2024 | Zucol Services PVT LTD | All rights reserved.