OS Practical Exercises

Verified

Added on  2019/09/18

|3
|604
|230
Practical Assignment
AI Summary
This practical assignment involves a series of exercises using the Windows Task Manager to observe and analyze system processes and performance. Students start by launching multiple applications, observing their behavior using the Task Manager's 'Switch To' and 'End Task' functions. They then identify processes consuming the most CPU time and analyze the impact of a runaway process (an infinite loop in a C program) on CPU usage. The assignment also explores the Performance tab, examining CPU, physical memory, and kernel memory usage, including the effects of launching multiple instances of an application. Finally, students explore different applications, noting their CPU and memory usage and tabulating their observations. The assignment aims to provide hands-on experience with process management and system performance monitoring within the Windows operating system.
Document Page
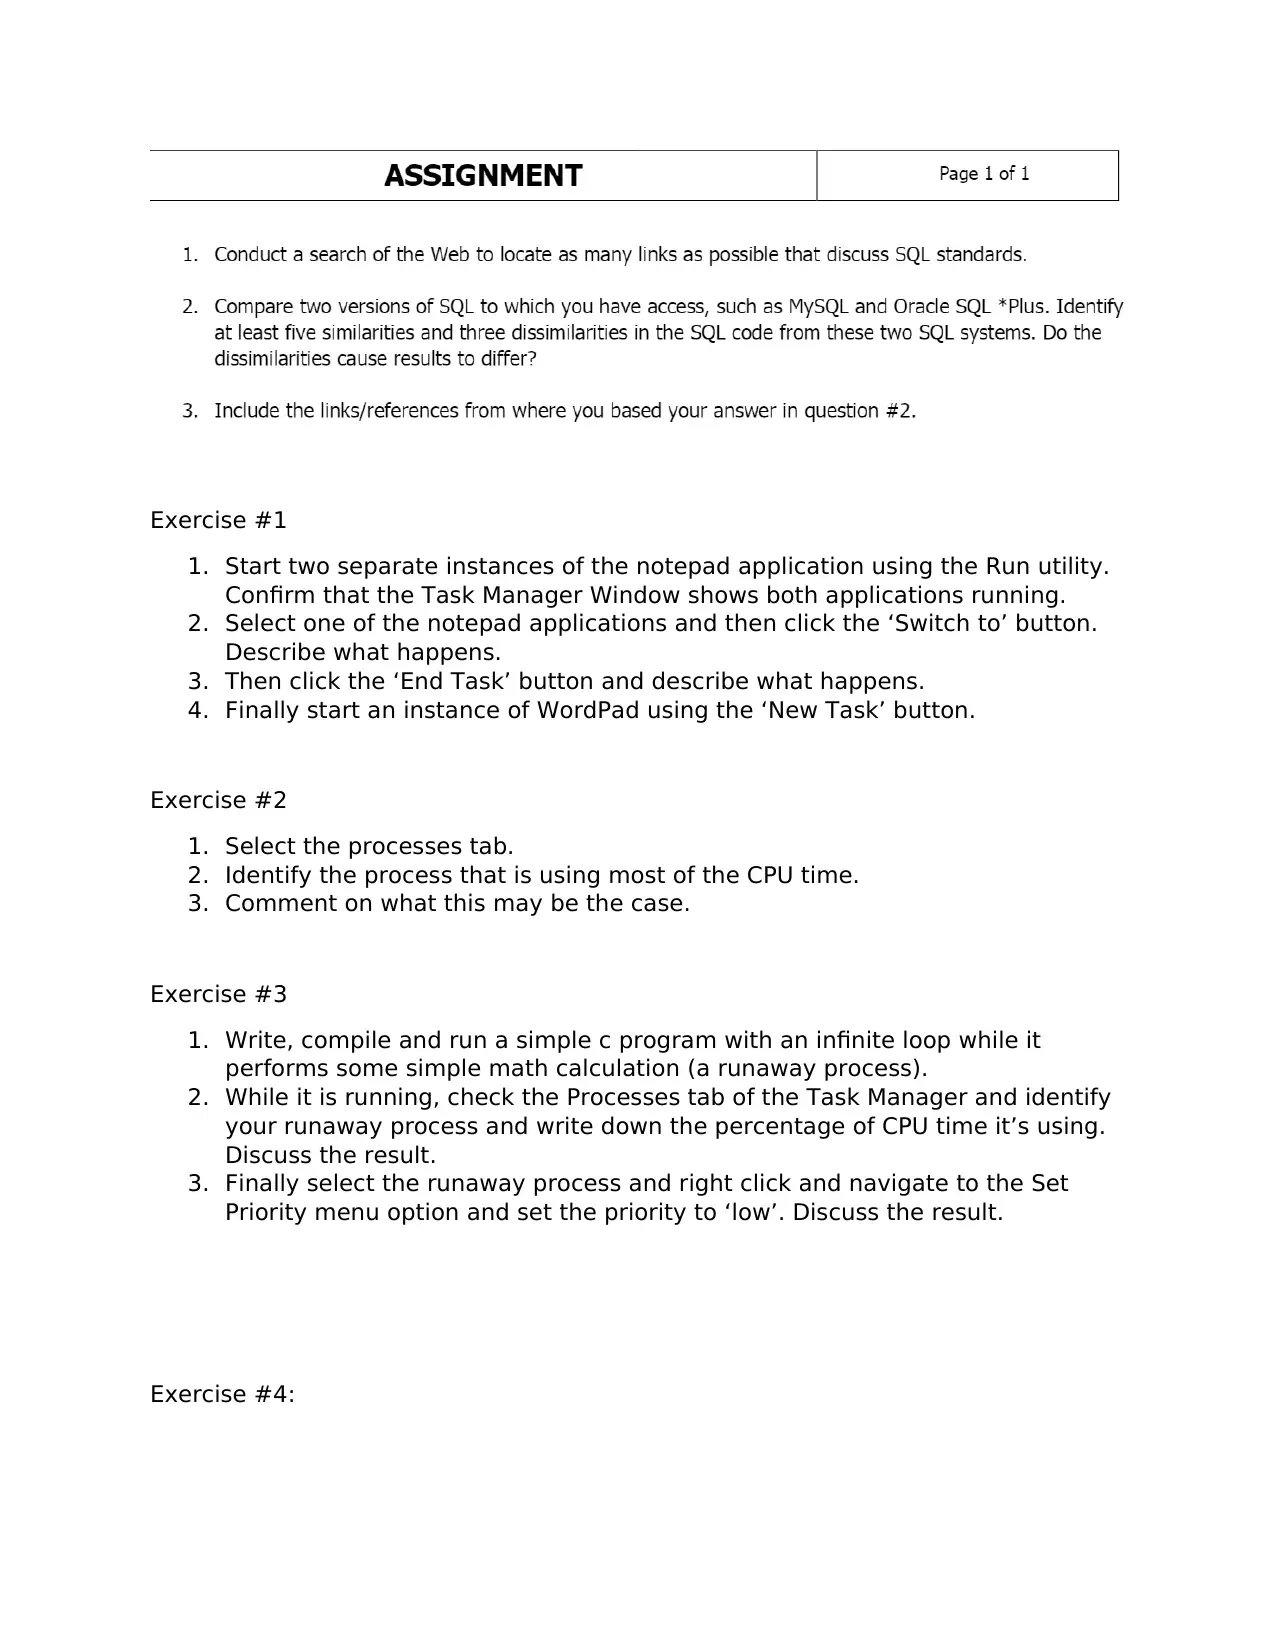
Exercise #1
1. Start two separate instances of the notepad application using the Run utility.
Confirm that the Task Manager Window shows both applications running.
2. Select one of the notepad applications and then click the ‘Switch to’ button.
Describe what happens.
3. Then click the ‘End Task’ button and describe what happens.
4. Finally start an instance of WordPad using the ‘New Task’ button.
Exercise #2
1. Select the processes tab.
2. Identify the process that is using most of the CPU time.
3. Comment on what this may be the case.
Exercise #3
1. Write, compile and run a simple c program with an infinite loop while it
performs some simple math calculation (a runaway process).
2. While it is running, check the Processes tab of the Task Manager and identify
your runaway process and write down the percentage of CPU time it’s using.
Discuss the result.
3. Finally select the runaway process and right click and navigate to the Set
Priority menu option and set the priority to ‘low’. Discuss the result.
Exercise #4:
tabler-icon-diamond-filled.svg

Paraphrase This Document

Need a fresh take? Get an instant paraphrase of this document with our AI Paraphraser
Document Page
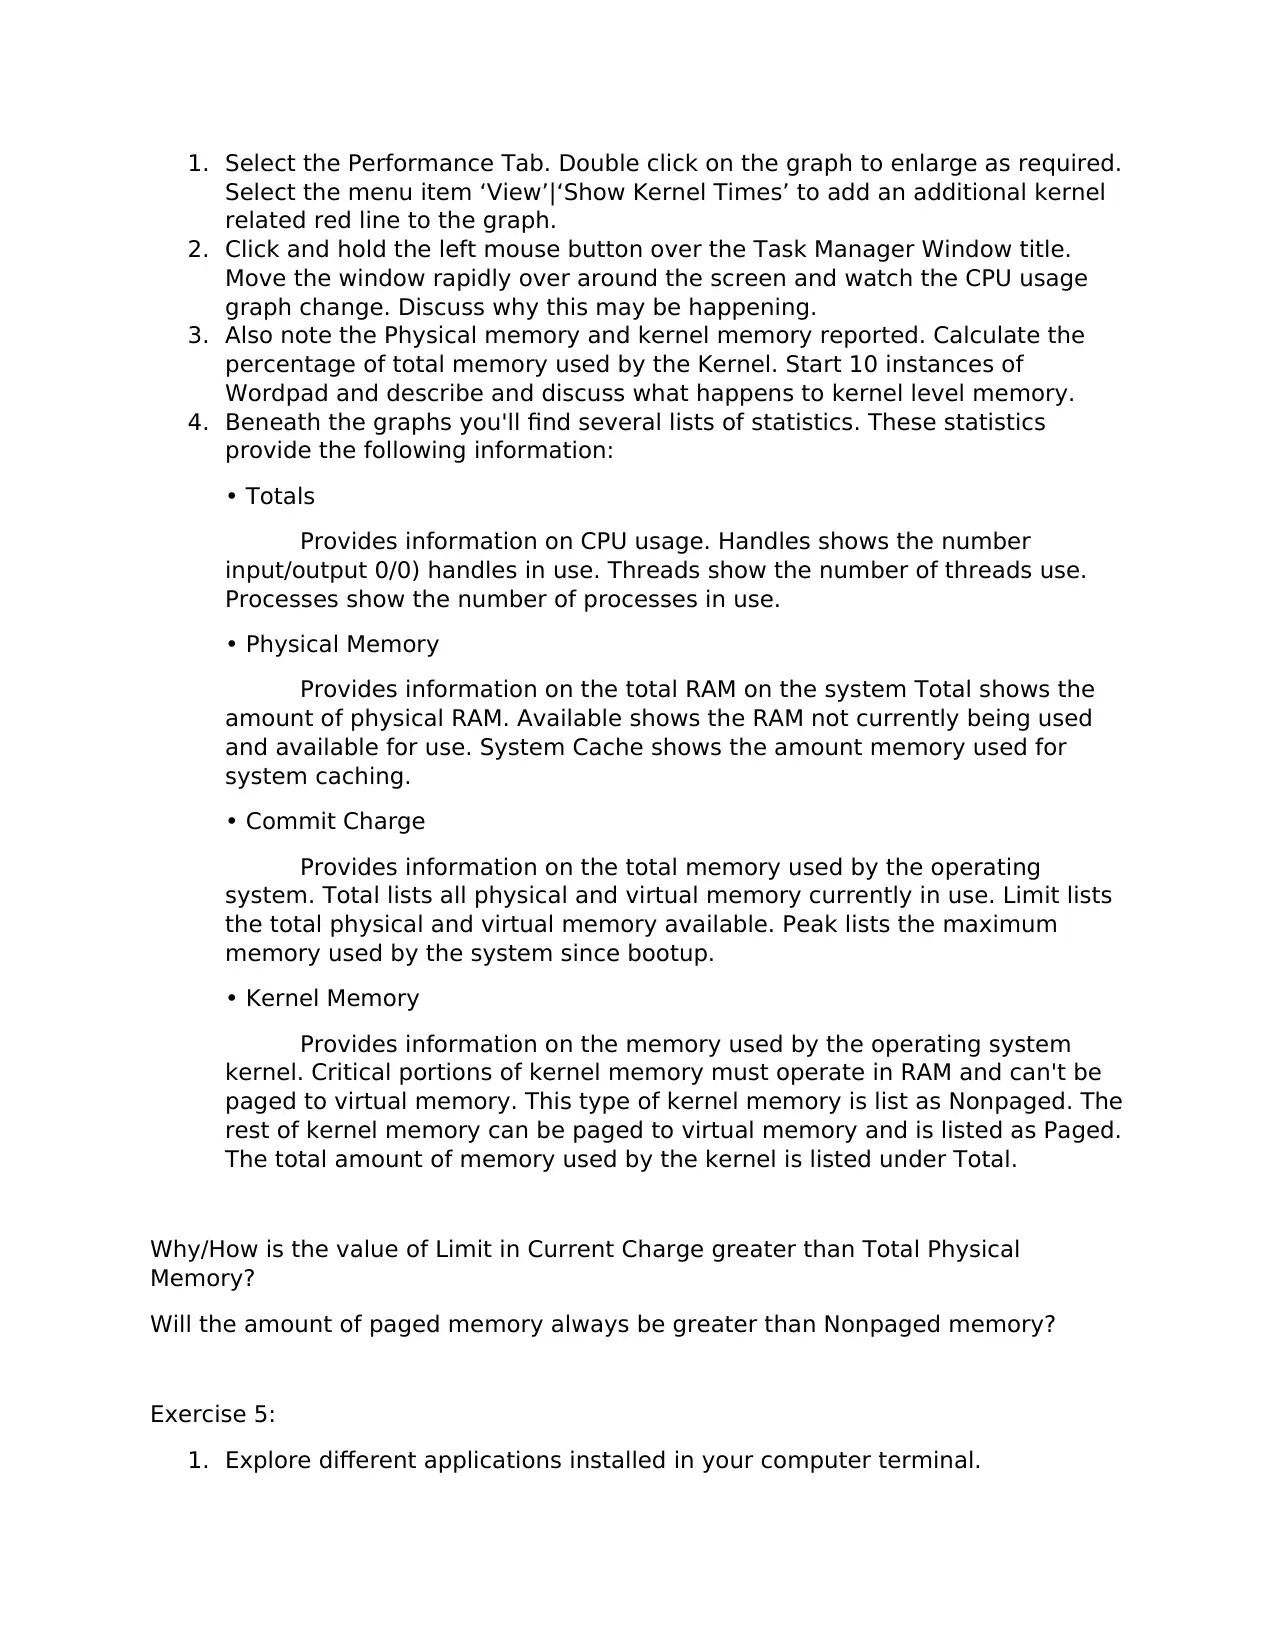
1. Select the Performance Tab. Double click on the graph to enlarge as required.
Select the menu item ‘View’|‘Show Kernel Times’ to add an additional kernel
related red line to the graph.
2. Click and hold the left mouse button over the Task Manager Window title.
Move the window rapidly over around the screen and watch the CPU usage
graph change. Discuss why this may be happening.
3. Also note the Physical memory and kernel memory reported. Calculate the
percentage of total memory used by the Kernel. Start 10 instances of
Wordpad and describe and discuss what happens to kernel level memory.
4. Beneath the graphs you'll find several lists of statistics. These statistics
provide the following information:
• Totals
Provides information on CPU usage. Handles shows the number
input/output 0/0) handles in use. Threads show the number of threads use.
Processes show the number of processes in use.
• Physical Memory
Provides information on the total RAM on the system Total shows the
amount of physical RAM. Available shows the RAM not currently being used
and available for use. System Cache shows the amount memory used for
system caching.
• Commit Charge
Provides information on the total memory used by the operating
system. Total lists all physical and virtual memory currently in use. Limit lists
the total physical and virtual memory available. Peak lists the maximum
memory used by the system since bootup.
• Kernel Memory
Provides information on the memory used by the operating system
kernel. Critical portions of kernel memory must operate in RAM and can't be
paged to virtual memory. This type of kernel memory is list as Nonpaged. The
rest of kernel memory can be paged to virtual memory and is listed as Paged.
The total amount of memory used by the kernel is listed under Total.
Why/How is the value of Limit in Current Charge greater than Total Physical
Memory?
Will the amount of paged memory always be greater than Nonpaged memory?
Exercise 5:
1. Explore different applications installed in your computer terminal.
Document Page
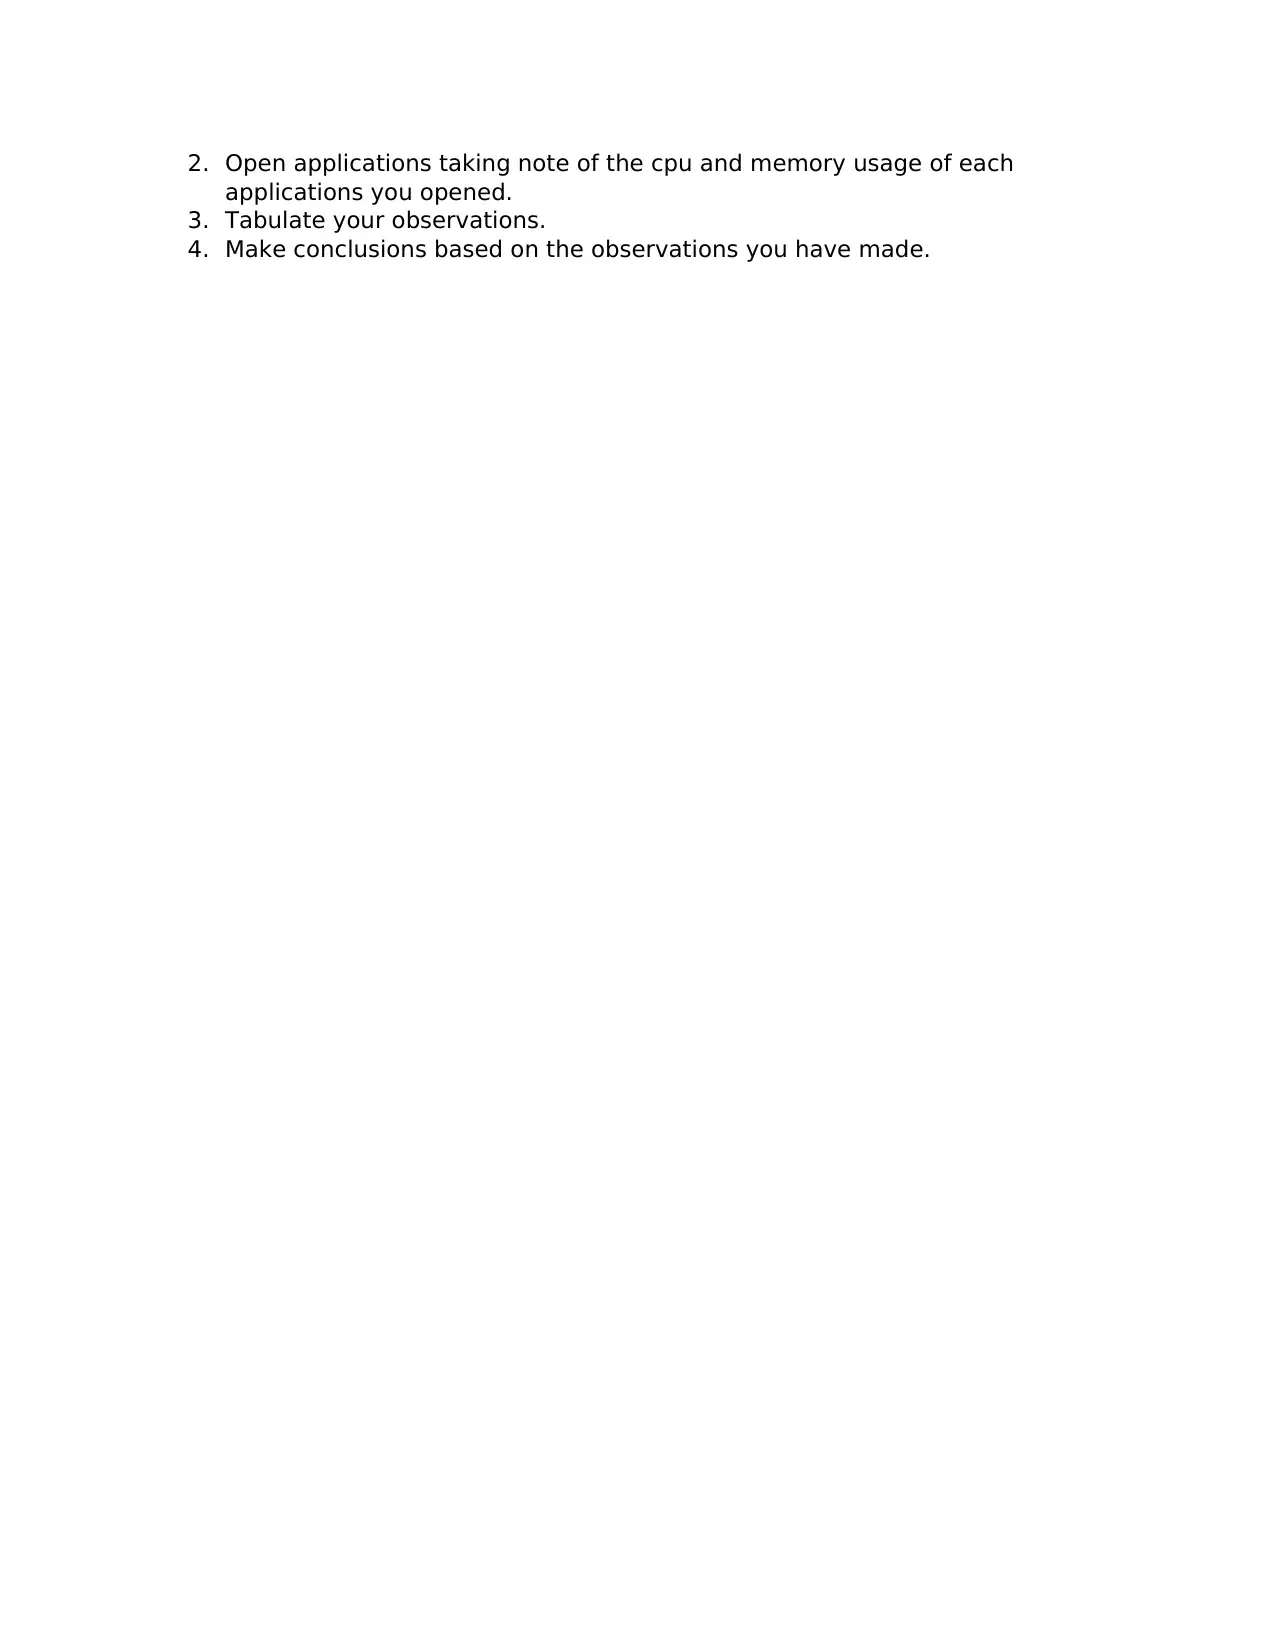
2. Open applications taking note of the cpu and memory usage of each
applications you opened.
3. Tabulate your observations.
4. Make conclusions based on the observations you have made.
chevron_up_icon
1 out of 3
circle_padding
hide_on_mobile
zoom_out_icon
[object Object]