Operations & Technology Management: OTMA01-8 NQF 8 Report
VerifiedAdded on 2023/06/10
|11
|2794
|329
Report
AI Summary
This report delves into operations and technology management, emphasizing competitive decision priorities such as cost, time, quality, and flexibility. It analyzes core processes, including supplier relationships, service design, order fulfillment, and customer relationship management, to achieve competitive advantage. The report also covers long-term capacity planning, measures of capacity, economies of scale, and timing strategies. It further examines forecasting models like simple and weighted moving averages, and error measurements such as MAD, MSE, and MAPE. A decision tree analysis is used to evaluate options in food and beverage manufacturing. The document discusses the importance of aligning capacity with demand and strategically planning for capacity changes, considering both increases and decreases in demand to enhance overall operational efficiency.
Operations and technology management 1
Operations and Technology management
By[Name]
Course
Professor’s Name
Institution
Location of Institution
Date
Operations and Technology management
By[Name]
Course
Professor’s Name
Institution
Location of Institution
Date
Paraphrase This Document
Need a fresh take? Get an instant paraphrase of this document with our AI Paraphraser
Operations and technology management 2
Table of Contents
Introduction....................................................................................................................................3
Competitive Decision priorities....................................................................................................3
Cost..............................................................................................................................................3
Time..............................................................................................................................................3
Quality..........................................................................................................................................4
Flexibility.....................................................................................................................................4
Core processes................................................................................................................................4
Supplier relationships..................................................................................................................4
Service design..............................................................................................................................5
Order fulfilment............................................................................................................................5
Customer relationship..................................................................................................................5
Operation manager........................................................................................................................6
Long term capacity planning process..........................................................................................6
Measures of capacity...................................................................................................................6
Economies of scales.....................................................................................................................7
Timing and sizing strategies........................................................................................................7
The systematic approach..............................................................................................................7
Tools for capacity planning.........................................................................................................7
Forecasting models and technologies...........................................................................................8
The simple moving average..........................................................................................................8
The weighted moving average......................................................................................................8
Mean Absolute Deviation (MAD)................................................................................................9
Mean Square Error (MSE)...........................................................................................................9
Mean Absolute Percentage Error (MAPE)..................................................................................9
Conclusion....................................................................................................................................10
References.....................................................................................................................................10
Operations and technology management 3
Introduction
In the manufacturing industries, operations and technology management is a factor of main
focus. Technology comes around in many forms, including information, enterprise system,
internal and outsourced infrastructure. Given the rapid nature of change of technology, research
is being done to ensure all the operations carried out are well managed. Success in most business
comes as a result of competition and its measure needs a detailed analysis (Bakker, 1962 pp200-
281) and for one to make a better move, decisions based on cost, time quality and flexibility
must be given a priority, (Voss, C., 2010).
Competitive Decision priorities
1.1 Analyse the process considerations linked to each of the competitive decisions that could
be made for each priority. (15)
Cost
Pricing of products can be confusing and may lead to more doubts in a business if not well
considered. While in between a challenge of not charging less that the product’s worth, the
decision maker is also tasked with the duty of considering not to price oneself out of the market.
Considering the cost of running the business, the most common is the direct cost which is
monthly based which you can avoid and the direct cost for instance the production and delivery
costs, (Voss, C., 2010). The customers around you really add to cost management, do they need
cheap products or is it the quality that they need. Once you understand their demands, this can
also be a factor to position your business in terms of standards whether if you’re a luxurious
entrepreneur or a high end in the industry and finally the profit which you are capable of making
within a given time.
Time
Any profit making business considers time as a main factor which if well managed can yields
more and more profits and can be used to achieve and maintain a well sustainable competitive
advantage. Arriving at the market on time and producing in time brings a different between two
competing companies, where the company whose products lies over fifty percent the budget and
introduced to the market on market is at a higher advantage of making much more profits
compared to the firm that arrive at the market at a later period even though the products were
ready on time. Record keeping should also be done on time to aid the production process since
⊘ This is a preview!⊘
Do you want full access?
Subscribe today to unlock all pages.
Trusted by 1+ million students worldwide
Operations and technology management 4
most of the paperwork do consume a lot of time which could have otherwise be utilized in the
main manufacturing process, (Voss, C., 2010).
Quality
Law enforcement helps in ensuring a healthy competition within some businesses, investigations
done are solely aimed at checking the levels of quality of products in the market to protect the
consumers from exploitation. Other than the prices of the product, quality matters a lot, for
instance, a situation where few firm are producing similar products, the authority governing the
production may be force to ensure that the quality standards are met for the betterment of the
services being provided.
Flexibility
The firms are considered flexible if any change that comes along the production line can be
easily accommodated. For instance, a change in the material quality should not bring the
business down to a standstill. This implies that any successful company that wishes to lead in
any other competition should cope with and change regarding the quality of the material being
used and should be able to maintain or make a slight change in the output produced. New and
existing products should not bring a negative impact on the firm’s operation if a change is felt.
Core processes
1.2 Construct a plan to detail the priorities and develop the core processes with regards to
supplier relationships, service design, order fulfilment and customer relationship.
For a business to achieve its most competitive advantage in the business environments, plans
need to made earlier to ensure all other factors are well taken care off. Other than the internal
business management, there are other factors that are outside the scope of the business but must
be considers for one’s success. A long time framework allows the managers to consider the
competition as a more useful comparison other than it being a battle or a conflict. As a result of
this competition, there arises some other important stakeholders that need to be well address to
ensure healthy competition.
Paraphrase This Document
Need a fresh take? Get an instant paraphrase of this document with our AI Paraphraser
Operations and technology management 5
Supplier relationships
Suppliers plays an important role in the production circle since they provide the necessary raw
materials for the firms. Strategic approach should be implemented where the firm builds a
relation with the supplier long before the actual term of operation agreement is signed by both
parties. At early stage, the approach will build a relationship that assures prosperity. Making a
long term integral relationship with the suppliers, any firm will deserve a global reputation hence
being a leader in the business operation, (Voss, C., 2010).
Service design
Design of any product determines its success in any competition. Early stages of the new product
may seem to boom in market but at a later stage, competition increases as similar products arise.
To ensure the top lead is maintained the company is force to make some alteration in the design
to bring out the difference. Consumers will always wish to get the best in the market, to grasp the
attention of every consumer the company if forced to design its products in a manner that it
appears better among the competing similar products and this will ensure a lead in the competing
market. The company design team should be on watch to ensure their product s are always the
best in design in the market.
Order fulfilment
Faster order fulfilment yields benefits beyond the normal payoffs. More orders free up space in
the stores and this calls for more inputs to be added. Once a firm has learned on how best it can
deliver the orders, then much more profit is realized since there will be constant flow of stock
within and this will lead to making more sales.
Customer relationship.
Most business fail not because they lack the skills to manage but due to missing out on the
customer relationship. Customers plays an important role in consuming the product if the firm,
an as a result good relationship should be made. Firm should value their customers first; this is
achieved through creating an identity. Once a customer is given an identity, he or she feels
appreciated being given the membership card which will assure them of the best services being
offered. Any complain made should be taken in a positive manner and given an appropriate
response. And at times thanking them as well as welcoming them back for more and more.
Operations and technology management 6
2.1 Calculate the multifactor productivity ratio for the basic course (5)
Multifactor productivity ratio
Music lesson= R150 per hour
Corporate sponsor=R100 per hour
Total income=R (150+100) = R250 per hour
Total students 50
Total per class= (250*3*50) =R37,500
Input=R 25000 + R 4000+ R(20*50)=30,000
Ratio=37500/30000=1.25
Operation manager
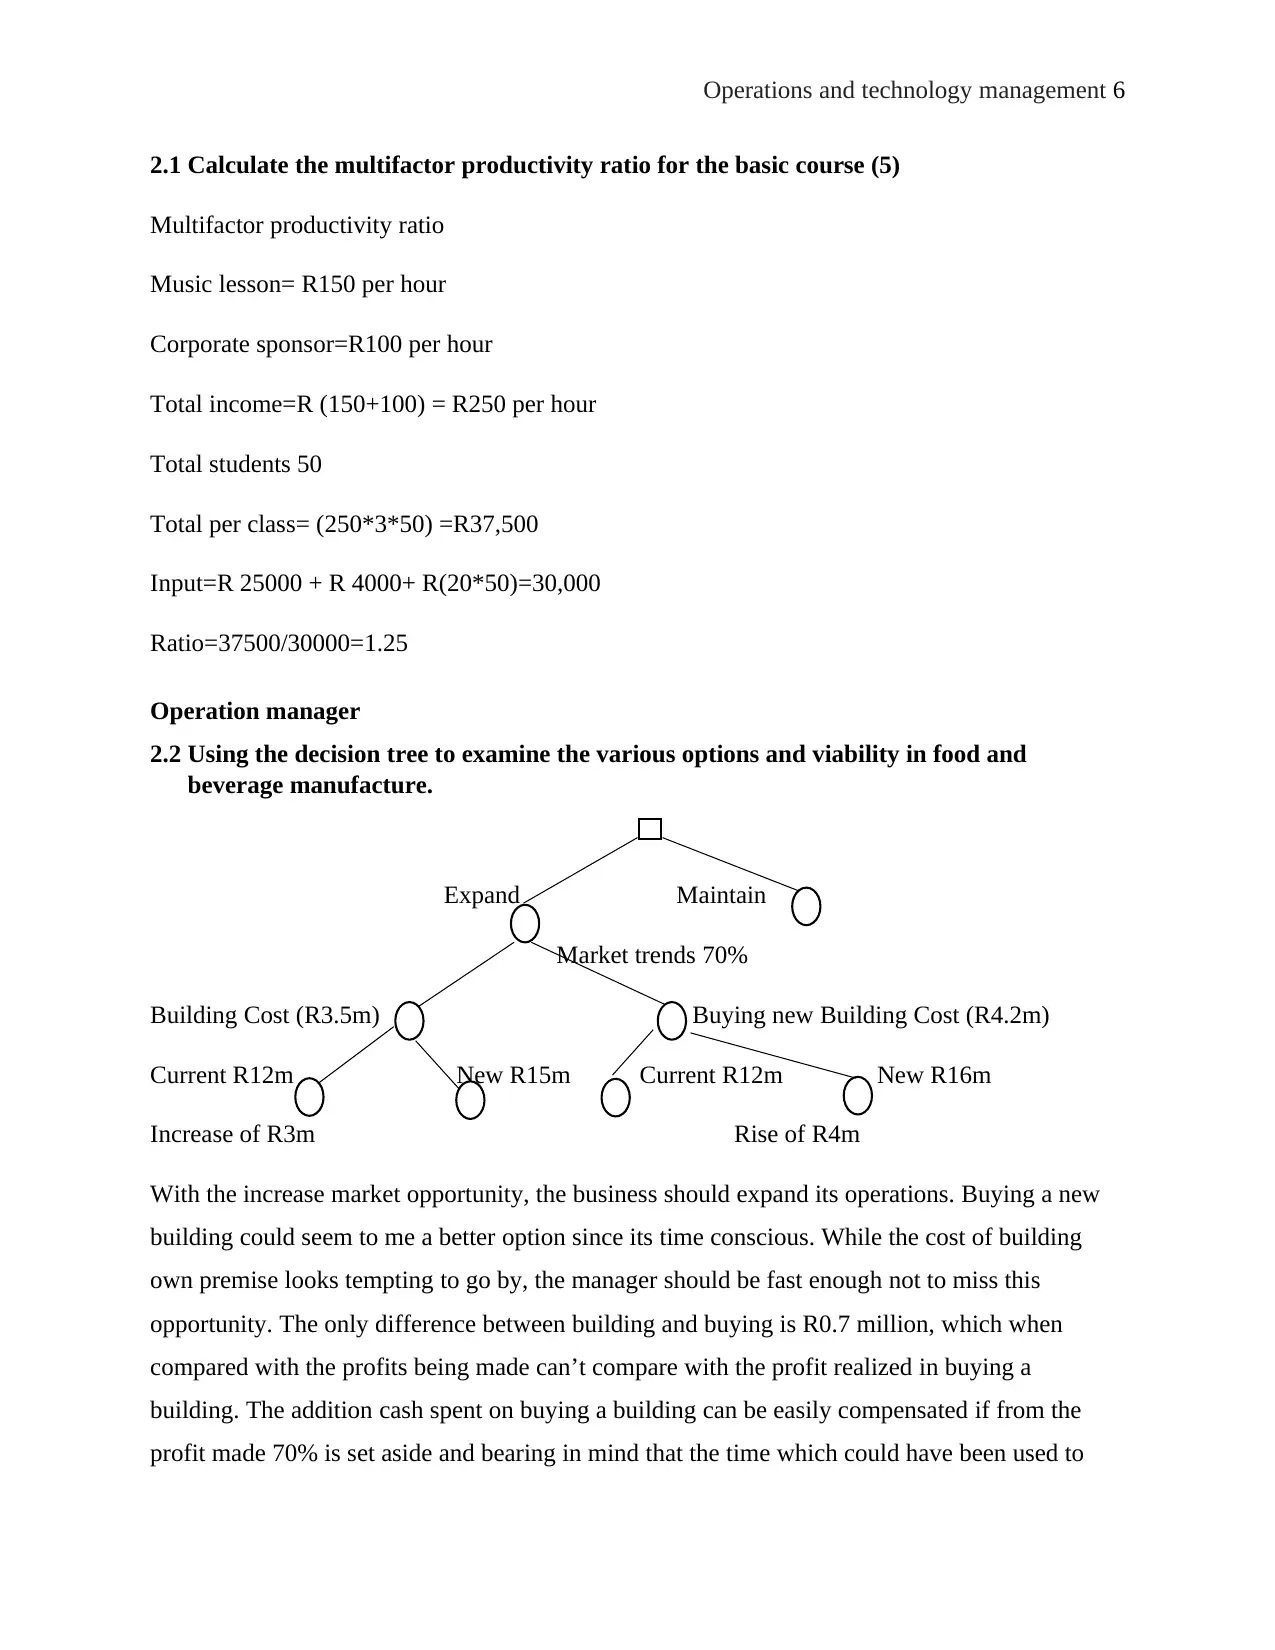
2.2 Using the decision tree to examine the various options and viability in food and
beverage manufacture.
Expand Maintain
Market trends 70%
Building Cost (R3.5m) Buying new Building Cost (R4.2m)
Current R12m New R15m Current R12m New R16m
Increase of R3m Rise of R4m
With the increase market opportunity, the business should expand its operations. Buying a new
building could seem to me a better option since its time conscious. While the cost of building
own premise looks tempting to go by, the manager should be fast enough not to miss this
opportunity. The only difference between building and buying is R0.7 million, which when
compared with the profits being made can’t compare with the profit realized in buying a
building. The addition cash spent on buying a building can be easily compensated if from the
profit made 70% is set aside and bearing in mind that the time which could have been used to
2.1 Calculate the multifactor productivity ratio for the basic course (5)
Multifactor productivity ratio
Music lesson= R150 per hour
Corporate sponsor=R100 per hour
Total income=R (150+100) = R250 per hour
Total students 50
Total per class= (250*3*50) =R37,500
Input=R 25000 + R 4000+ R(20*50)=30,000
Ratio=37500/30000=1.25
Operation manager
2.2 Using the decision tree to examine the various options and viability in food and
beverage manufacture.
Expand Maintain
Market trends 70%
Building Cost (R3.5m) Buying new Building Cost (R4.2m)
Current R12m New R15m Current R12m New R16m
Increase of R3m Rise of R4m
With the increase market opportunity, the business should expand its operations. Buying a new
building could seem to me a better option since its time conscious. While the cost of building
own premise looks tempting to go by, the manager should be fast enough not to miss this
opportunity. The only difference between building and buying is R0.7 million, which when
compared with the profits being made can’t compare with the profit realized in buying a
building. The addition cash spent on buying a building can be easily compensated if from the
profit made 70% is set aside and bearing in mind that the time which could have been used to
⊘ This is a preview!⊘
Do you want full access?
Subscribe today to unlock all pages.
Trusted by 1+ million students worldwide
Operations and technology management 7
build a new building has been utilized for the business operation, (Fitzsimmons, J.A., Fitzsimmons,
M.J. and Bordoloi, S., 2008).
Construct a long-term capacity planning process for DSF according to the rubric given:
Long term capacity planning process
Capacity is the maximum rate at which a production system or transformation produces from the
inputs processed. Planning plays an important role especially in terms of capacity since it
determines how much capacity is needed for the firm to manufacture higher products or rather
greater levels or otherwise begin producing new products in the market. However, the excess
capacity can be in most cases costly and unnecessary. Location decisions relates more with the
long term capacity planning. Implications to the manufacturing strategy on competition either
through the cost, speed of delivery and the firm’s flexibility depends on the long term capacity
planning.
Measures of capacity
Demand of the products against the supply should always be hand on hand. Before any other
decision being made, capacity should be strategically considered as the first option to begin with
in the whole process of decision making. Due to the increasing demands, capacity is added in
anticipation. On the other hand, demands also can fall below the desired level and this calls for
the measure both in regards to the rise or fall in demand. Even though the companies are fading
off, the demand for the Delta Synthetic Fibres should be measured in order to limit the level of
capacity being managed. The personnel employed were far much more than the required since
the fall in the companies brought about a large number of unemployment.
Economies of scales
From the reading, the firm can easily implement an economy of scale via the production process.
This can be realized through the cheaper capital being used in the conversion of Britlene to
Britlon which appears to be the most efficient way of production. Purchasing the raw material in
bulk also provides an arena where the company makes extra profits by utilizing the resources
within the control. Unlike purchasing direct for production purpose without considering other
surplus.
Paraphrase This Document
Need a fresh take? Get an instant paraphrase of this document with our AI Paraphraser
Operations and technology management 8
Timing and sizing strategies
Considering scales becomes a problem in sizing the company. The forecasted demand for
capacity and the supply of the capacity required great timing. Demand patterns could be
increasing or decreasing and this should be taken care of, from the Britlene production, it’s clear
that its timing could work best if it was introduced at a later time after the best times for the
Briton facilities had been realized, (Fitzsimmons, J.A., Fitzsimmons, M.J. and Bordoloi, S., 2008). The
forecast clearly shows that Britlene is at its best time even though the curve keeps lowering
down, a steady drop in demand is realized while Briton best timing will be later in the years, a
significant effect will be felt.
The systematic approach
Step by step approach to any new production style should be considered. As said by the Chief
Executive Officer, new company sites would come with an advantage to the clients. Shifting
members to other newly developed sites would sound human rather than a closure which will
render most of the man power jobless and will appear a great loss of resources.
Tools for capacity planning
The current performance monitor shows that the Britlene takes the higher percentage in the
market operation. Related data to the is used to keep trends of the progress in the Fibres.
Conversion tools from the Britlene plan would allow the production of the Britlon in the firm
which would at a higher percentage yield more promising results.
2.1 Comparisons of the forecasts of 2018 to 2021, and explaining the difference with the
already forecasted (10).
Forecasting models and technologies
Forecasting can be either qualitative or quantitative, while the qualitative are based on the
opinions of the experts and consumers, the quantitative on the other side uses the data as a
function of the past data. From this example given the quantitative for to forecasting techniques
takes position while analyzing the DSF made on the Britlene since the year.
Operations and technology management 9
2.2 Calculate the forecast error on Britlene by calculating the MAD, MSE and MAPE. And
also the tracking signal of the end of 2021 judging the performance of the forecast method
(10).
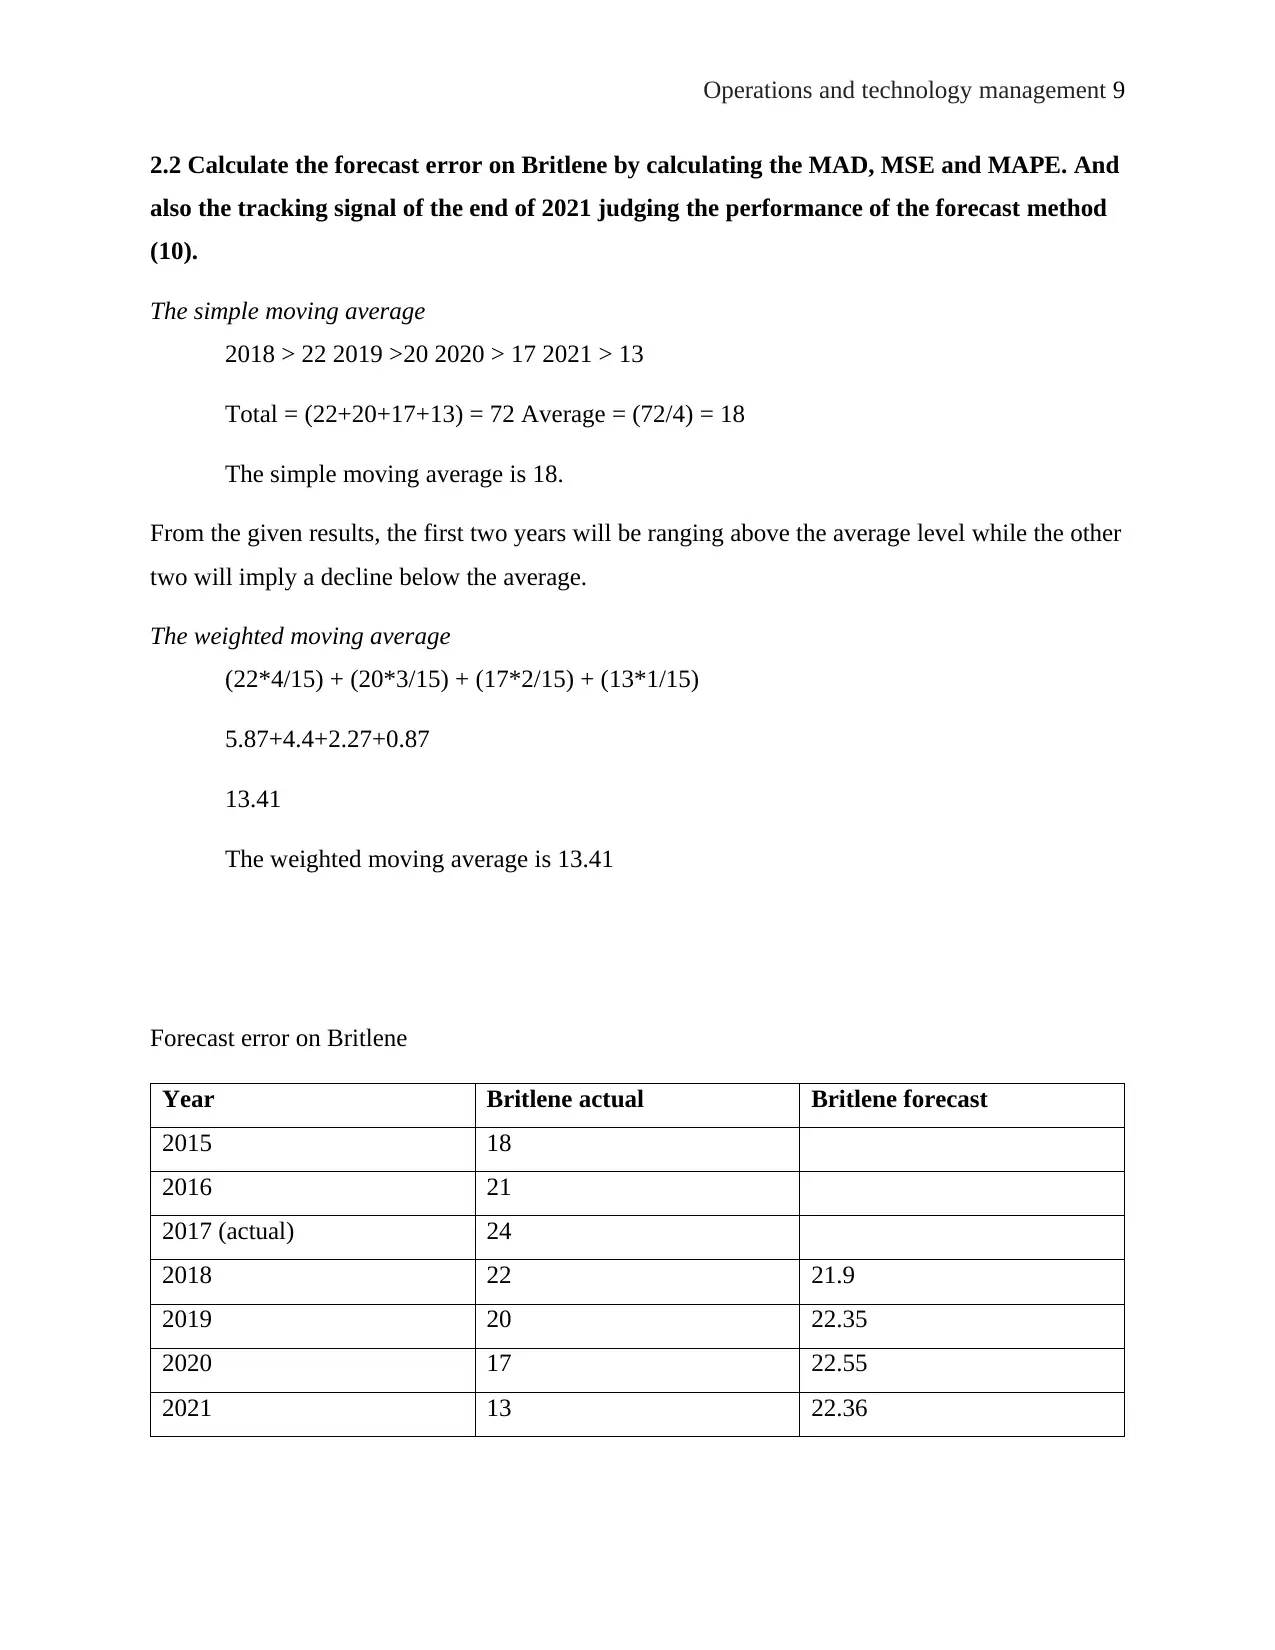
The simple moving average
2018 > 22 2019 >20 2020 > 17 2021 > 13
Total = (22+20+17+13) = 72 Average = (72/4) = 18
The simple moving average is 18.
From the given results, the first two years will be ranging above the average level while the other
two will imply a decline below the average.
The weighted moving average
(22*4/15) + (20*3/15) + (17*2/15) + (13*1/15)
5.87+4.4+2.27+0.87
13.41
The weighted moving average is 13.41
Forecast error on Britlene
Year Britlene actual Britlene forecast
2015 18
2016 21
2017 (actual) 24
2018 22 21.9
2019 20 22.35
2020 17 22.55
2021 13 22.36
2.2 Calculate the forecast error on Britlene by calculating the MAD, MSE and MAPE. And
also the tracking signal of the end of 2021 judging the performance of the forecast method
(10).
The simple moving average
2018 > 22 2019 >20 2020 > 17 2021 > 13
Total = (22+20+17+13) = 72 Average = (72/4) = 18
The simple moving average is 18.
From the given results, the first two years will be ranging above the average level while the other
two will imply a decline below the average.
The weighted moving average
(22*4/15) + (20*3/15) + (17*2/15) + (13*1/15)
5.87+4.4+2.27+0.87
13.41
The weighted moving average is 13.41
Forecast error on Britlene
Year Britlene actual Britlene forecast
2015 18
2016 21
2017 (actual) 24
2018 22 21.9
2019 20 22.35
2020 17 22.55
2021 13 22.36
⊘ This is a preview!⊘
Do you want full access?
Subscribe today to unlock all pages.
Trusted by 1+ million students worldwide
Operations and technology management 10
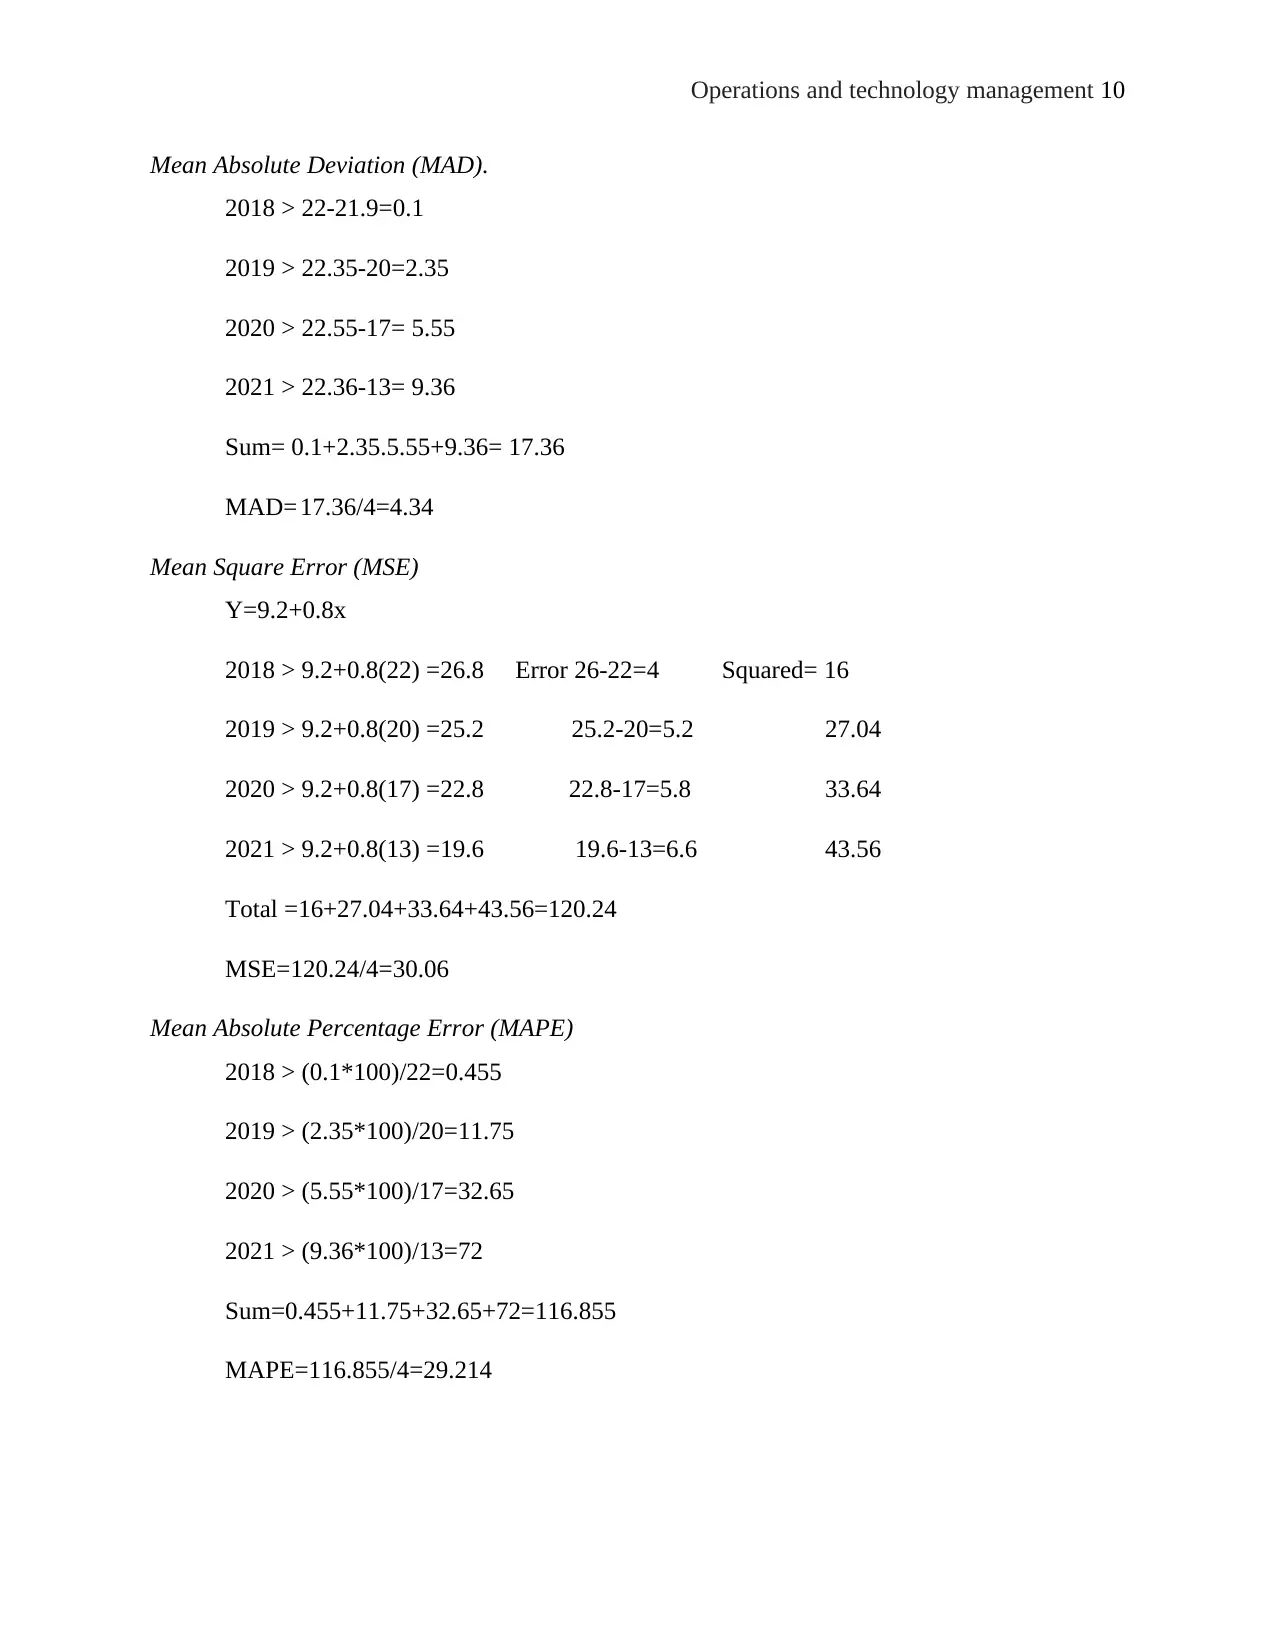
Mean Absolute Deviation (MAD).
2018 > 22-21.9=0.1
2019 > 22.35-20=2.35
2020 > 22.55-17= 5.55
2021 > 22.36-13= 9.36
Sum= 0.1+2.35.5.55+9.36= 17.36
MAD= 17.36/4=4.34
Mean Square Error (MSE)
Y=9.2+0.8x
2018 > 9.2+0.8(22) =26.8 Error 26-22=4 Squared= 16
2019 > 9.2+0.8(20) =25.2 25.2-20=5.2 27.04
2020 > 9.2+0.8(17) =22.8 22.8-17=5.8 33.64
2021 > 9.2+0.8(13) =19.6 19.6-13=6.6 43.56
Total =16+27.04+33.64+43.56=120.24
MSE=120.24/4=30.06
Mean Absolute Percentage Error (MAPE)
2018 > (0.1*100)/22=0.455
2019 > (2.35*100)/20=11.75
2020 > (5.55*100)/17=32.65
2021 > (9.36*100)/13=72
Sum=0.455+11.75+32.65+72=116.855
MAPE=116.855/4=29.214
Paraphrase This Document
Need a fresh take? Get an instant paraphrase of this document with our AI Paraphraser
Operations and technology management 11
Conclusion
From the results obtained, the forecast can clearly portray the real outcome if all the other factors
are kept constant. Operation management being a key role factor in all other organizations, the
Britlene production company needs to embark more on the management part so as to maximize
profile while minimizing cost of production.
References
Fitzsimmons, J.A., Fitzsimmons, M.J. and Bordoloi, S., 2008. Service management: Operations, strategy,
and information technology (p. 4). New York, NY: McGraw-Hill.
Voss, C., 2010. Case research in operations management. In Researching operations management (pp.
176-209). Routledge.
1 out of 11
Related Documents


Your All-in-One AI-Powered Toolkit for Academic Success.
+13062052269
info@desklib.com
Available 24*7 on WhatsApp / Email
![[object Object]](/_next/static/media/star-bottom.7253800d.svg)
Unlock your academic potential
Copyright © 2020–2026 A2Z Services. All Rights Reserved. Developed and managed by ZUCOL.