Analysis of Owner's Equity and Liabilities: NAB and Westpac Report
VerifiedAdded on 2022/10/14
|15
|3993
|315
Report
AI Summary
This report provides a detailed comparative analysis of the financial statements of National Australia Bank (NAB) and Westpac, focusing on their owner's equity and liabilities. The analysis covers the financial years 2016, 2017, and 2018, examining the components of each section of the balance sheet and their respective movements. The report investigates the legal status of both companies as reporting entities under Australian accounting standards (AASB) and explores the different sources of funds for each entity. It includes a breakdown of owner's equity components, such as issued capital and other contributed equity, and liability components, including due to other banks, trading instruments, other financial liabilities, hedging derivatives, deposits, and other borrowings. The report aims to highlight the trends and variances in these components to understand how each company manages its finances. The findings are presented in tables and discussed to provide a clear understanding of the financial performance of NAB and Westpac.

Corporate Accounting
1 | P a g e
1 | P a g e
Paraphrase This Document
Need a fresh take? Get an instant paraphrase of this document with our AI Paraphraser
Abstract
Australian business entities have different types of legal status as small proprietary
companies, reporting entity and large proprietary companies. As per their status, the
business entities has to furnish their financial statements to the stakeholders with
necessary disclosures specified by regulatory bodies like AASB, Corporation Act,2001,
ASX with necessary compliance for reporting entities. In this article, two different
reporting entities are selected for analyses of their financial reports in perspective of
owners’ equity and liabilities sections with their respective components and projected
movements of those components for last three years as per their respective audited
annual reports with necessary disclosures. The companies selected for this purpose are
National Australia Bank or NAB and Westpac. These analyses would be formed with
critical research on the referred subjects for these two companies with retrieval of data
from their audited annual reports. For these analyses, different parts of annual report for
last three years are to be considered with their features of item-wise movement of
owners’ equity and liabilities. The outcome of this research would be able to provide
clear direction of movement of different sub-components of liabilities and owners’ equity
and thus can highlight the source of funds for those two reporting entities. This report
will conclude with conclusion to summarize the discussion for these reporting entities.
Key words: Owners’ equity, liabilities, Proprietary Companies; Proprietorship
Companies; reporting entity; AASB.
2 | P a g e
Table of Contents
Introduction.................................................................................................................................................4
Legal status- NAB and Westpac...................................................................................................................4
Analysis of Owner’s Equity and Liabilities- NAB and Westpac.....................................................................5
National Australia Bank (NAB).................................................................................................................5
Owner’s equity- NAB...........................................................................................................................5
Liabilities- NAB.....................................................................................................................................7
Westpac...................................................................................................................................................9
Owner’s Equity- Westpac....................................................................................................................9
Liabilities- Westpac............................................................................................................................11
Conclusion.................................................................................................................................................13
References:................................................................................................................................................14
3 | P a g e
⊘ This is a preview!⊘
Do you want full access?
Subscribe today to unlock all pages.
Trusted by 1+ million students worldwide
Introduction
This report will highlight two items of balance sheet of two reporting entities featured in
ASX as listed companies. The referred two items are owner’s equity and liabilities.
There are different components forming these balance sheet items in the annual
financial report of any reporting entity. The objective of this report is to identify those
components of balance sheet with their comparative analyses to earmark their
movement for last three years from disclosed annual financial reports published for
stakeholders. The two companies selected for these analyses are National Australia
Bank or NAB and Westpac. Both Nab and Westpac is engaged in banking and financial
activities in Australia for long period. NAB has started its operation since 1982, while
Westpac has started its operation in 1817. NAB has the ranking of one of the four
largest financial organizations of Australia in respect of market capitalization, customer
base and earnings with its global ranking of 21st biggest bank considering market
capitalization and 50th largest member of global banking industry. Westpac Banking
Corporation is known popularly as Westpac. This banking corporation has it’s
headquarter at Sydney. This bank has gone through transition process through its latest
merger with Commercial Bank of Australia in 1982. This bank is also considered as one
of the four major banks of Australia with 14 million customers and around 40,000
employees and has eminent and prestigious acknowledgement from Dow Jones as the
most sustainable banking corporation globally for consecutive four years in a row.
Legal status- NAB and Westpac
Prevalent Australian legal status of business entities are small proprietary company,
large proprietary company and reporting entity. Both these banking organizations are
under the segment of reporting entity as per specified definition mentioned in AASB.
The main criterion for reporting entity is their financial reporting pattern and respective
expectation of stakeholders on those financial reports. The feature of reporting entity is
considered, when the stakeholders of any entity are depending upon General Purpose
Financial Report or GPFR to understand the financial condition of any entity. The stake
holders normally initiate their decision making process by assessing those financial
reports. The types of stakeholders are broadly divided into two groups- internal and
external. Internal stakeholders of any reporting entity are employees and the Board,
while external stakeholders consist of creditors, shareholders, different regulatory
authorities of Australia. All these stakeholders depend upon the financial statements
published by the entity made on the basis of GPFR. Reporting entity is consisting of
large private companies with external shareholders and public limited companies
enlisted in ASX. It is mandatory for the reporting entities to ensure preparation of GPFR
with necessary disclosure to confirm compliance of different accounting and other
standards ,as specified by AASB, (AASB, n.d) IFRS, (IFRS, 2017) ASX (ASX, n.d), and
Corporation Act 2001 (Legislation, 2018), effective in Australia business perspective.
Other business entities, falling under no-reporting entities, do not required to prepare
financial reports under GPFR; instead they have to prepare special purpose financial
report. While it is mandatory for reporting entity to ensure necessary disclosures as per
4 | P a g e
Paraphrase This Document
Need a fresh take? Get an instant paraphrase of this document with our AI Paraphraser
specific format, no-reporting entities have no such obligation to provide accounting
disclosure for their stakeholders. (PKFAustralia, 2017)
From the above discussion about the status of NAB and Westpac, it is confirmed that
both the entities are reporting entity with the feature of GPFR financial reporting to
ensure prudence and clarity with endorsing the concept of Conceptual Framework of
accounting practices for the stakeholders. (AASB, 2018) (IFRS, 2018)
Analysis of Owner’s Equity and Liabilities- NAB and Westpac
National Australia Bank (NAB)
This report needs the analyses of two different reports of NAB retrieved from Balance
sheet for the financial year 2016, 2017 and 2018. The two specified reports are related
to owner’s equity and liabilities. There are different components featured to comprise of
the consolidated report of the above two elements of balance sheet. We will discuss
those components with their respective role in the balance sheet and the year-wise
variance report of those components to understand the movement of those components
comes under the purview of owner’s equity and liabilities. (NAB, n.d)
Owner’s equity- NAB
Owner’s equity is consisting of different components. From the sample of NAB financial
reports for 2016, 2017 and 2018, the items contributing to owner’s equity are divided
into two parts: Issued and paid up capital consisting of fully paid ordinary shares; and
other contributed equity. Other contributed equity is consisting of National Income
securities; Trust preferred securities; and National Capital Instruments. These
components individually contributed to the balance sheet under the heading of Owner’s
equity. The following analysis can give idea of movements of these components for the
considered three financial years- 2016, 2017 and 2018. As NAB is a group organization
of financial operations, the detailed analysis is cited for group and the company for the
specific period.
From the analysis of The Group it is evident that:
1. Fully paid ordinary shares have growth movement in subsequent years. In
value, 2016 fully paid ordinary shares is valued at 30968 M AUD; followed by
2017 with value of 31707 M Aud; and in 2018 with value of 33062 M AUD. The
movement variance of 2017 growth is featured as 2.39% over 2016, while 2018
growth is featured as 4.27% comparing to 2017. (Kenton, 2019)
2. Other contributed equities are featured with different components. The first
component is National Income Securities, which found no growth during the
period with 1945 M AUD. There is no movement found for this tenure for the
component for owner’s equity. (Hayes, 2019)
3. Trust preferred securities, the component of other contributed equity, is
featured in group balance sheet only with no change during the period of 2016 to
2018. This component has no effect in company balance sheet, as well. (Kenton,
2019)
5 | P a g e
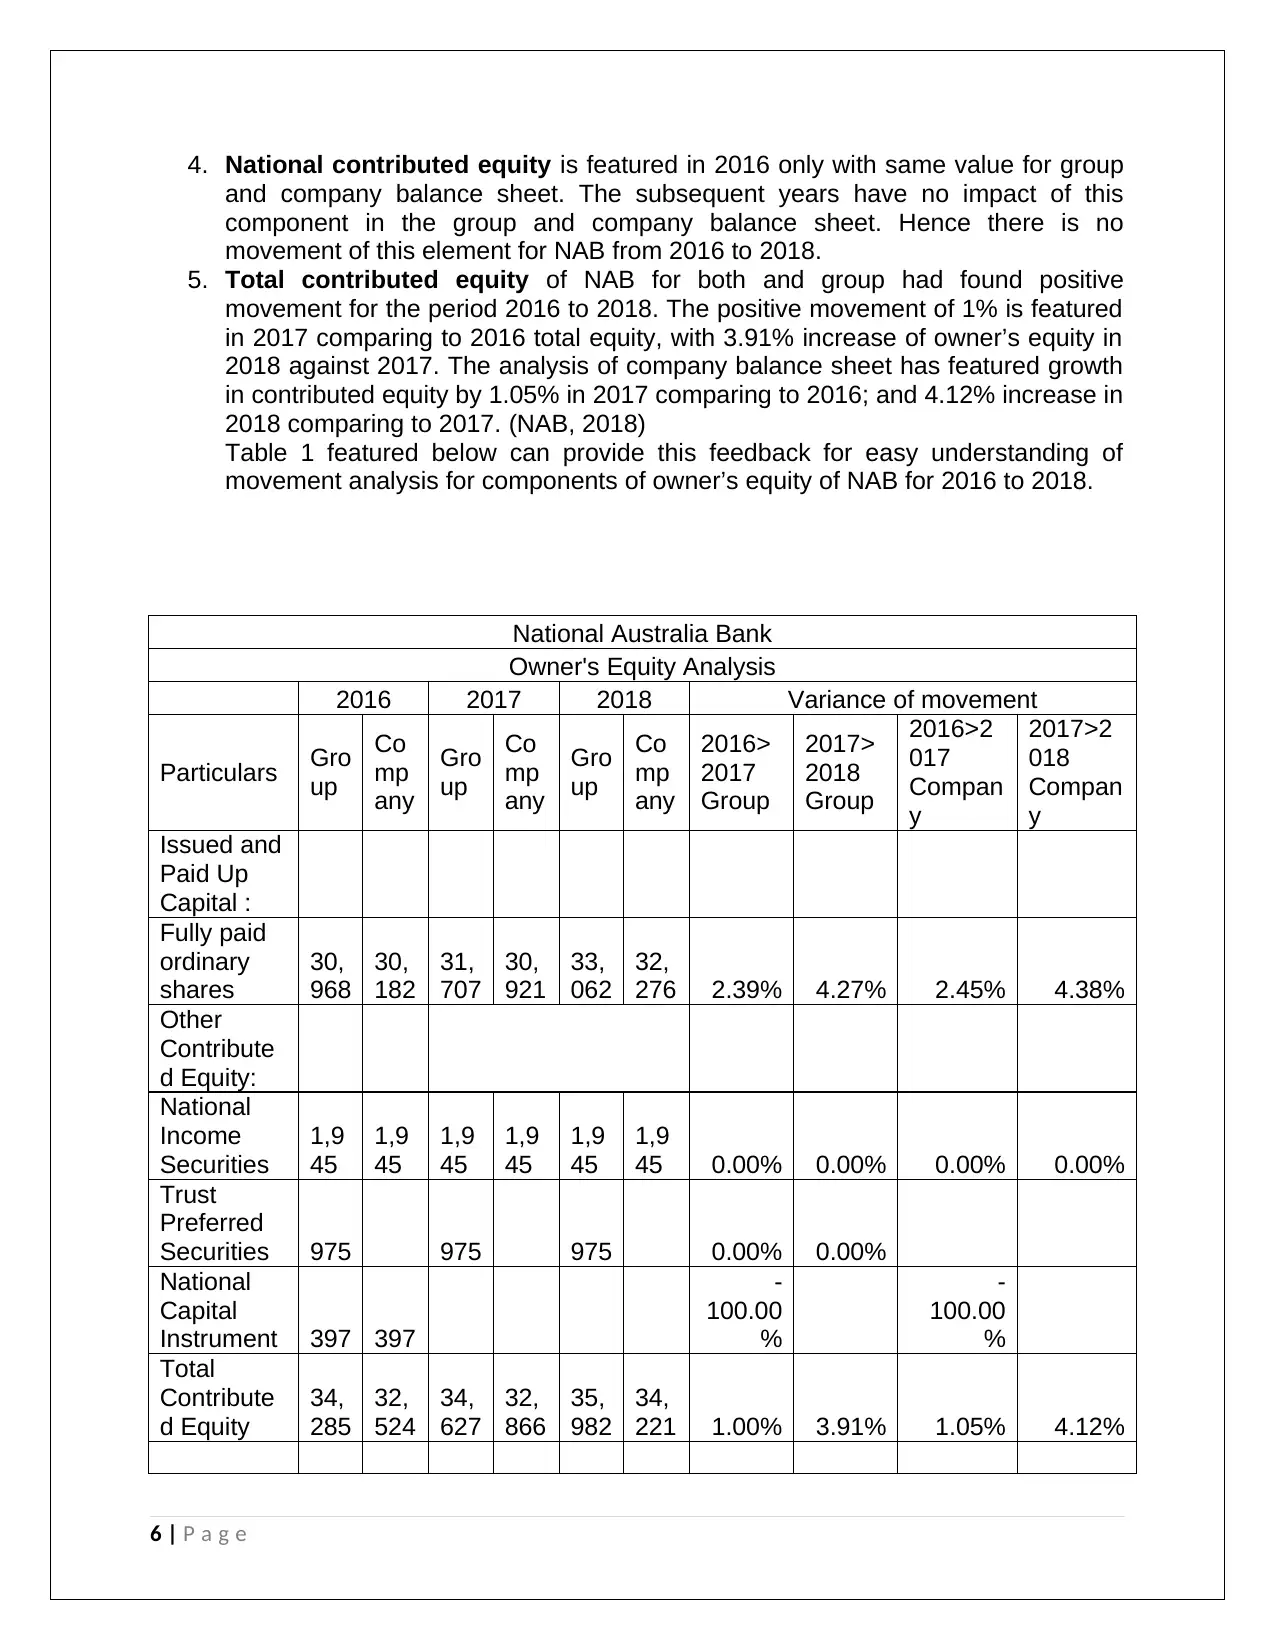
4. National contributed equity is featured in 2016 only with same value for group
and company balance sheet. The subsequent years have no impact of this
component in the group and company balance sheet. Hence there is no
movement of this element for NAB from 2016 to 2018.
5. Total contributed equity of NAB for both and group had found positive
movement for the period 2016 to 2018. The positive movement of 1% is featured
in 2017 comparing to 2016 total equity, with 3.91% increase of owner’s equity in
2018 against 2017. The analysis of company balance sheet has featured growth
in contributed equity by 1.05% in 2017 comparing to 2016; and 4.12% increase in
2018 comparing to 2017. (NAB, 2018)
Table 1 featured below can provide this feedback for easy understanding of
movement analysis for components of owner’s equity of NAB for 2016 to 2018.
National Australia Bank
Owner's Equity Analysis
2016 2017 2018 Variance of movement
Particulars Gro
up
Co
mp
any
Gro
up
Co
mp
any
Gro
up
Co
mp
any
2016>
2017
Group
2017>
2018
Group
2016>2
017
Compan
y
2017>2
018
Compan
y
Issued and
Paid Up
Capital :
Fully paid
ordinary
shares
30,
968
30,
182
31,
707
30,
921
33,
062
32,
276 2.39% 4.27% 2.45% 4.38%
Other
Contribute
d Equity:
National
Income
Securities
1,9
45
1,9
45
1,9
45
1,9
45
1,9
45
1,9
45 0.00% 0.00% 0.00% 0.00%
Trust
Preferred
Securities 975 975 975 0.00% 0.00%
National
Capital
Instrument 397 397
-
100.00
%
-
100.00
%
Total
Contribute
d Equity
34,
285
32,
524
34,
627
32,
866
35,
982
34,
221 1.00% 3.91% 1.05% 4.12%
6 | P a g e
⊘ This is a preview!⊘
Do you want full access?
Subscribe today to unlock all pages.
Trusted by 1+ million students worldwide
All Figures
in million
AUD
Table 1
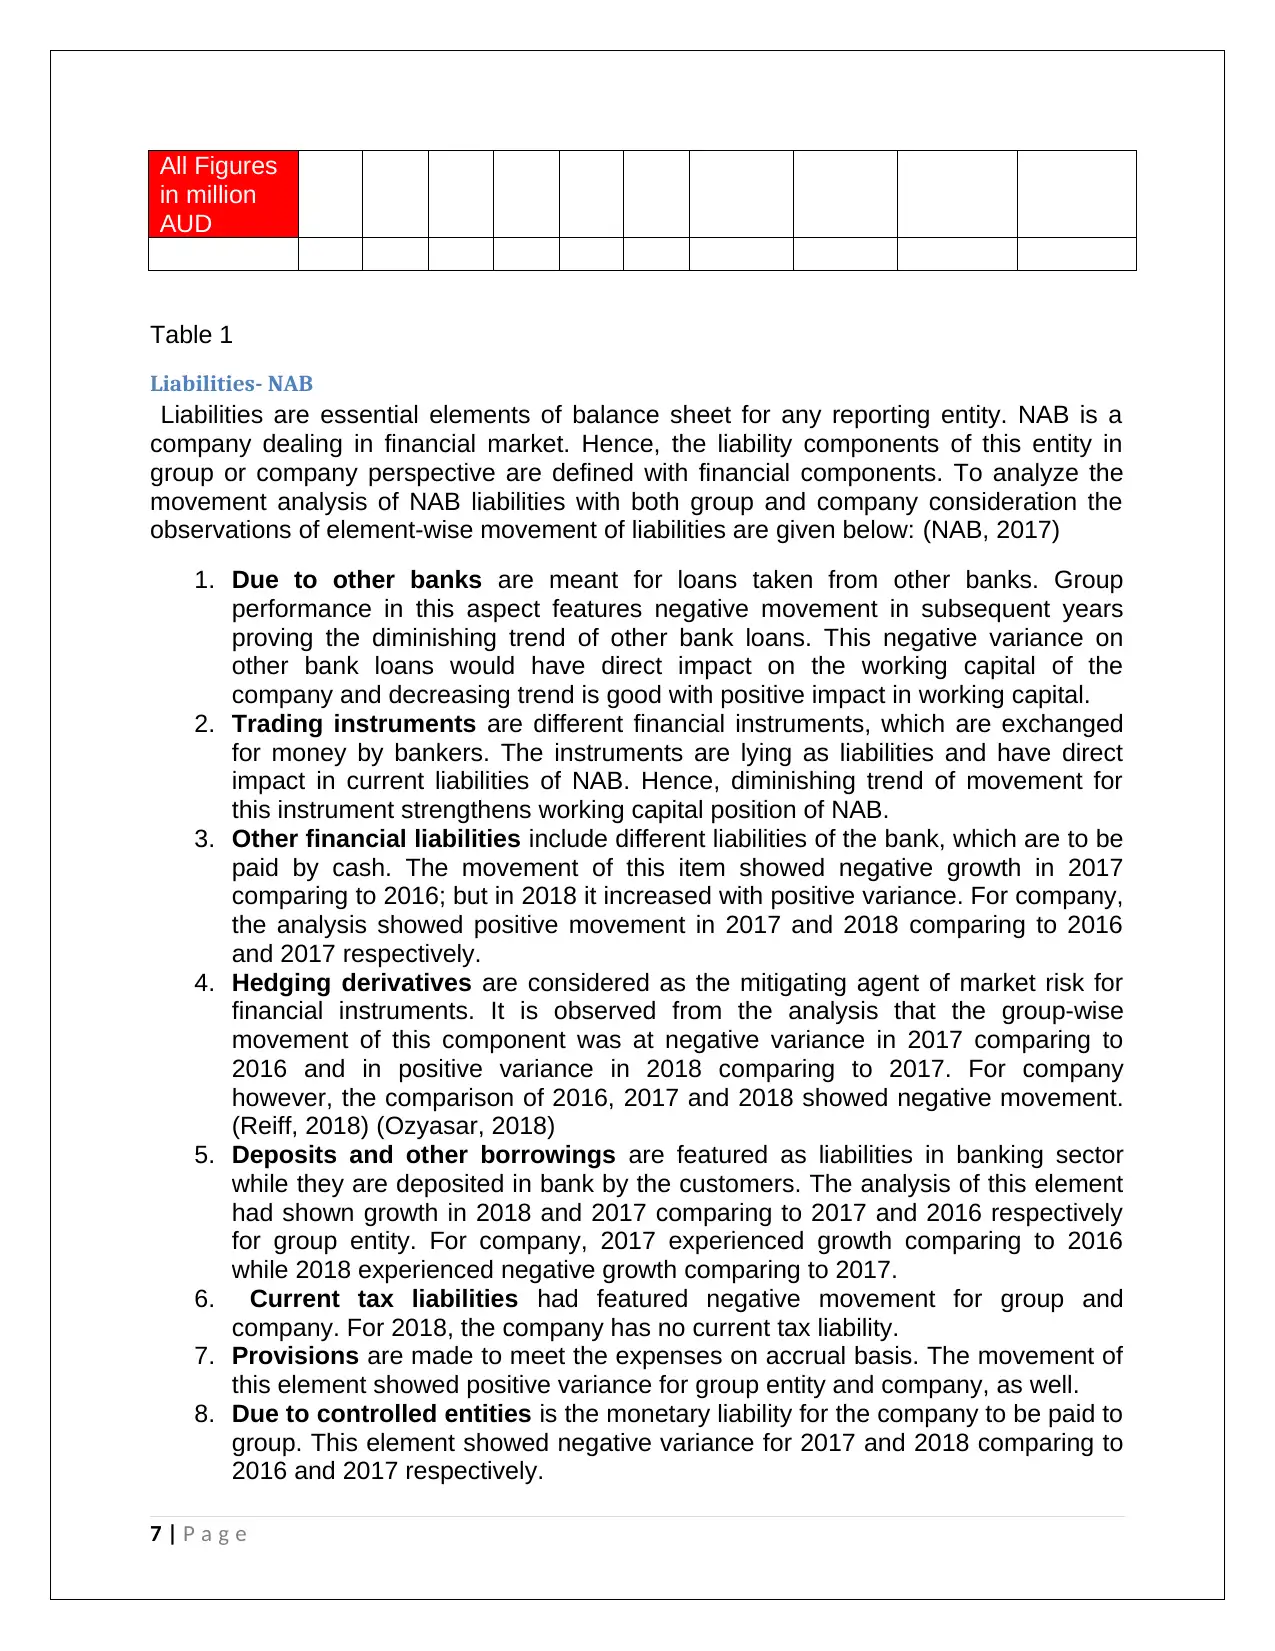
Liabilities- NAB
Liabilities are essential elements of balance sheet for any reporting entity. NAB is a
company dealing in financial market. Hence, the liability components of this entity in
group or company perspective are defined with financial components. To analyze the
movement analysis of NAB liabilities with both group and company consideration the
observations of element-wise movement of liabilities are given below: (NAB, 2017)
1. Due to other banks are meant for loans taken from other banks. Group
performance in this aspect features negative movement in subsequent years
proving the diminishing trend of other bank loans. This negative variance on
other bank loans would have direct impact on the working capital of the
company and decreasing trend is good with positive impact in working capital.
2. Trading instruments are different financial instruments, which are exchanged
for money by bankers. The instruments are lying as liabilities and have direct
impact in current liabilities of NAB. Hence, diminishing trend of movement for
this instrument strengthens working capital position of NAB.
3. Other financial liabilities include different liabilities of the bank, which are to be
paid by cash. The movement of this item showed negative growth in 2017
comparing to 2016; but in 2018 it increased with positive variance. For company,
the analysis showed positive movement in 2017 and 2018 comparing to 2016
and 2017 respectively.
4. Hedging derivatives are considered as the mitigating agent of market risk for
financial instruments. It is observed from the analysis that the group-wise
movement of this component was at negative variance in 2017 comparing to
2016 and in positive variance in 2018 comparing to 2017. For company
however, the comparison of 2016, 2017 and 2018 showed negative movement.
(Reiff, 2018) (Ozyasar, 2018)
5. Deposits and other borrowings are featured as liabilities in banking sector
while they are deposited in bank by the customers. The analysis of this element
had shown growth in 2018 and 2017 comparing to 2017 and 2016 respectively
for group entity. For company, 2017 experienced growth comparing to 2016
while 2018 experienced negative growth comparing to 2017.
6. Current tax liabilities had featured negative movement for group and
company. For 2018, the company has no current tax liability.
7. Provisions are made to meet the expenses on accrual basis. The movement of
this element showed positive variance for group entity and company, as well.
8. Due to controlled entities is the monetary liability for the company to be paid to
group. This element showed negative variance for 2017 and 2018 comparing to
2016 and 2017 respectively.
7 | P a g e
in million
AUD
Table 1
Liabilities- NAB
Liabilities are essential elements of balance sheet for any reporting entity. NAB is a
company dealing in financial market. Hence, the liability components of this entity in
group or company perspective are defined with financial components. To analyze the
movement analysis of NAB liabilities with both group and company consideration the
observations of element-wise movement of liabilities are given below: (NAB, 2017)
1. Due to other banks are meant for loans taken from other banks. Group
performance in this aspect features negative movement in subsequent years
proving the diminishing trend of other bank loans. This negative variance on
other bank loans would have direct impact on the working capital of the
company and decreasing trend is good with positive impact in working capital.
2. Trading instruments are different financial instruments, which are exchanged
for money by bankers. The instruments are lying as liabilities and have direct
impact in current liabilities of NAB. Hence, diminishing trend of movement for
this instrument strengthens working capital position of NAB.
3. Other financial liabilities include different liabilities of the bank, which are to be
paid by cash. The movement of this item showed negative growth in 2017
comparing to 2016; but in 2018 it increased with positive variance. For company,
the analysis showed positive movement in 2017 and 2018 comparing to 2016
and 2017 respectively.
4. Hedging derivatives are considered as the mitigating agent of market risk for
financial instruments. It is observed from the analysis that the group-wise
movement of this component was at negative variance in 2017 comparing to
2016 and in positive variance in 2018 comparing to 2017. For company
however, the comparison of 2016, 2017 and 2018 showed negative movement.
(Reiff, 2018) (Ozyasar, 2018)
5. Deposits and other borrowings are featured as liabilities in banking sector
while they are deposited in bank by the customers. The analysis of this element
had shown growth in 2018 and 2017 comparing to 2017 and 2016 respectively
for group entity. For company, 2017 experienced growth comparing to 2016
while 2018 experienced negative growth comparing to 2017.
6. Current tax liabilities had featured negative movement for group and
company. For 2018, the company has no current tax liability.
7. Provisions are made to meet the expenses on accrual basis. The movement of
this element showed positive variance for group entity and company, as well.
8. Due to controlled entities is the monetary liability for the company to be paid to
group. This element showed negative variance for 2017 and 2018 comparing to
2016 and 2017 respectively.
7 | P a g e
Paraphrase This Document
Need a fresh take? Get an instant paraphrase of this document with our AI Paraphraser
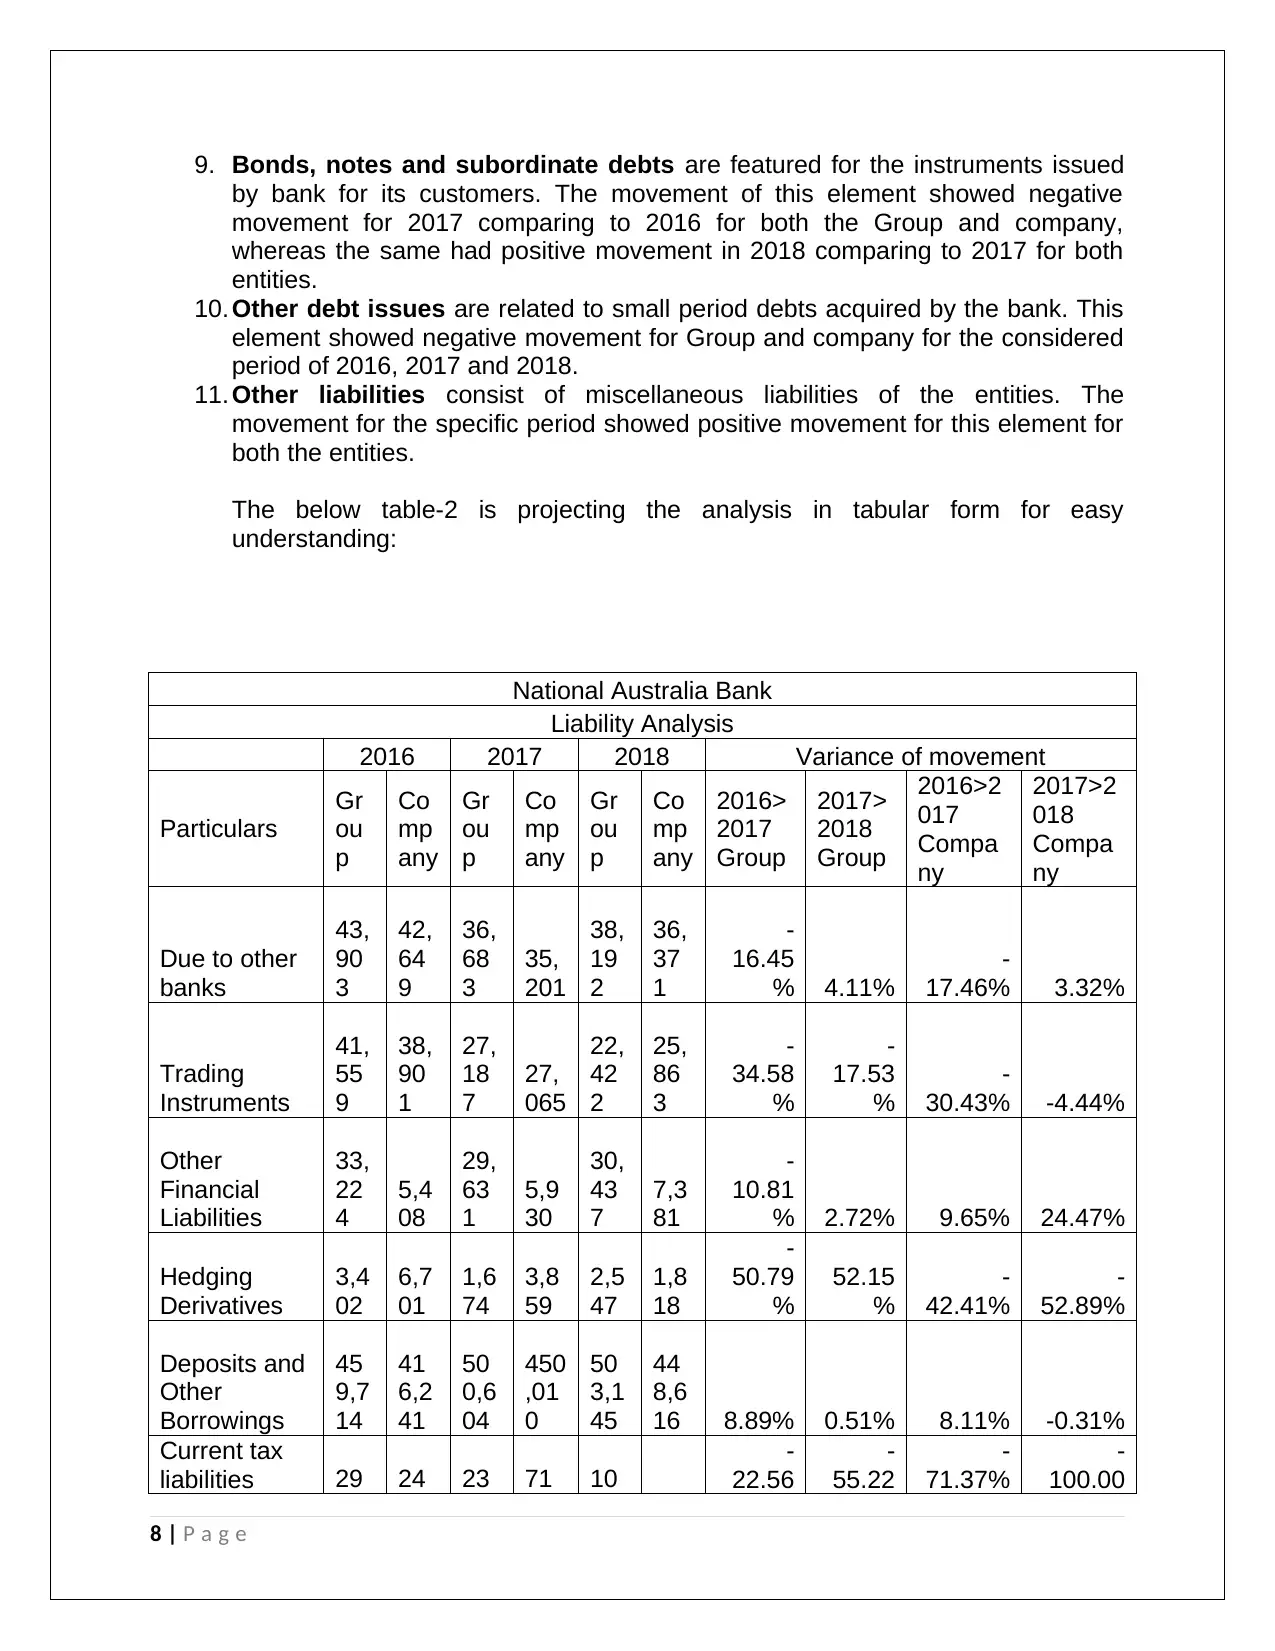
9. Bonds, notes and subordinate debts are featured for the instruments issued
by bank for its customers. The movement of this element showed negative
movement for 2017 comparing to 2016 for both the Group and company,
whereas the same had positive movement in 2018 comparing to 2017 for both
entities.
10. Other debt issues are related to small period debts acquired by the bank. This
element showed negative movement for Group and company for the considered
period of 2016, 2017 and 2018.
11. Other liabilities consist of miscellaneous liabilities of the entities. The
movement for the specific period showed positive movement for this element for
both the entities.
The below table-2 is projecting the analysis in tabular form for easy
understanding:
National Australia Bank
Liability Analysis
2016 2017 2018 Variance of movement
Particulars
Gr
ou
p
Co
mp
any
Gr
ou
p
Co
mp
any
Gr
ou
p
Co
mp
any
2016>
2017
Group
2017>
2018
Group
2016>2
017
Compa
ny
2017>2
018
Compa
ny
Due to other
banks
43,
90
3
42,
64
9
36,
68
3
35,
201
38,
19
2
36,
37
1
-
16.45
% 4.11%
-
17.46% 3.32%
Trading
Instruments
41,
55
9
38,
90
1
27,
18
7
27,
065
22,
42
2
25,
86
3
-
34.58
%
-
17.53
%
-
30.43% -4.44%
Other
Financial
Liabilities
33,
22
4
5,4
08
29,
63
1
5,9
30
30,
43
7
7,3
81
-
10.81
% 2.72% 9.65% 24.47%
Hedging
Derivatives
3,4
02
6,7
01
1,6
74
3,8
59
2,5
47
1,8
18
-
50.79
%
52.15
%
-
42.41%
-
52.89%
Deposits and
Other
Borrowings
45
9,7
14
41
6,2
41
50
0,6
04
450
,01
0
50
3,1
45
44
8,6
16 8.89% 0.51% 8.11% -0.31%
Current tax
liabilities 29 24 23 71 10
-
22.56
-
55.22
-
71.37%
-
100.00
8 | P a g e
7 8 0 3 % % %
Provisions
1,4
32
1,1
57
1,9
61
1,7
34
2,1
96
1,8
79
36.94
%
11.98
% 49.87% 8.36%
Due to
controlled
entities
11
7,3
99
107
,60
1
10
2,8
88
#DIV/
0!
#DIV/
0! -8.35% -4.38%
Bond, Notes
and
subordinate
Debts
12
7,9
42
12
3,2
26
12
4,8
71
121
,31
5
14
0,2
22
13
6,1
10
-
2.40%
12.29
% -1.55% 12.20%
other debt
issues
6,2
48
6,2
48
6,1
87
6,1
87
6,1
58
6,1
58
-
0.98%
-
0.47% -0.98% -0.47%
other
liabilities
7,6
74
6,6
69
7,9
80
6,9
42
8,3
76
7,1
08 3.99% 4.96% 4.09% 2.39%
Total
72
5,3
95
76
4,8
47
73
7,0
08
765
,91
5
75
3,7
98
77
4,1
92 1.60% 2.28% 0.14% 1.08%
All Figures in
million AUD
Table 2
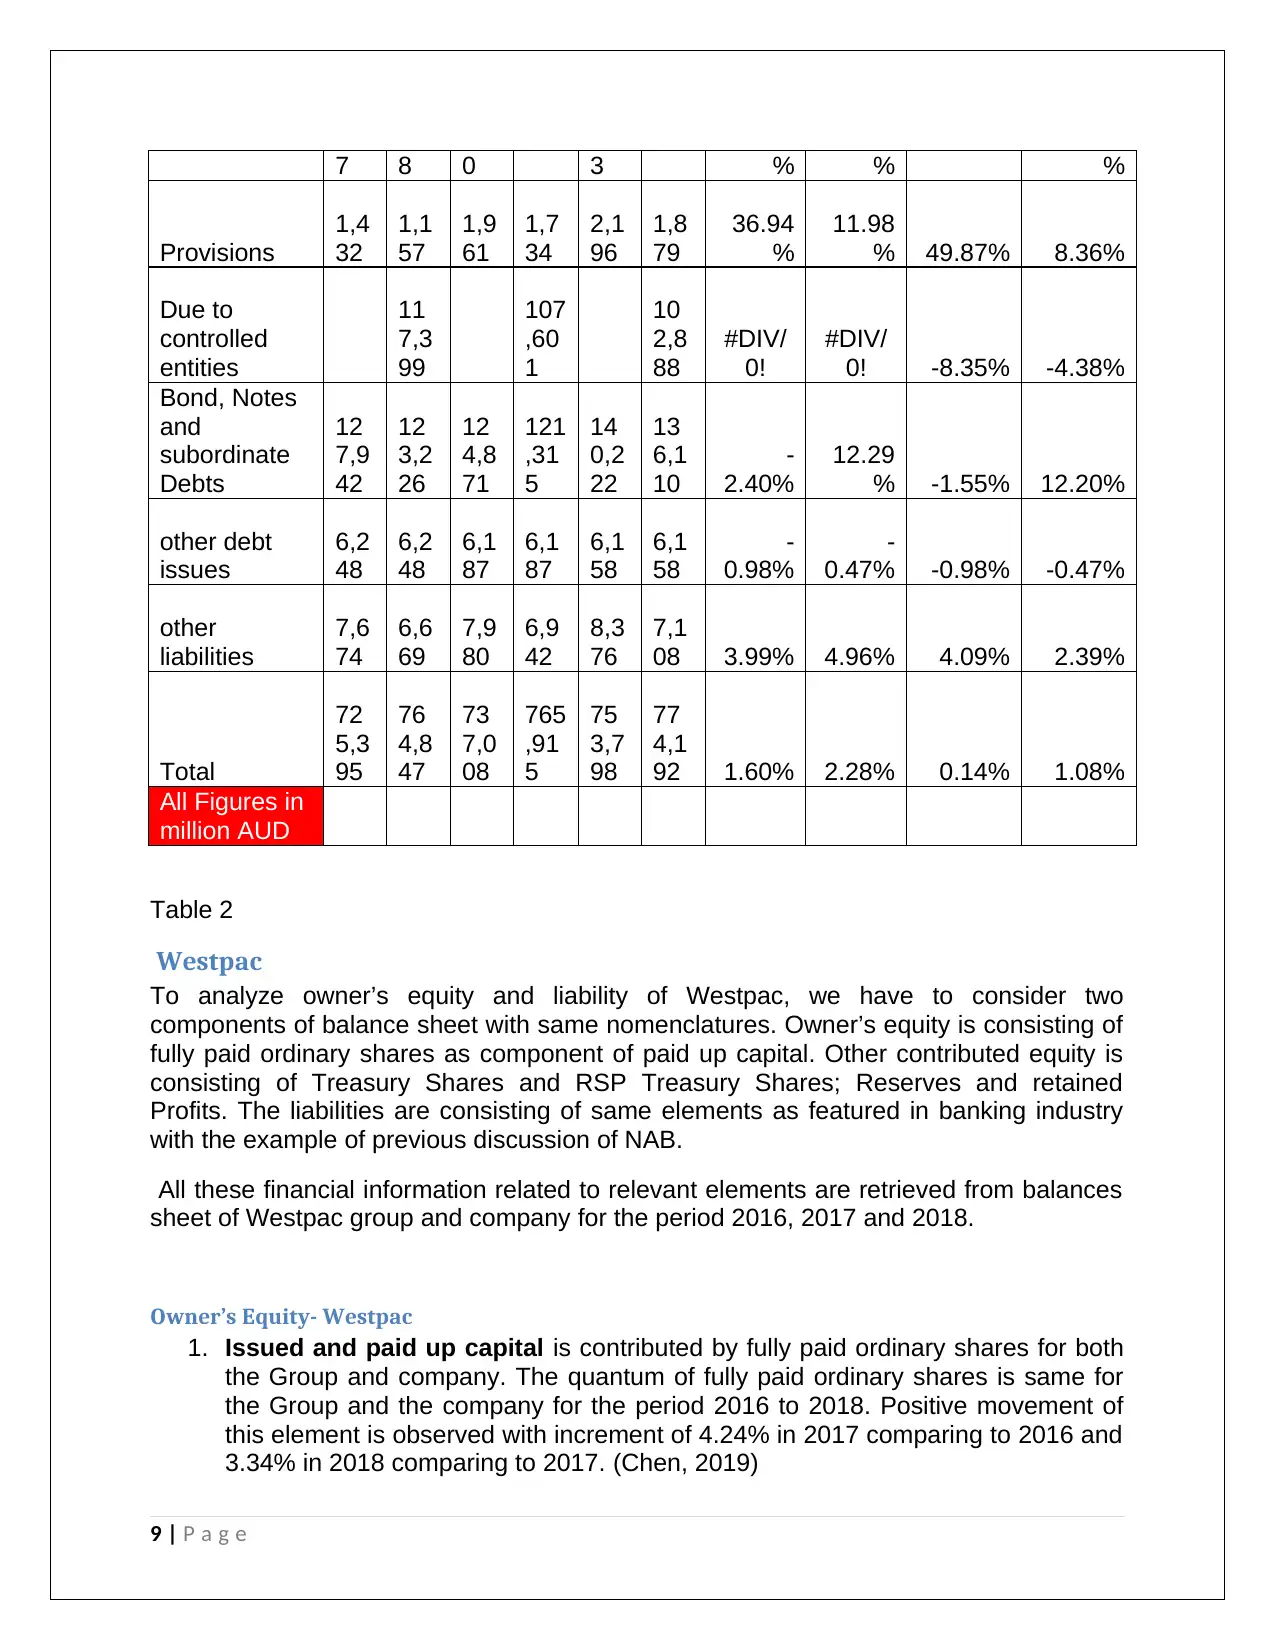
Westpac
To analyze owner’s equity and liability of Westpac, we have to consider two
components of balance sheet with same nomenclatures. Owner’s equity is consisting of
fully paid ordinary shares as component of paid up capital. Other contributed equity is
consisting of Treasury Shares and RSP Treasury Shares; Reserves and retained
Profits. The liabilities are consisting of same elements as featured in banking industry
with the example of previous discussion of NAB.
All these financial information related to relevant elements are retrieved from balances
sheet of Westpac group and company for the period 2016, 2017 and 2018.
Owner’s Equity- Westpac
1. Issued and paid up capital is contributed by fully paid ordinary shares for both
the Group and company. The quantum of fully paid ordinary shares is same for
the Group and the company for the period 2016 to 2018. Positive movement of
this element is observed with increment of 4.24% in 2017 comparing to 2016 and
3.34% in 2018 comparing to 2017. (Chen, 2019)
9 | P a g e
Provisions
1,4
32
1,1
57
1,9
61
1,7
34
2,1
96
1,8
79
36.94
%
11.98
% 49.87% 8.36%
Due to
controlled
entities
11
7,3
99
107
,60
1
10
2,8
88
#DIV/
0!
#DIV/
0! -8.35% -4.38%
Bond, Notes
and
subordinate
Debts
12
7,9
42
12
3,2
26
12
4,8
71
121
,31
5
14
0,2
22
13
6,1
10
-
2.40%
12.29
% -1.55% 12.20%
other debt
issues
6,2
48
6,2
48
6,1
87
6,1
87
6,1
58
6,1
58
-
0.98%
-
0.47% -0.98% -0.47%
other
liabilities
7,6
74
6,6
69
7,9
80
6,9
42
8,3
76
7,1
08 3.99% 4.96% 4.09% 2.39%
Total
72
5,3
95
76
4,8
47
73
7,0
08
765
,91
5
75
3,7
98
77
4,1
92 1.60% 2.28% 0.14% 1.08%
All Figures in
million AUD
Table 2
Westpac
To analyze owner’s equity and liability of Westpac, we have to consider two
components of balance sheet with same nomenclatures. Owner’s equity is consisting of
fully paid ordinary shares as component of paid up capital. Other contributed equity is
consisting of Treasury Shares and RSP Treasury Shares; Reserves and retained
Profits. The liabilities are consisting of same elements as featured in banking industry
with the example of previous discussion of NAB.
All these financial information related to relevant elements are retrieved from balances
sheet of Westpac group and company for the period 2016, 2017 and 2018.
Owner’s Equity- Westpac
1. Issued and paid up capital is contributed by fully paid ordinary shares for both
the Group and company. The quantum of fully paid ordinary shares is same for
the Group and the company for the period 2016 to 2018. Positive movement of
this element is observed with increment of 4.24% in 2017 comparing to 2016 and
3.34% in 2018 comparing to 2017. (Chen, 2019)
9 | P a g e
⊘ This is a preview!⊘
Do you want full access?
Subscribe today to unlock all pages.
Trusted by 1+ million students worldwide
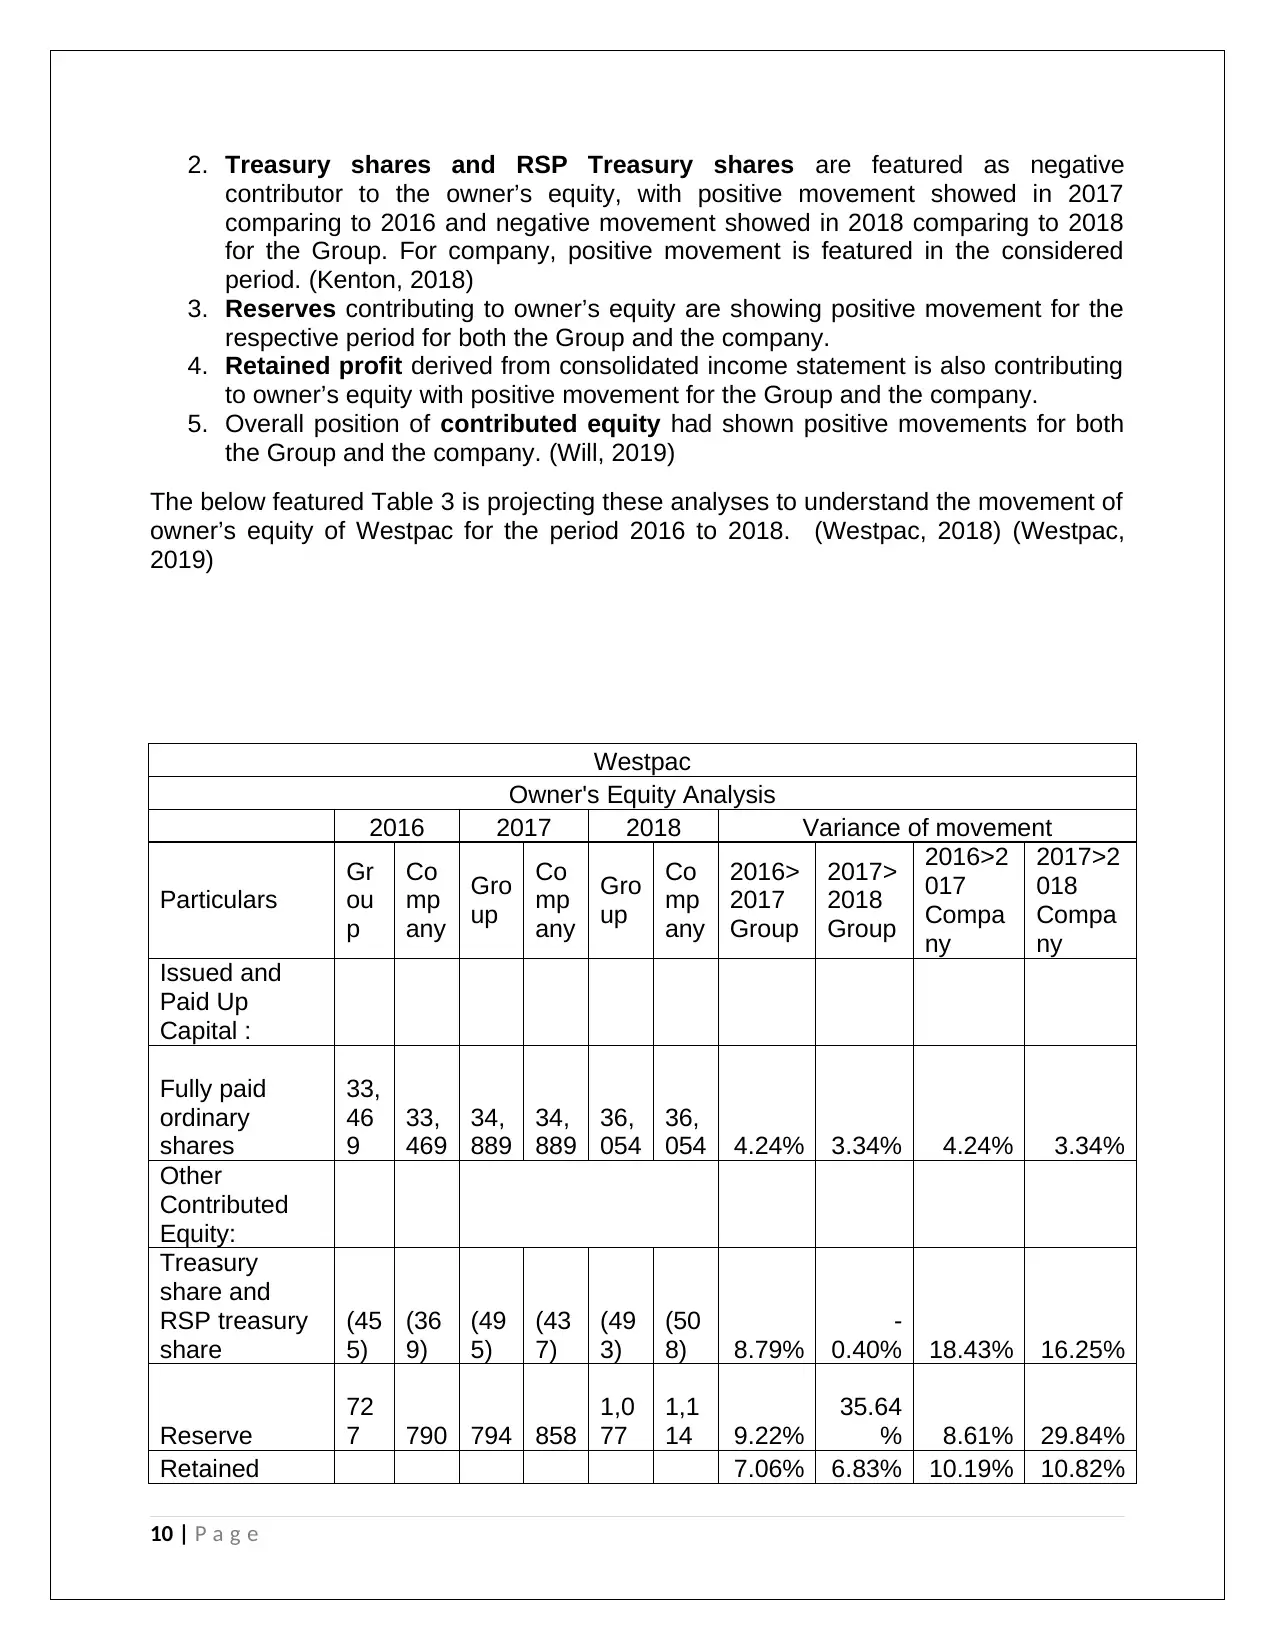
2. Treasury shares and RSP Treasury shares are featured as negative
contributor to the owner’s equity, with positive movement showed in 2017
comparing to 2016 and negative movement showed in 2018 comparing to 2018
for the Group. For company, positive movement is featured in the considered
period. (Kenton, 2018)
3. Reserves contributing to owner’s equity are showing positive movement for the
respective period for both the Group and the company.
4. Retained profit derived from consolidated income statement is also contributing
to owner’s equity with positive movement for the Group and the company.
5. Overall position of contributed equity had shown positive movements for both
the Group and the company. (Will, 2019)
The below featured Table 3 is projecting these analyses to understand the movement of
owner’s equity of Westpac for the period 2016 to 2018. (Westpac, 2018) (Westpac,
2019)
Westpac
Owner's Equity Analysis
2016 2017 2018 Variance of movement
Particulars
Gr
ou
p
Co
mp
any
Gro
up
Co
mp
any
Gro
up
Co
mp
any
2016>
2017
Group
2017>
2018
Group
2016>2
017
Compa
ny
2017>2
018
Compa
ny
Issued and
Paid Up
Capital :
Fully paid
ordinary
shares
33,
46
9
33,
469
34,
889
34,
889
36,
054
36,
054 4.24% 3.34% 4.24% 3.34%
Other
Contributed
Equity:
Treasury
share and
RSP treasury
share
(45
5)
(36
9)
(49
5)
(43
7)
(49
3)
(50
8) 8.79%
-
0.40% 18.43% 16.25%
Reserve
72
7 790 794 858
1,0
77
1,1
14 9.22%
35.64
% 8.61% 29.84%
Retained 7.06% 6.83% 10.19% 10.82%
10 | P a g e
Paraphrase This Document
Need a fresh take? Get an instant paraphrase of this document with our AI Paraphraser
Profit
24,
37
9
15,
311
26,
100
16,
871
27,
883
18,
696
Total
Contributed
Equity
58,
12
0
49,
201
61,
288
52,
181
64,
521
55,
356 5.45% 5.28% 6.06% 6.08%
All Figures in
million AUD
Table 3
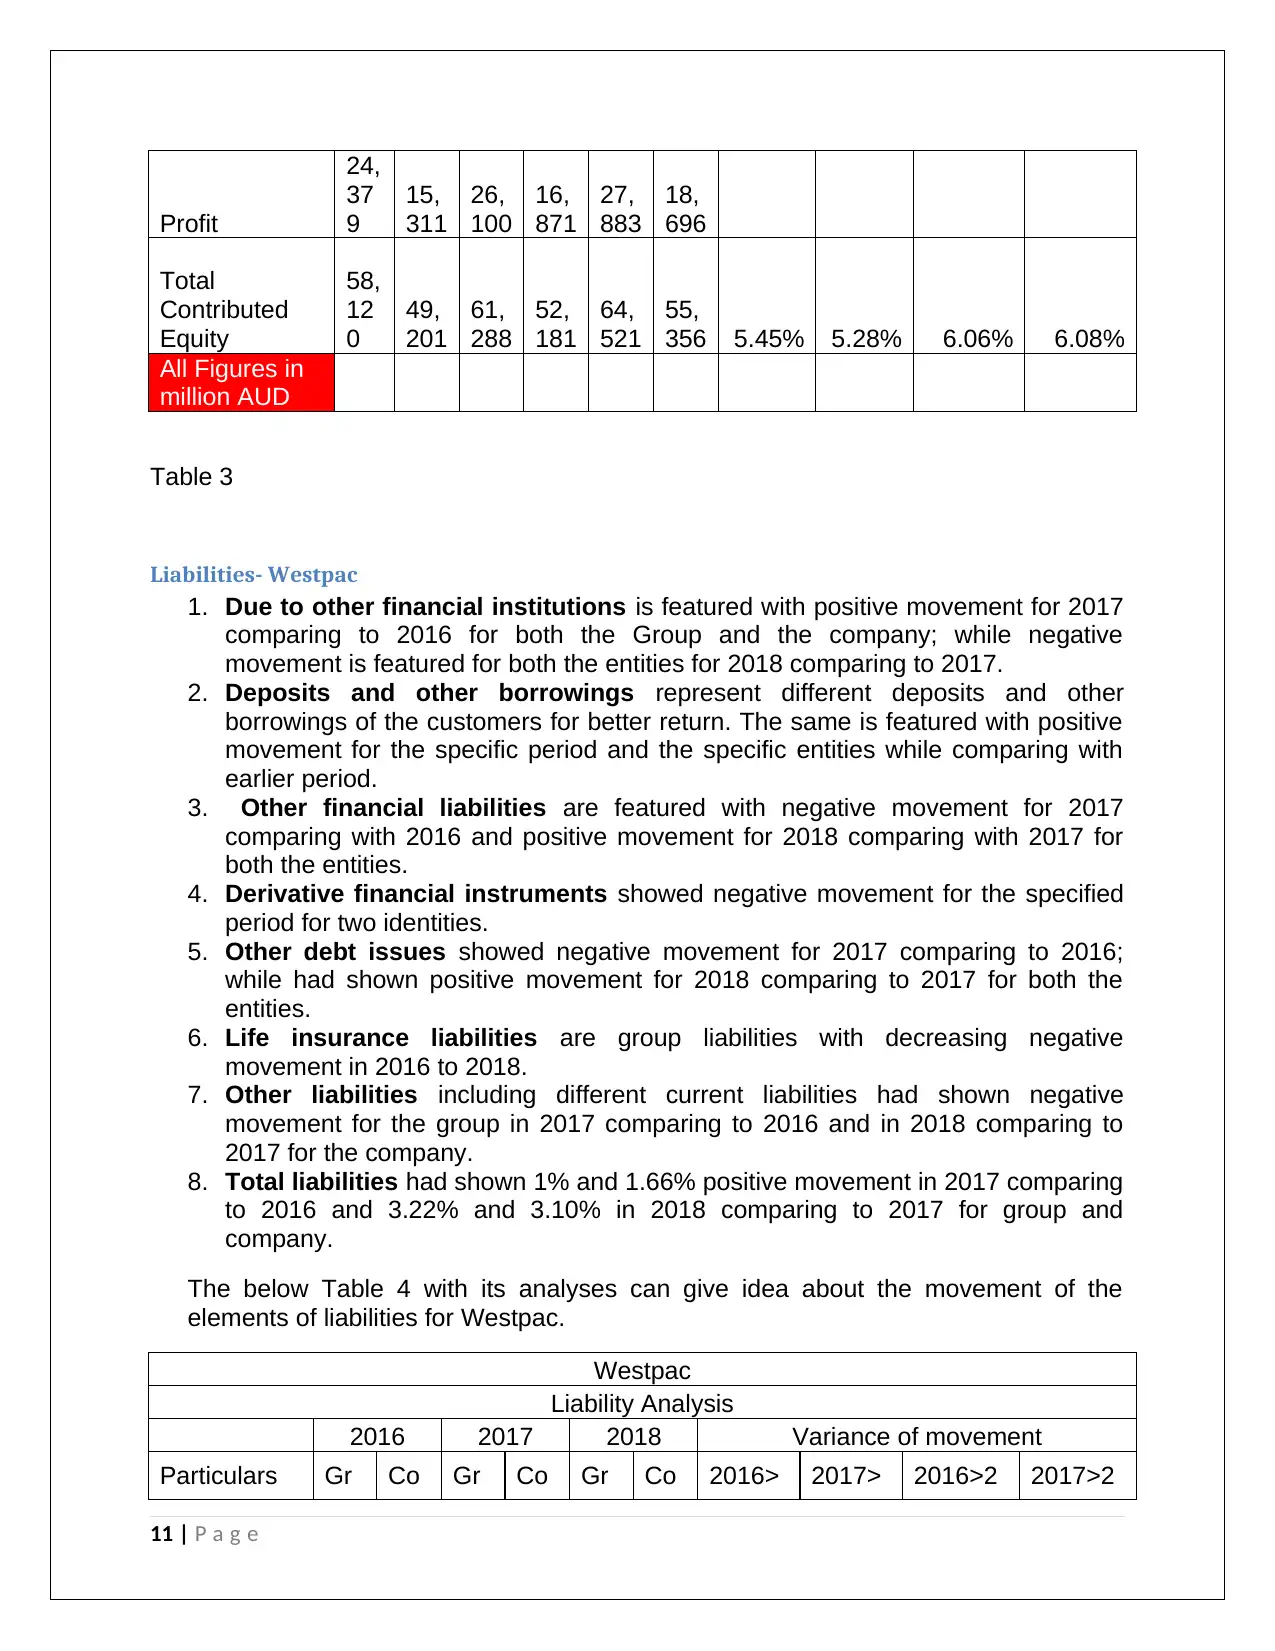
Liabilities- Westpac
1. Due to other financial institutions is featured with positive movement for 2017
comparing to 2016 for both the Group and the company; while negative
movement is featured for both the entities for 2018 comparing to 2017.
2. Deposits and other borrowings represent different deposits and other
borrowings of the customers for better return. The same is featured with positive
movement for the specific period and the specific entities while comparing with
earlier period.
3. Other financial liabilities are featured with negative movement for 2017
comparing with 2016 and positive movement for 2018 comparing with 2017 for
both the entities.
4. Derivative financial instruments showed negative movement for the specified
period for two identities.
5. Other debt issues showed negative movement for 2017 comparing to 2016;
while had shown positive movement for 2018 comparing to 2017 for both the
entities.
6. Life insurance liabilities are group liabilities with decreasing negative
movement in 2016 to 2018.
7. Other liabilities including different current liabilities had shown negative
movement for the group in 2017 comparing to 2016 and in 2018 comparing to
2017 for the company.
8. Total liabilities had shown 1% and 1.66% positive movement in 2017 comparing
to 2016 and 3.22% and 3.10% in 2018 comparing to 2017 for group and
company.
The below Table 4 with its analyses can give idea about the movement of the
elements of liabilities for Westpac.
Westpac
Liability Analysis
2016 2017 2018 Variance of movement
Particulars Gr Co Gr Co Gr Co 2016> 2017> 2016>2 2017>2
11 | P a g e
24,
37
9
15,
311
26,
100
16,
871
27,
883
18,
696
Total
Contributed
Equity
58,
12
0
49,
201
61,
288
52,
181
64,
521
55,
356 5.45% 5.28% 6.06% 6.08%
All Figures in
million AUD
Table 3
Liabilities- Westpac
1. Due to other financial institutions is featured with positive movement for 2017
comparing to 2016 for both the Group and the company; while negative
movement is featured for both the entities for 2018 comparing to 2017.
2. Deposits and other borrowings represent different deposits and other
borrowings of the customers for better return. The same is featured with positive
movement for the specific period and the specific entities while comparing with
earlier period.
3. Other financial liabilities are featured with negative movement for 2017
comparing with 2016 and positive movement for 2018 comparing with 2017 for
both the entities.
4. Derivative financial instruments showed negative movement for the specified
period for two identities.
5. Other debt issues showed negative movement for 2017 comparing to 2016;
while had shown positive movement for 2018 comparing to 2017 for both the
entities.
6. Life insurance liabilities are group liabilities with decreasing negative
movement in 2016 to 2018.
7. Other liabilities including different current liabilities had shown negative
movement for the group in 2017 comparing to 2016 and in 2018 comparing to
2017 for the company.
8. Total liabilities had shown 1% and 1.66% positive movement in 2017 comparing
to 2016 and 3.22% and 3.10% in 2018 comparing to 2017 for group and
company.
The below Table 4 with its analyses can give idea about the movement of the
elements of liabilities for Westpac.
Westpac
Liability Analysis
2016 2017 2018 Variance of movement
Particulars Gr Co Gr Co Gr Co 2016> 2017> 2016>2 2017>2
11 | P a g e
ou
p
mp
any
ou
p
mp
any
ou
p
mp
any
2017
Group
2018
Group
017
Compa
ny
018
Compa
ny
Due to other
financial
institutions
18,
20
9
18,
141
21,
90
7
21,
775
18,
13
7
17,
682
20.31
%
-
17.21
% 20.03% -18.80%
Deposits
and Other
Borrowings
51
3,0
71
455
,74
2
53
3,5
91
477
,69
3
55
9,2
85
500
,46
8 4.00% 4.82% 4.82% 4.77%
Other
Financial
Liabilities
4,7
52
4,3
71
4,0
56
4,0
38
4,2
97
4,2
97
-
14.65
% 5.94% -7.62% 6.41%
Derivative
financial
instruments
36,
07
6
35,
209
25,
37
5
24,
911
24,
40
7
24,
229
-
29.66
% -3.81% -29.25% -2.74%
other debt
issues
16
9,9
02
145
,57
6
16
8,3
56
144
,11
6
17
2,5
96
152
,28
8 -0.91% 2.52% -1.00% 5.67%
Life
insurance
liabilities
12,
36
1
9,0
19
7,5
97
-
27.04
%
-
15.77
%
other
liabilities
10,
84
5
151
,67
5
10,
56
3
152
,48
9
11,
43
5
151
,64
5 -2.60% 8.26% 0.54% -0.55%
Total
76
5,2
16
810
,71
4
77
2,8
67
825
,02
2
79
7,7
54
850
,60
9 1.00% 3.22% 1.76% 3.10%
All Figures
in million
AUD
Table 4
Conclusion
From the above analyses of two group companies of same industry, it is evident that
owner’s equity is part of the balance sheet with capital component and liabilities are part
of the balance sheet with different payables under different heads and time duration.
12 | P a g e
p
mp
any
ou
p
mp
any
ou
p
mp
any
2017
Group
2018
Group
017
Compa
ny
018
Compa
ny
Due to other
financial
institutions
18,
20
9
18,
141
21,
90
7
21,
775
18,
13
7
17,
682
20.31
%
-
17.21
% 20.03% -18.80%
Deposits
and Other
Borrowings
51
3,0
71
455
,74
2
53
3,5
91
477
,69
3
55
9,2
85
500
,46
8 4.00% 4.82% 4.82% 4.77%
Other
Financial
Liabilities
4,7
52
4,3
71
4,0
56
4,0
38
4,2
97
4,2
97
-
14.65
% 5.94% -7.62% 6.41%
Derivative
financial
instruments
36,
07
6
35,
209
25,
37
5
24,
911
24,
40
7
24,
229
-
29.66
% -3.81% -29.25% -2.74%
other debt
issues
16
9,9
02
145
,57
6
16
8,3
56
144
,11
6
17
2,5
96
152
,28
8 -0.91% 2.52% -1.00% 5.67%
Life
insurance
liabilities
12,
36
1
9,0
19
7,5
97
-
27.04
%
-
15.77
%
other
liabilities
10,
84
5
151
,67
5
10,
56
3
152
,48
9
11,
43
5
151
,64
5 -2.60% 8.26% 0.54% -0.55%
Total
76
5,2
16
810
,71
4
77
2,8
67
825
,02
2
79
7,7
54
850
,60
9 1.00% 3.22% 1.76% 3.10%
All Figures
in million
AUD
Table 4
Conclusion
From the above analyses of two group companies of same industry, it is evident that
owner’s equity is part of the balance sheet with capital component and liabilities are part
of the balance sheet with different payables under different heads and time duration.
12 | P a g e
⊘ This is a preview!⊘
Do you want full access?
Subscribe today to unlock all pages.
Trusted by 1+ million students worldwide
1 out of 15
Related Documents


Your All-in-One AI-Powered Toolkit for Academic Success.
+13062052269
info@desklib.com
Available 24*7 on WhatsApp / Email
![[object Object]](/_next/static/media/star-bottom.7253800d.svg)
Unlock your academic potential
Copyright © 2020–2026 A2Z Services. All Rights Reserved. Developed and managed by ZUCOL.