Comprehensive Financial Analysis: Oz Minerals Performance and Strategy
VerifiedAdded on 2020/05/28
|13
|2829
|124
Report
AI Summary
This report provides a comprehensive financial analysis of Oz Minerals, a mining company. It begins with a company description, ownership structure, and governance. The report calculates and analyzes key performance ratios such as ROA, ROE, and debt ratios, providing trend analysis and insights. Two graphs illustrate share price movements compared to the all ordinaries index, highlighting volatility and correlations. Significant factors influencing the share price are discussed, including market conditions and internal company strategies. Beta values and expected rates of return are calculated, along with the weighted average cost of capital (WACC). Debt ratios are examined over several years, and the dividend policy is outlined. A letter of recommendation is included, summarizing the investment potential based on the financial analysis. The analysis draws on the company's annual reports and industry research to provide a detailed and insightful assessment of Oz Minerals' financial health and investment prospects.
Running head: FINANCE FOR BUSINESS
Finance for Business
Name of the university
Name of the student
Authors note
Finance for Business
Name of the university
Name of the student
Authors note
Paraphrase This Document
Need a fresh take? Get an instant paraphrase of this document with our AI Paraphraser
1
FINANCE FOR BUSINESS
Table of Contents
Description of company:..................................................................................................................2
Ownership and governance structure of company:.........................................................................2
Calculation of performance ratios:..................................................................................................3
Two graphs with the description of results:.....................................................................................3
Significant factors influencing the share price of Oz Minerals:......................................................4
Calculation of Beta values and expected rate of returns:................................................................4
Weighted average cost of capital:....................................................................................................5
Debt ratios for the past two years:...................................................................................................5
Dividend policy:..............................................................................................................................6
Letter of recommendation:..............................................................................................................7
References list:.................................................................................................................................8
2
FINANCE FOR BUSINESS
Description of company:
Oz Minerals is a mining company that was formed after the merger of Zinifex and
Oxiana limited in year 2008 and is based in Adelaide in Australia. It is one of the largest deposits
of copper at Carrapateena. The strategy of organization is centered on value creation for a wide
range of stakeholders. Core product of company is Copper containing silver and gold. Mining
method used by Oz Minerals involves underground mining and open pit and employs processing
method such as grinding, conventional crushing and flotation (ozminerals.com 2018).. Product
produced by company is railed to port Adelaide, thereafter it is shipped to customers in Europe
and Asia, and then it is transported to domestic customers.
Ownership and governance structure of company:
From the annual report of Oz Minerals for year 2016, it can be seen that there are top
twenty investors of company. Shareholder holding more than 20% of shareholding is HSBC
custody nominees (Australia) Limited. It is the only shareholder having more than 20% of shares
and therefore, company will be classified as non-family company (ozminerals.com 2018).
Shareholders having higher than 5% shareholdings are JP Morgan Nominees Australia
limited and Citicorp Nominees Pty limited. Total numbers of shares held by these two
shareholders are 47613532 and 45349773 respectively.
Neil Hamilton is the Chairman and independent non-executive director of Oz minerals.
Andrew Cole is the chief executive officer and managing director of company. Other members
of board include Charles Lenegan, Julie Bebby, Paul Dowd, and Rebecca McGrath who is the
independent non-executive director (ozminerals.com 2018).
⊘ This is a preview!⊘
Do you want full access?
Subscribe today to unlock all pages.
Trusted by 1+ million students worldwide
3
FINANCE FOR BUSINESS
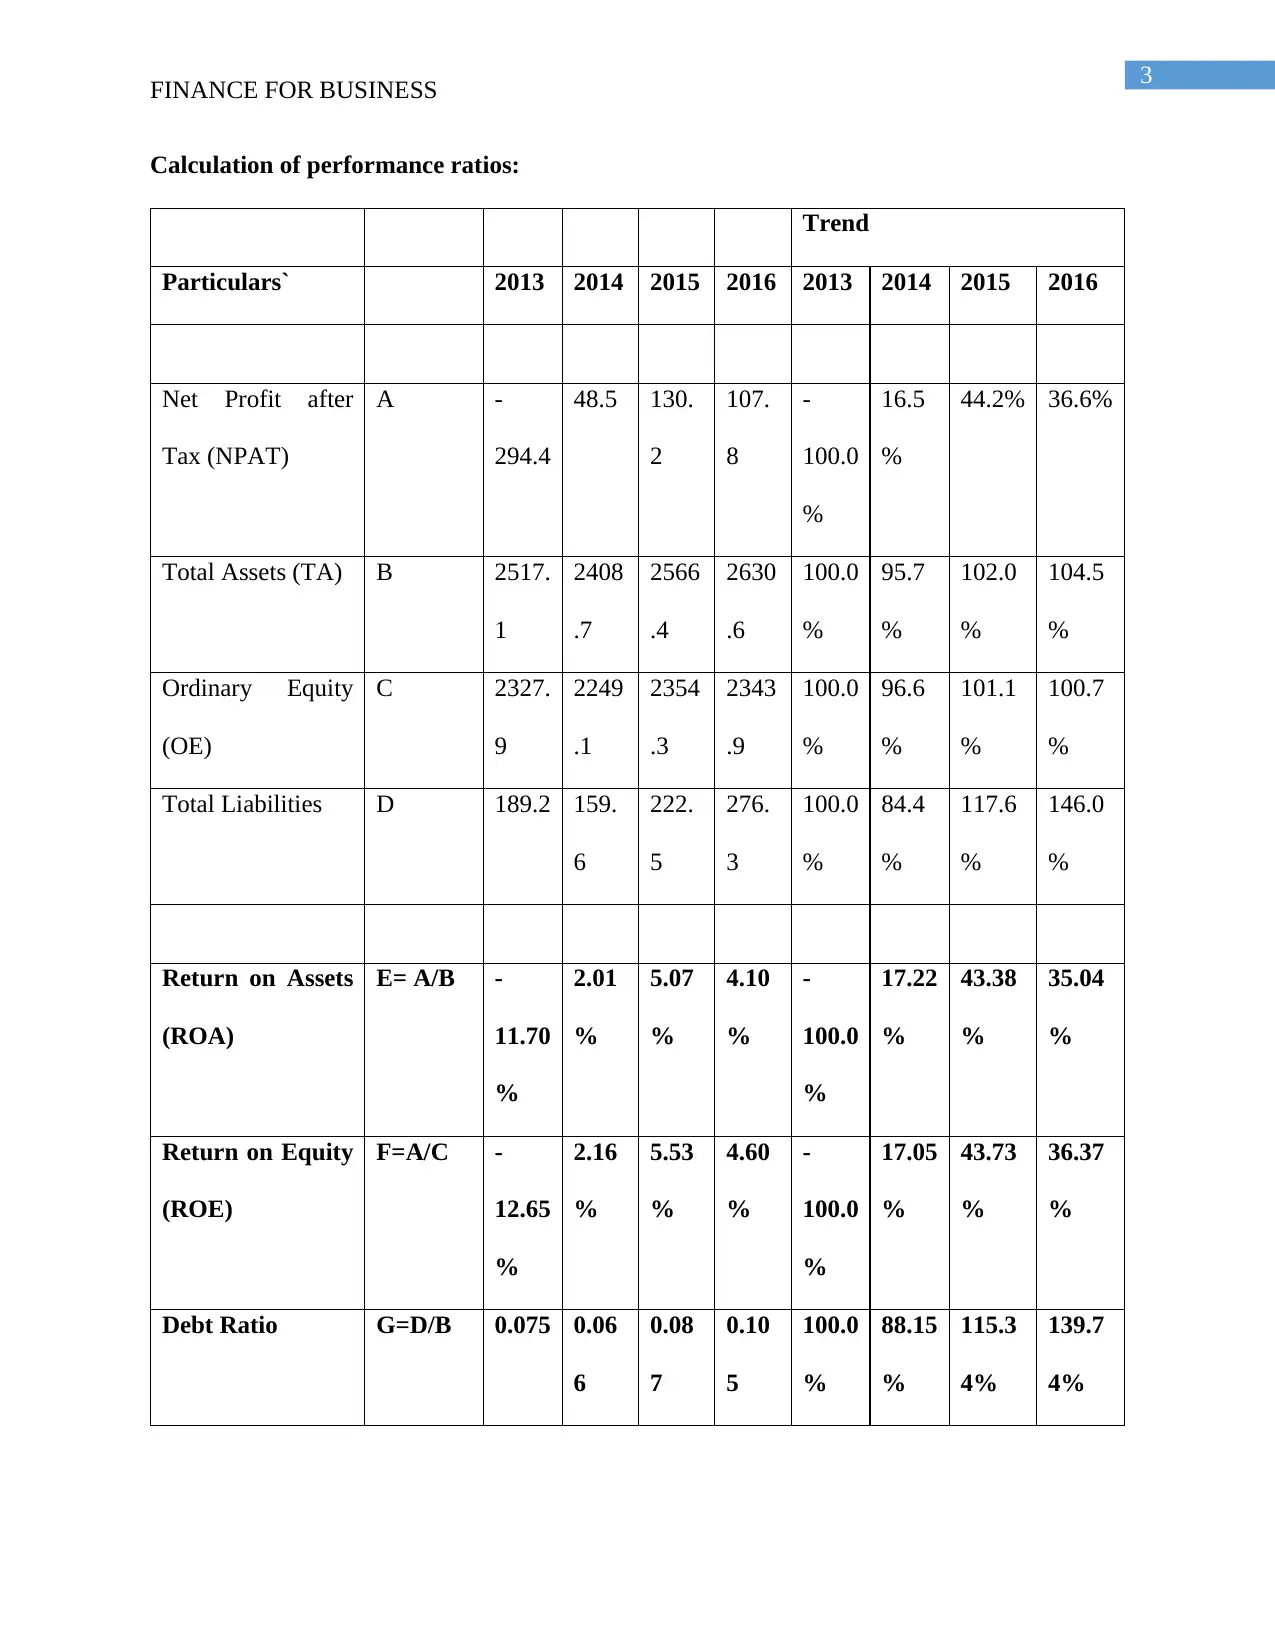
Calculation of performance ratios:
Trend
Particulars` 2013 2014 2015 2016 2013 2014 2015 2016
Net Profit after
Tax (NPAT)
A -
294.4
48.5 130.
2
107.
8
-
100.0
%
16.5
%
44.2% 36.6%
Total Assets (TA) B 2517.
1
2408
.7
2566
.4
2630
.6
100.0
%
95.7
%
102.0
%
104.5
%
Ordinary Equity
(OE)
C 2327.
9
2249
.1
2354
.3
2343
.9
100.0
%
96.6
%
101.1
%
100.7
%
Total Liabilities D 189.2 159.
6
222.
5
276.
3
100.0
%
84.4
%
117.6
%
146.0
%
Return on Assets
(ROA)
E= A/B -
11.70
%
2.01
%
5.07
%
4.10
%
-
100.0
%
17.22
%
43.38
%
35.04
%
Return on Equity
(ROE)
F=A/C -
12.65
%
2.16
%
5.53
%
4.60
%
-
100.0
%
17.05
%
43.73
%
36.37
%
Debt Ratio G=D/B 0.075 0.06
6
0.08
7
0.10
5
100.0
%
88.15
%
115.3
4%
139.7
4%
FINANCE FOR BUSINESS
Calculation of performance ratios:
Trend
Particulars` 2013 2014 2015 2016 2013 2014 2015 2016
Net Profit after
Tax (NPAT)
A -
294.4
48.5 130.
2
107.
8
-
100.0
%
16.5
%
44.2% 36.6%
Total Assets (TA) B 2517.
1
2408
.7
2566
.4
2630
.6
100.0
%
95.7
%
102.0
%
104.5
%
Ordinary Equity
(OE)
C 2327.
9
2249
.1
2354
.3
2343
.9
100.0
%
96.6
%
101.1
%
100.7
%
Total Liabilities D 189.2 159.
6
222.
5
276.
3
100.0
%
84.4
%
117.6
%
146.0
%
Return on Assets
(ROA)
E= A/B -
11.70
%
2.01
%
5.07
%
4.10
%
-
100.0
%
17.22
%
43.38
%
35.04
%
Return on Equity
(ROE)
F=A/C -
12.65
%
2.16
%
5.53
%
4.60
%
-
100.0
%
17.05
%
43.73
%
36.37
%
Debt Ratio G=D/B 0.075 0.06
6
0.08
7
0.10
5
100.0
%
88.15
%
115.3
4%
139.7
4%
Paraphrase This Document
Need a fresh take? Get an instant paraphrase of this document with our AI Paraphraser
4
FINANCE FOR BUSINESS
The variable TA indicates total assets and variable OE indicates ownership equity and
these two variables are interrelated with ROA and ROE. An increase in total value of assets with
value of net profit remaining same indicates that there will be reduction in return on assets as
they are not utilized efficiently for generating profits. An increase in value of assets with profit
remaining same will generate lower debt equity ratio and therefore, there will be higher return on
equity. Therefore, the value of ROE and ROA is determined by the total value of assets and total
value of equity.
From the above table, it can be seen that return on equity (ROE) is greater than return on
assets (ROA) for all the four years. Both the concepts depict the efficiency of organization in
using resources for generating assets. Return on equity is less than return on assets because of
lower value of total ordinary equities compared to total value of assets. A healthy organization
always has total value of assets more than total equity because the values of assets are more than
equity when liabilities of organization have reduced (Danes et al. 2016).
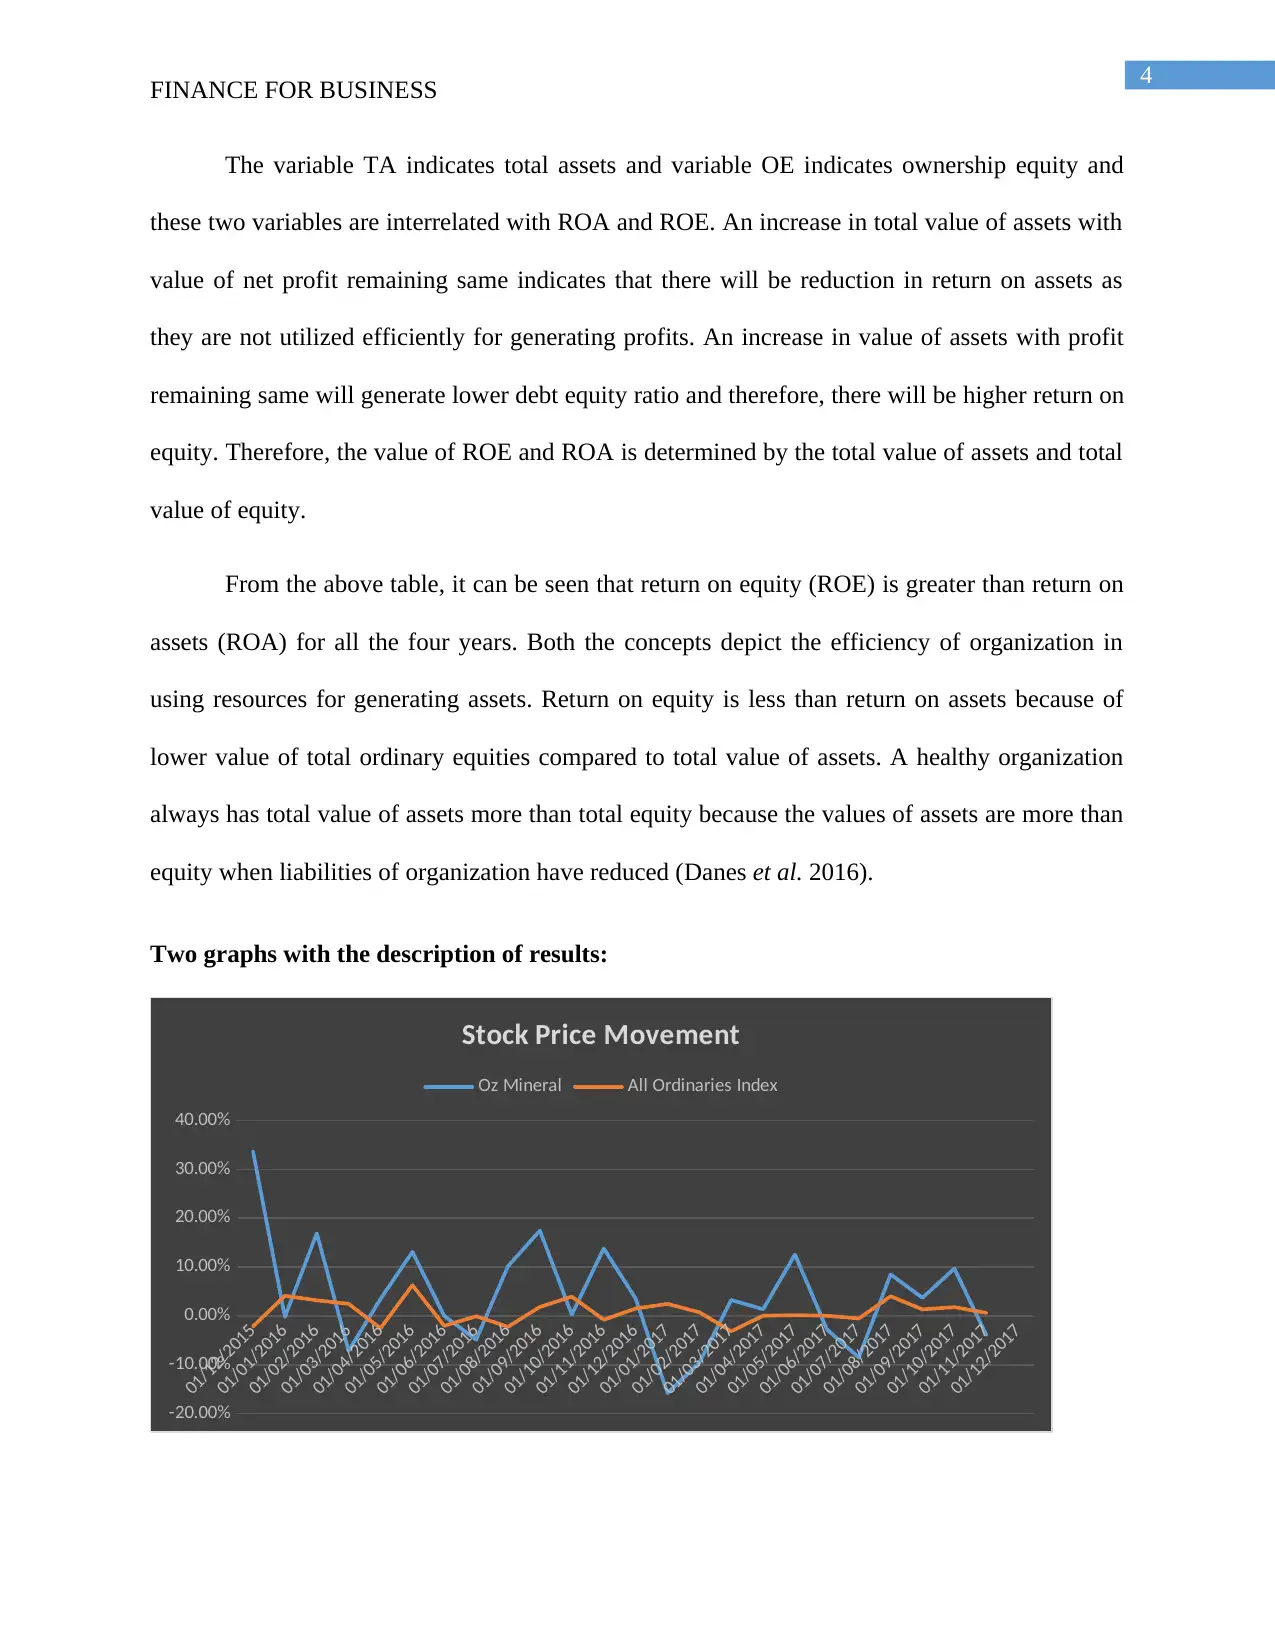
Two graphs with the description of results:
01/12/2015
01/01/2016
01/02/2016
01/03/2016
01/04/2016
01/05/2016
01/06/2016
01/07/2016
01/08/2016
01/09/2016
01/10/2016
01/11/2016
01/12/2016
01/01/2017
01/02/2017
01/03/2017
01/04/2017
01/05/2017
01/06/2017
01/07/2017
01/08/2017
01/09/2017
01/10/2017
01/11/2017
01/12/2017
-20.00%
-10.00%
0.00%
10.00%
20.00%
30.00%
40.00%
Stock Price Movement
Oz Mineral All Ordinaries Index
FINANCE FOR BUSINESS
The variable TA indicates total assets and variable OE indicates ownership equity and
these two variables are interrelated with ROA and ROE. An increase in total value of assets with
value of net profit remaining same indicates that there will be reduction in return on assets as
they are not utilized efficiently for generating profits. An increase in value of assets with profit
remaining same will generate lower debt equity ratio and therefore, there will be higher return on
equity. Therefore, the value of ROE and ROA is determined by the total value of assets and total
value of equity.
From the above table, it can be seen that return on equity (ROE) is greater than return on
assets (ROA) for all the four years. Both the concepts depict the efficiency of organization in
using resources for generating assets. Return on equity is less than return on assets because of
lower value of total ordinary equities compared to total value of assets. A healthy organization
always has total value of assets more than total equity because the values of assets are more than
equity when liabilities of organization have reduced (Danes et al. 2016).
Two graphs with the description of results:
01/12/2015
01/01/2016
01/02/2016
01/03/2016
01/04/2016
01/05/2016
01/06/2016
01/07/2016
01/08/2016
01/09/2016
01/10/2016
01/11/2016
01/12/2016
01/01/2017
01/02/2017
01/03/2017
01/04/2017
01/05/2017
01/06/2017
01/07/2017
01/08/2017
01/09/2017
01/10/2017
01/11/2017
01/12/2017
-20.00%
-10.00%
0.00%
10.00%
20.00%
30.00%
40.00%
Stock Price Movement
Oz Mineral All Ordinaries Index
5
FINANCE FOR BUSINESS
The above chart depicts the monthly share price movement of Oz Minerals over the past
two years. Blue line indicates the movement of share price of company while orange line depicts
the movement of all ordinaries index. Looking at the graph, it can be inferred that movement of
share price of company is more volatile compared to that of index that are less fluctuating over
the time period. Therefore, the monthly share price of Oz minerals is more volatile. In the initial
year till end of first month of year 2016, share price was volatile and they were above ordinaries
index price and in later year, monthly share price fluctuated but they were below the ordinaries
index. Line indicating share price of company is not closely correlated with that of line of
ordinaries index. However, in the last four months, share price of Oz Minerals were not much
volatile and in the current time, they are trading below all ordinaries index.
Significant factors influencing the share price of Oz Minerals:
The share price of influenced by many internal as well as external factors of economy.
Ongoing commercially sensitive negotiations and the intervention of government in supporting
palatable alternatives comprising of their party investment are some of the factors that have
influenced share price. Feature of investment vase of Oz minerals are due to strong operating
margins and reduction of cost assumptions. Poor outlook of company is illustrated by fall in
expectation of earning by company and a limited level of growth in revenue is likely to impact
the expected earnings resulting in negative growth rate. The unsustainable decline in earnings is
mainly attributable to the fact of exceeding of cost growth (Petty et al. 2015). Nonetheless,
insiders may have the conviction to buy the shares by perception of prosperous time ahead of the
period of investment.
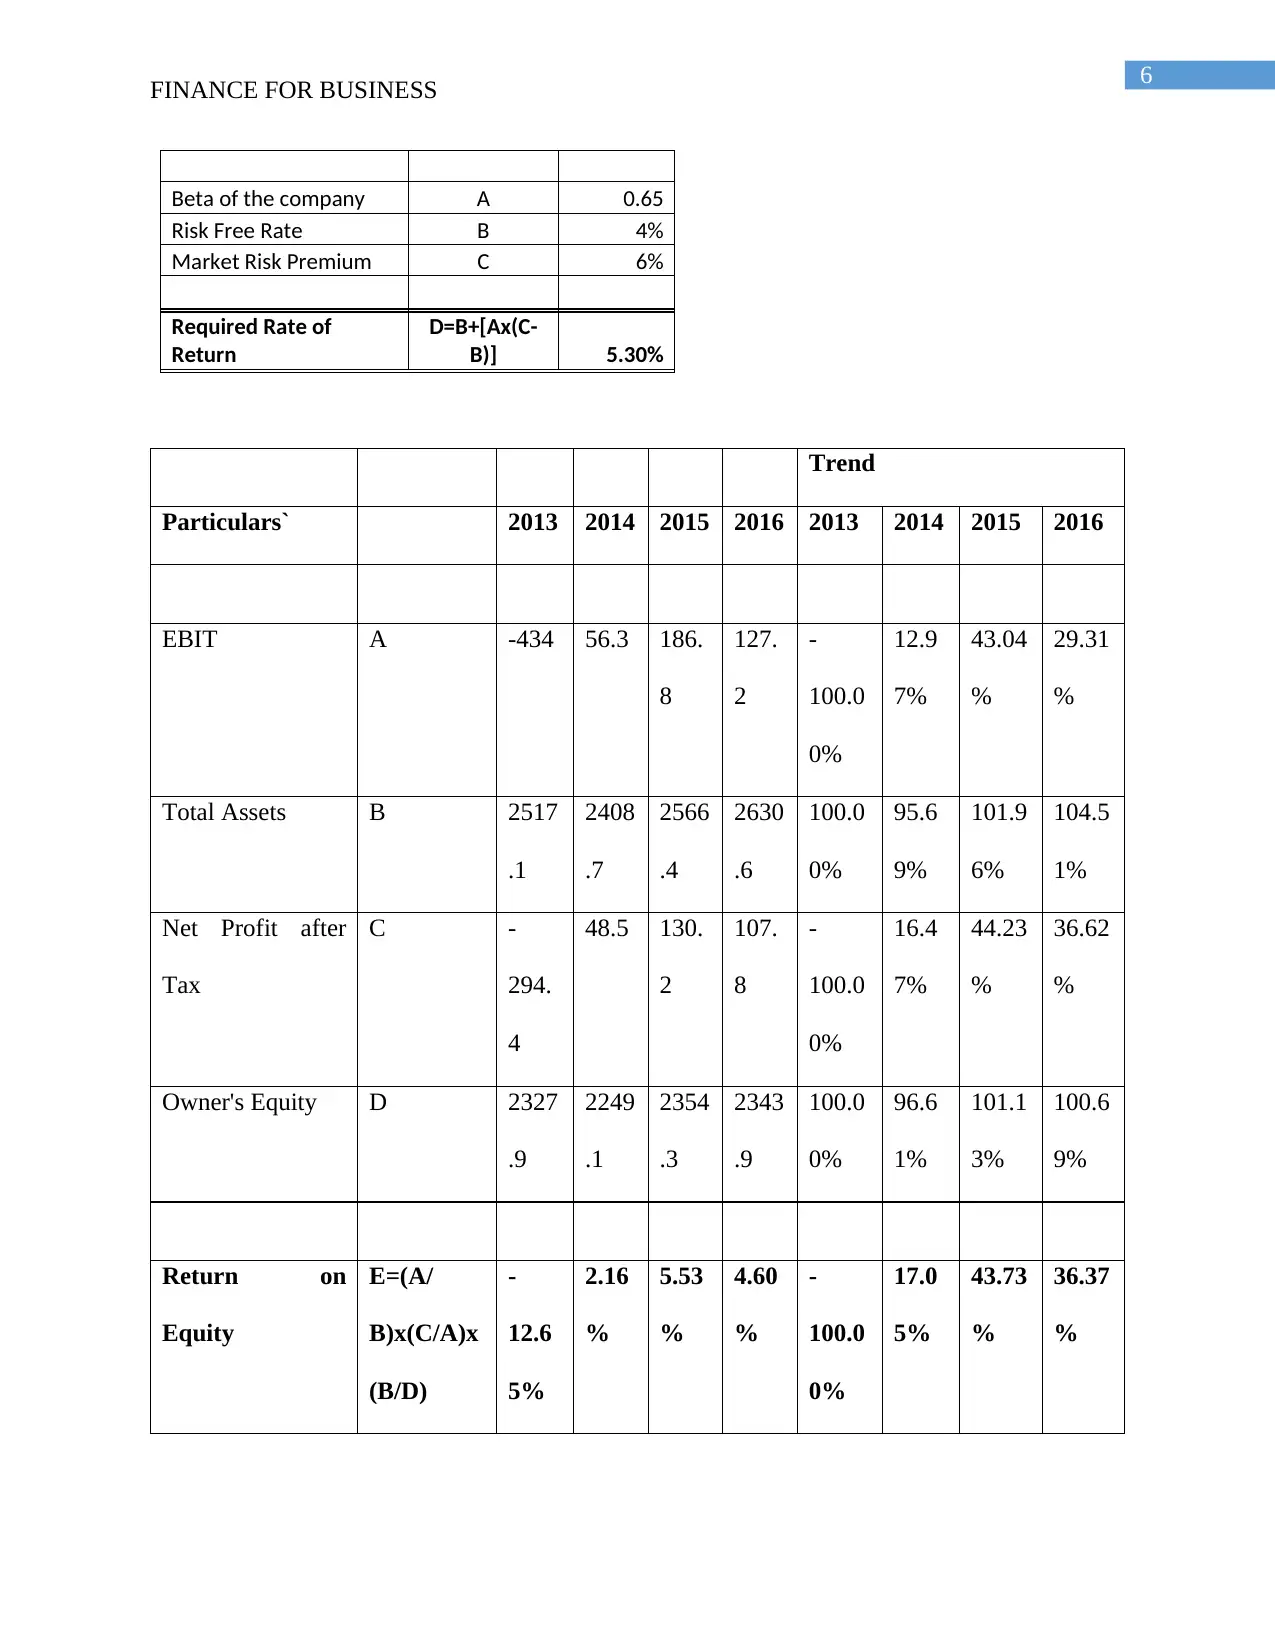
Calculation of Beta values and expected rate of returns:
Particulars Amount
FINANCE FOR BUSINESS
The above chart depicts the monthly share price movement of Oz Minerals over the past
two years. Blue line indicates the movement of share price of company while orange line depicts
the movement of all ordinaries index. Looking at the graph, it can be inferred that movement of
share price of company is more volatile compared to that of index that are less fluctuating over
the time period. Therefore, the monthly share price of Oz minerals is more volatile. In the initial
year till end of first month of year 2016, share price was volatile and they were above ordinaries
index price and in later year, monthly share price fluctuated but they were below the ordinaries
index. Line indicating share price of company is not closely correlated with that of line of
ordinaries index. However, in the last four months, share price of Oz Minerals were not much
volatile and in the current time, they are trading below all ordinaries index.
Significant factors influencing the share price of Oz Minerals:
The share price of influenced by many internal as well as external factors of economy.
Ongoing commercially sensitive negotiations and the intervention of government in supporting
palatable alternatives comprising of their party investment are some of the factors that have
influenced share price. Feature of investment vase of Oz minerals are due to strong operating
margins and reduction of cost assumptions. Poor outlook of company is illustrated by fall in
expectation of earning by company and a limited level of growth in revenue is likely to impact
the expected earnings resulting in negative growth rate. The unsustainable decline in earnings is
mainly attributable to the fact of exceeding of cost growth (Petty et al. 2015). Nonetheless,
insiders may have the conviction to buy the shares by perception of prosperous time ahead of the
period of investment.
Calculation of Beta values and expected rate of returns:
Particulars Amount
⊘ This is a preview!⊘
Do you want full access?
Subscribe today to unlock all pages.
Trusted by 1+ million students worldwide
6
FINANCE FOR BUSINESS
Beta of the company A 0.65
Risk Free Rate B 4%
Market Risk Premium C 6%
Required Rate of
Return
D=B+[Ax(C-
B)] 5.30%
Trend
Particulars` 2013 2014 2015 2016 2013 2014 2015 2016
EBIT A -434 56.3 186.
8
127.
2
-
100.0
0%
12.9
7%
43.04
%
29.31
%
Total Assets B 2517
.1
2408
.7
2566
.4
2630
.6
100.0
0%
95.6
9%
101.9
6%
104.5
1%
Net Profit after
Tax
C -
294.
4
48.5 130.
2
107.
8
-
100.0
0%
16.4
7%
44.23
%
36.62
%
Owner's Equity D 2327
.9
2249
.1
2354
.3
2343
.9
100.0
0%
96.6
1%
101.1
3%
100.6
9%
Return on
Equity
E=(A/
B)x(C/A)x
(B/D)
-
12.6
5%
2.16
%
5.53
%
4.60
%
-
100.0
0%
17.0
5%
43.73
%
36.37
%
Paraphrase This Document
Need a fresh take? Get an instant paraphrase of this document with our AI Paraphraser
7
FINANCE FOR BUSINESS
Beta is the factor for measuring the rate of return of stock of company and it helps in
explaining systematic risk and stock volatility. Conservative investment is a type of investment
where the return is nit fluctuated and they guarantee to investors a given amount of return. When
looking at beta value of Oz Minerals that stands at 0.65 is indicative of the fat that excess return
of stock is expected to perform .45 worse than expected return of market that is index. Low beta
value depicts that investment is conservative as the market related risk is low. Performance of
company is associated with mining stocks and price of minerals compared to overall stock
market (Thomas et al. 2015). Therefore the company has chosen a conservative investment
strategy.
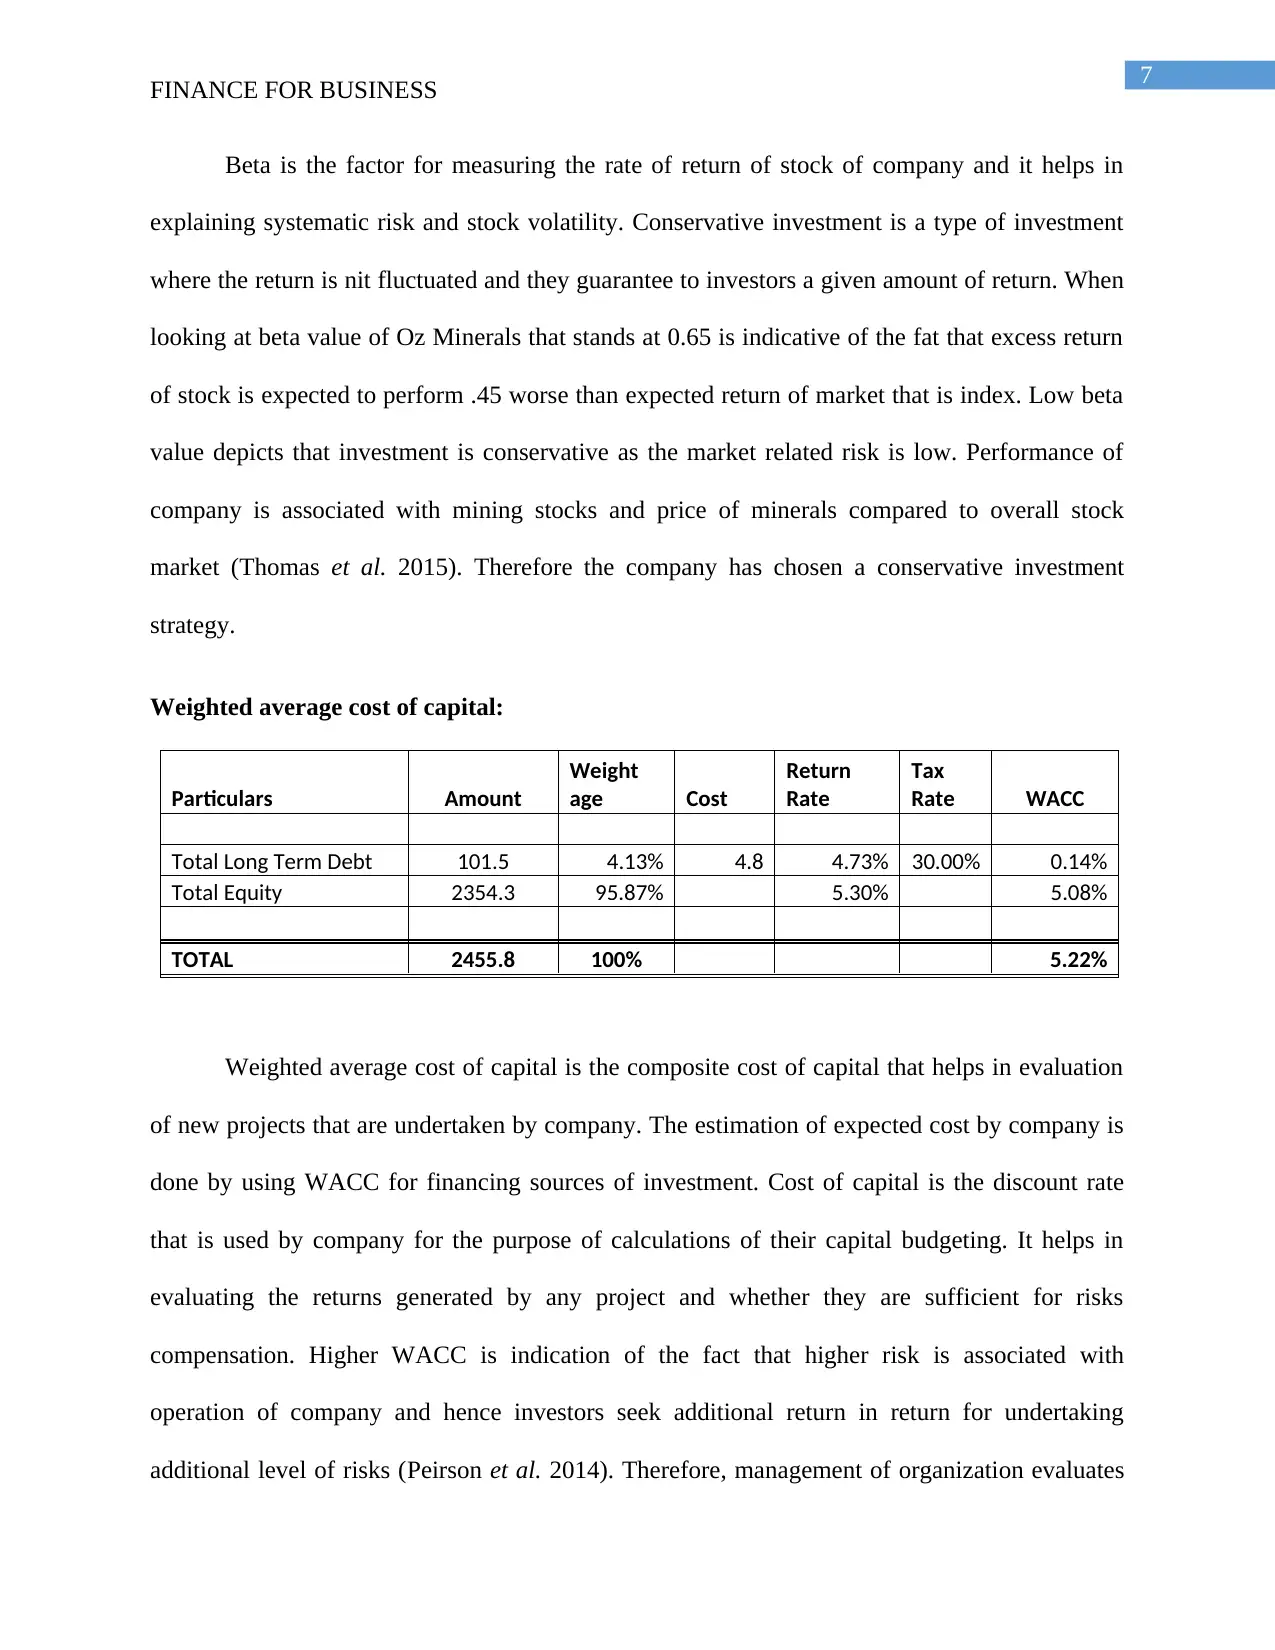
Weighted average cost of capital:
Particulars Amount
Weight
age Cost
Return
Rate
Tax
Rate WACC
Total Long Term Debt 101.5 4.13% 4.8 4.73% 30.00% 0.14%
Total Equity 2354.3 95.87% 5.30% 5.08%
TOTAL 2455.8 100% 5.22%
Weighted average cost of capital is the composite cost of capital that helps in evaluation
of new projects that are undertaken by company. The estimation of expected cost by company is
done by using WACC for financing sources of investment. Cost of capital is the discount rate
that is used by company for the purpose of calculations of their capital budgeting. It helps in
evaluating the returns generated by any project and whether they are sufficient for risks
compensation. Higher WACC is indication of the fact that higher risk is associated with
operation of company and hence investors seek additional return in return for undertaking
additional level of risks (Peirson et al. 2014). Therefore, management of organization evaluates
FINANCE FOR BUSINESS
Beta is the factor for measuring the rate of return of stock of company and it helps in
explaining systematic risk and stock volatility. Conservative investment is a type of investment
where the return is nit fluctuated and they guarantee to investors a given amount of return. When
looking at beta value of Oz Minerals that stands at 0.65 is indicative of the fat that excess return
of stock is expected to perform .45 worse than expected return of market that is index. Low beta
value depicts that investment is conservative as the market related risk is low. Performance of
company is associated with mining stocks and price of minerals compared to overall stock
market (Thomas et al. 2015). Therefore the company has chosen a conservative investment
strategy.
Weighted average cost of capital:
Particulars Amount
Weight
age Cost
Return
Rate
Tax
Rate WACC
Total Long Term Debt 101.5 4.13% 4.8 4.73% 30.00% 0.14%
Total Equity 2354.3 95.87% 5.30% 5.08%
TOTAL 2455.8 100% 5.22%
Weighted average cost of capital is the composite cost of capital that helps in evaluation
of new projects that are undertaken by company. The estimation of expected cost by company is
done by using WACC for financing sources of investment. Cost of capital is the discount rate
that is used by company for the purpose of calculations of their capital budgeting. It helps in
evaluating the returns generated by any project and whether they are sufficient for risks
compensation. Higher WACC is indication of the fact that higher risk is associated with
operation of company and hence investors seek additional return in return for undertaking
additional level of risks (Peirson et al. 2014). Therefore, management of organization evaluates
8
FINANCE FOR BUSINESS
the higher weighted cost of capital to be associated with carrying higher level of risk and hence
investors seeking higher return for compensation the additional level of risks that they are
undertaking
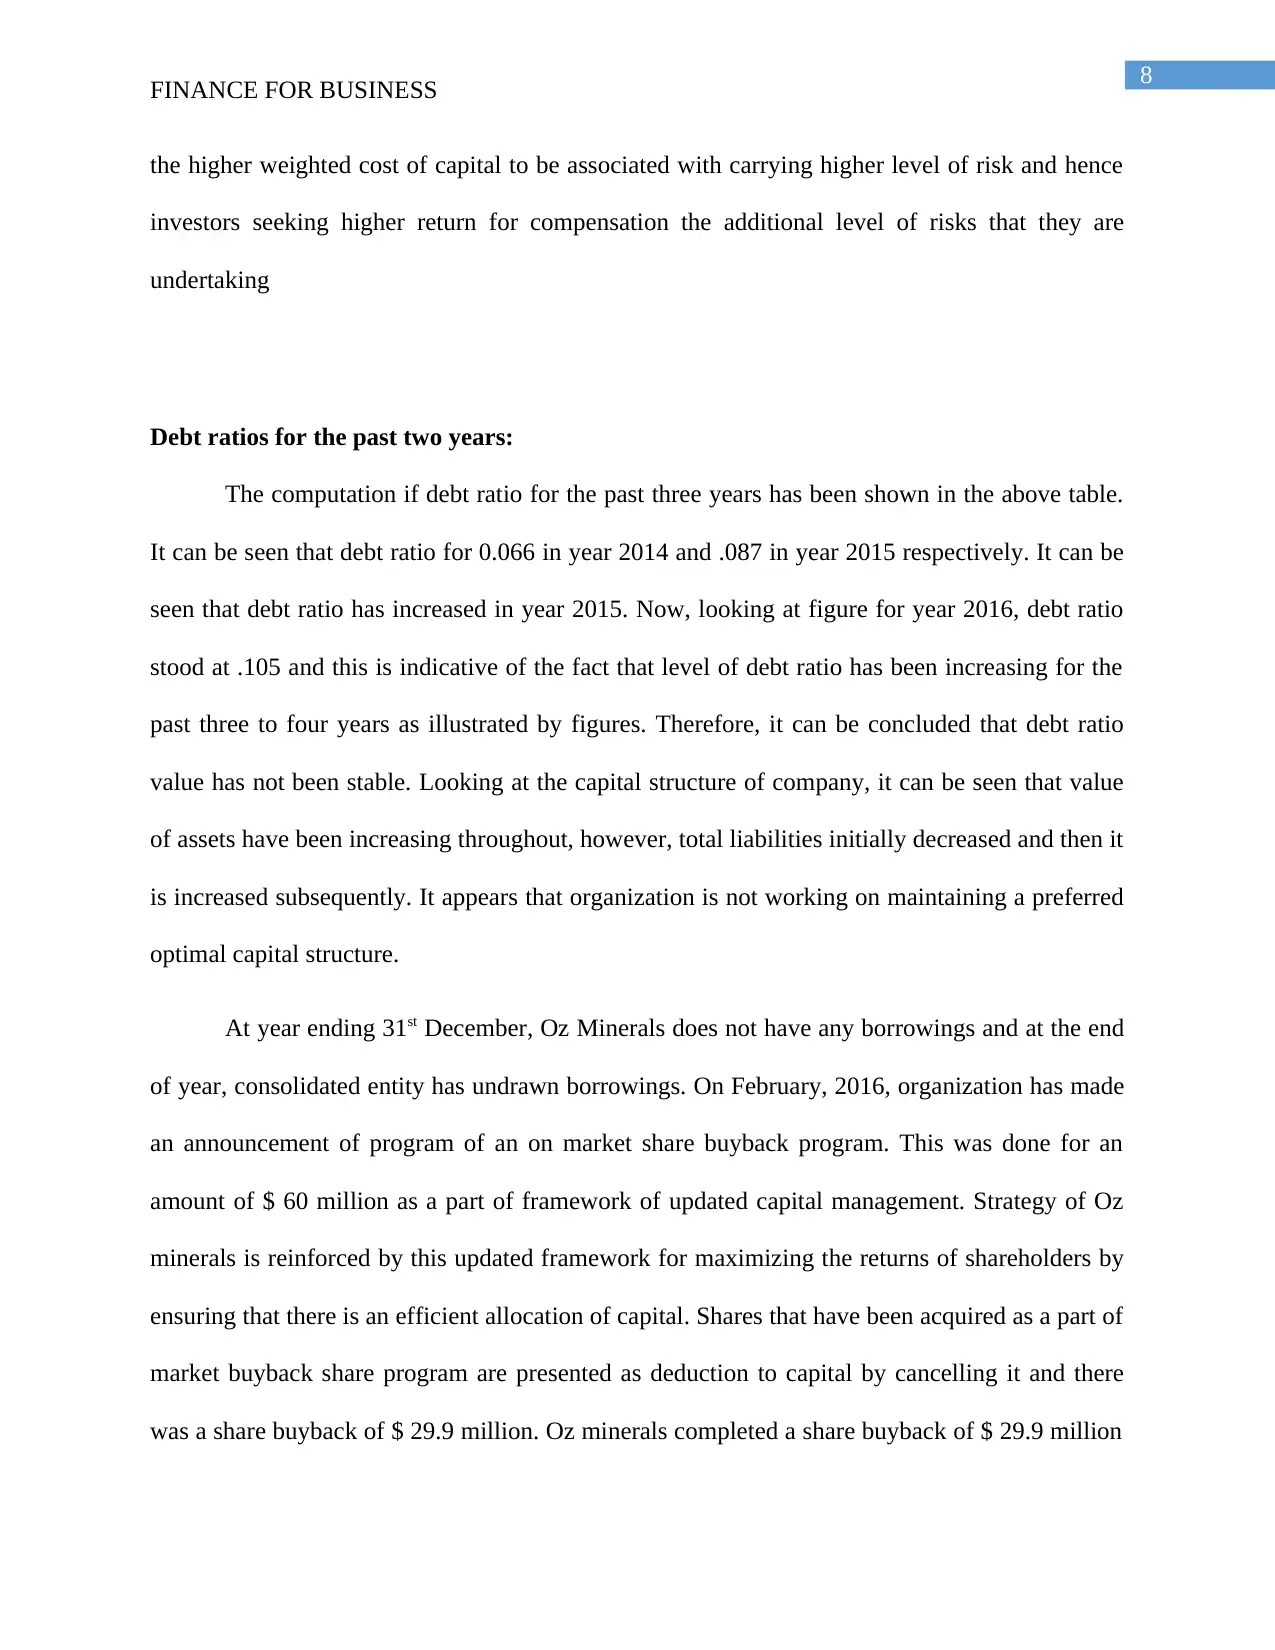
Debt ratios for the past two years:
The computation if debt ratio for the past three years has been shown in the above table.
It can be seen that debt ratio for 0.066 in year 2014 and .087 in year 2015 respectively. It can be
seen that debt ratio has increased in year 2015. Now, looking at figure for year 2016, debt ratio
stood at .105 and this is indicative of the fact that level of debt ratio has been increasing for the
past three to four years as illustrated by figures. Therefore, it can be concluded that debt ratio
value has not been stable. Looking at the capital structure of company, it can be seen that value
of assets have been increasing throughout, however, total liabilities initially decreased and then it
is increased subsequently. It appears that organization is not working on maintaining a preferred
optimal capital structure.
At year ending 31st December, Oz Minerals does not have any borrowings and at the end
of year, consolidated entity has undrawn borrowings. On February, 2016, organization has made
an announcement of program of an on market share buyback program. This was done for an
amount of $ 60 million as a part of framework of updated capital management. Strategy of Oz
minerals is reinforced by this updated framework for maximizing the returns of shareholders by
ensuring that there is an efficient allocation of capital. Shares that have been acquired as a part of
market buyback share program are presented as deduction to capital by cancelling it and there
was a share buyback of $ 29.9 million. Oz minerals completed a share buyback of $ 29.9 million
FINANCE FOR BUSINESS
the higher weighted cost of capital to be associated with carrying higher level of risk and hence
investors seeking higher return for compensation the additional level of risks that they are
undertaking
Debt ratios for the past two years:
The computation if debt ratio for the past three years has been shown in the above table.
It can be seen that debt ratio for 0.066 in year 2014 and .087 in year 2015 respectively. It can be
seen that debt ratio has increased in year 2015. Now, looking at figure for year 2016, debt ratio
stood at .105 and this is indicative of the fact that level of debt ratio has been increasing for the
past three to four years as illustrated by figures. Therefore, it can be concluded that debt ratio
value has not been stable. Looking at the capital structure of company, it can be seen that value
of assets have been increasing throughout, however, total liabilities initially decreased and then it
is increased subsequently. It appears that organization is not working on maintaining a preferred
optimal capital structure.
At year ending 31st December, Oz Minerals does not have any borrowings and at the end
of year, consolidated entity has undrawn borrowings. On February, 2016, organization has made
an announcement of program of an on market share buyback program. This was done for an
amount of $ 60 million as a part of framework of updated capital management. Strategy of Oz
minerals is reinforced by this updated framework for maximizing the returns of shareholders by
ensuring that there is an efficient allocation of capital. Shares that have been acquired as a part of
market buyback share program are presented as deduction to capital by cancelling it and there
was a share buyback of $ 29.9 million. Oz minerals completed a share buyback of $ 29.9 million
⊘ This is a preview!⊘
Do you want full access?
Subscribe today to unlock all pages.
Trusted by 1+ million students worldwide
9
FINANCE FOR BUSINESS
of a $ 60 million share through the program (ozminerals.com 2018). There was a repurchasing of
shares of total amount of $ 4.8 million at an average share price of $ 6.23. Yes, the adjustments
that have been made to shares by share buyback programs have been mentioned in the director’s
report as presented in the annual report of company.
Dividend policy:
The dividend policy that has been implemented by the management of Oz minerals’ is in
accordance with the corporation Act and rules that are listed on Australian stock exchange.
Payment of dividend is done by considering the outlined principles and ensuring the fair trading
of securities of Oz minerals. There has not been any recognition of the financial impact of paying
dividend in the consolidated financial statement for the year ending 31st December, 2016. For the
purpose of Australian taxation, final year dividend has been fully franked. Implementing the
dividend policy as prescribed by principles of Australian stock exchange and corporation act has
been dine for maintaining compliance so that they are not facing compliance issues (MAcc
2017).
Letter of recommendation:
Dear ABC,
Queensland
Australia
Respected Sir,
After conducting detailed analysis of financial performance of Oz minerals in terms of
their debt structure, leverage, share price, I would like to present my view on forming this
Paraphrase This Document
Need a fresh take? Get an instant paraphrase of this document with our AI Paraphraser
10
FINANCE FOR BUSINESS
company as a part of your investment portfolio. Looking the ratios computed, it can be seen that
ROE and ROA is increasing and has been stable in these few years. Debt ratio has increased
indicating increase in total liabilities, but this is not unfavorable for investors seeking investment.
This is so because organization has employed conservative strategy and hence it will not be risky
for investors including it in their portfolio of stocks. In recent years, price of shares have also
increased 6.39 for year ending 2016 and increasing to 8.8 for year ending 2017. This increase
can be regarded as significant for investors to be included in their investment portfolio.
Moreover, looking at beta and weighted average cost of capital for Oz minerals, it can be seen
that investing is not risky and stock would be generating reasonable return.
Therefore, I would recommend Mr ABC to include Oz minerals to in his/her investment
portfolio.
Thanking you,
ABC
Investment Company
11
FINANCE FOR BUSINESS
References list:
Bekaert, G. and Hodrick, R., 2017. International financial management. Cambridge University
Press.
Brigham, E.F. and Daves, P.R., 2014. Intermediate Financial Management. Cengage Learning.
Brooke, M.Z., 2016. Handbook of international financial management. Springer.
Danes, S.M., Garbow, J. and Jokela, B.H., 2016. Financial management and culture: the
American Indian Case. Journal of Financial Counseling and Planning, 27(1), p.61.
Dennis, V. and Walcott, J., 2014. Federal financial management shared services: The move is on.
The Journal of Government Financial Management, 63(3), p.18.
Editorial, R. (2018). ${Instrument_CompanyName} ${Instrument_Ric} Quote| Reuters.com.
[online] U.S. Available at: https://www.reuters.com/finance/stocks/overview/OZL.AX [Accessed
13 Jan. 2018].
Finance.yahoo.com. (2018). OZL.AX : Summary for OZMINER FPO - Yahoo Finance. [online]
Available at: https://finance.yahoo.com/quote/ozl.ax?ltr=1 [Accessed 13 Jan. 2018].
Irimia-Dieguez, A.I., Medina-Lopez, C. and Alfalla-Luque, R., 2015. Financial Management of
large projects: A research gap. Procedia Economics and finance, 23, pp.652-657.
⊘ This is a preview!⊘
Do you want full access?
Subscribe today to unlock all pages.
Trusted by 1+ million students worldwide
1 out of 13
Related Documents


Your All-in-One AI-Powered Toolkit for Academic Success.
+13062052269
info@desklib.com
Available 24*7 on WhatsApp / Email
![[object Object]](/_next/static/media/star-bottom.7253800d.svg)
Unlock your academic potential
Copyright © 2020–2026 A2Z Services. All Rights Reserved. Developed and managed by ZUCOL.