OZ Bread: Logistics and Supply Chain Management Report Analysis
VerifiedAdded on 2020/10/23
|16
|3218
|119
Report
AI Summary
This report provides a detailed analysis of OZ Bread's supply chain management, focusing on the expansion of its business through various scenarios. The analysis includes a budgeted plan for each scenario, evaluating fixed, variable, and transportation costs over three years. Scenario A involves a new plant, while Scenarios B and C introduce different cost structures and operational strategies. The report compares the total operational costs, construction expenses, and potential scrap values to determine the most profitable scenario for OZ Bread. The findings highlight the importance of managing operational expenses to maximize profitability. The report concludes with an action plan recommending the most cost-effective approach for OZ Bread, emphasizing the significance of lower fixed and variable costs in the initial year of operation. The report is a valuable resource for understanding supply chain optimization and financial planning in a business context.
LOGISTICS AND SUPPLY
CHAIN MANAGEMENT
CHAIN MANAGEMENT
Paraphrase This Document
Need a fresh take? Get an instant paraphrase of this document with our AI Paraphraser
TABLE OF CONTENTS
INTRODUCTION...........................................................................................................................1
Scenario A.......................................................................................................................................1
Budgeted plan:.............................................................................................................................1
Scenario A year 2.........................................................................................................................2
Scenario A year 3.........................................................................................................................3
Scenario B........................................................................................................................................4
Budgeted plan for Scenario B......................................................................................................4
Scenario B year 1:........................................................................................................................4
Scenario B year 2.........................................................................................................................4
Scenario B year 3.........................................................................................................................5
Scenario C........................................................................................................................................6
Budgeted plan for Scenario C......................................................................................................6
Scenario C year 1:........................................................................................................................6
Scenario C year 2.........................................................................................................................7
Scenario C year 3.........................................................................................................................7
Action Plan......................................................................................................................................8
CONCLUSION................................................................................................................................8
REFERENCES................................................................................................................................9
APPENDIX....................................................................................................................................10
SCENARIO A...............................................................................................................................10
SCENARIO B................................................................................................................................11
SCENARIO C................................................................................................................................12
INTRODUCTION
Managing a supply chain operation would be effective for an organisation in relation with managing the costs spend on
inventories as well as organisational operations which are to be conducted as per making an accurate ascertainment over the business
operations. in relation with the case study of OZ bread which is wishes to expand their business at various location on which there has
been creation of several scenarios. The present report will define the profitability will retain by the business through its operational
scenarios in all 3 years. There will be recommendations based on the outcomes on which a suitable scenario would be recommended
to client for having adequate gains through business operations.
Scenario A
In accordance with this scenario on which Mentone baking plant has been keeping the ideas as they would not make both the
breads and cakes (Kshetri, 2018). However, there would be recommendations based on the new plant for the next three years. It will
be relevant with the location on which they would have built, produce and serve the shops. As per the outcomes which were being
presented in the scenarios there are various issues on the basis of year to year analysis. (As listed in appendix)
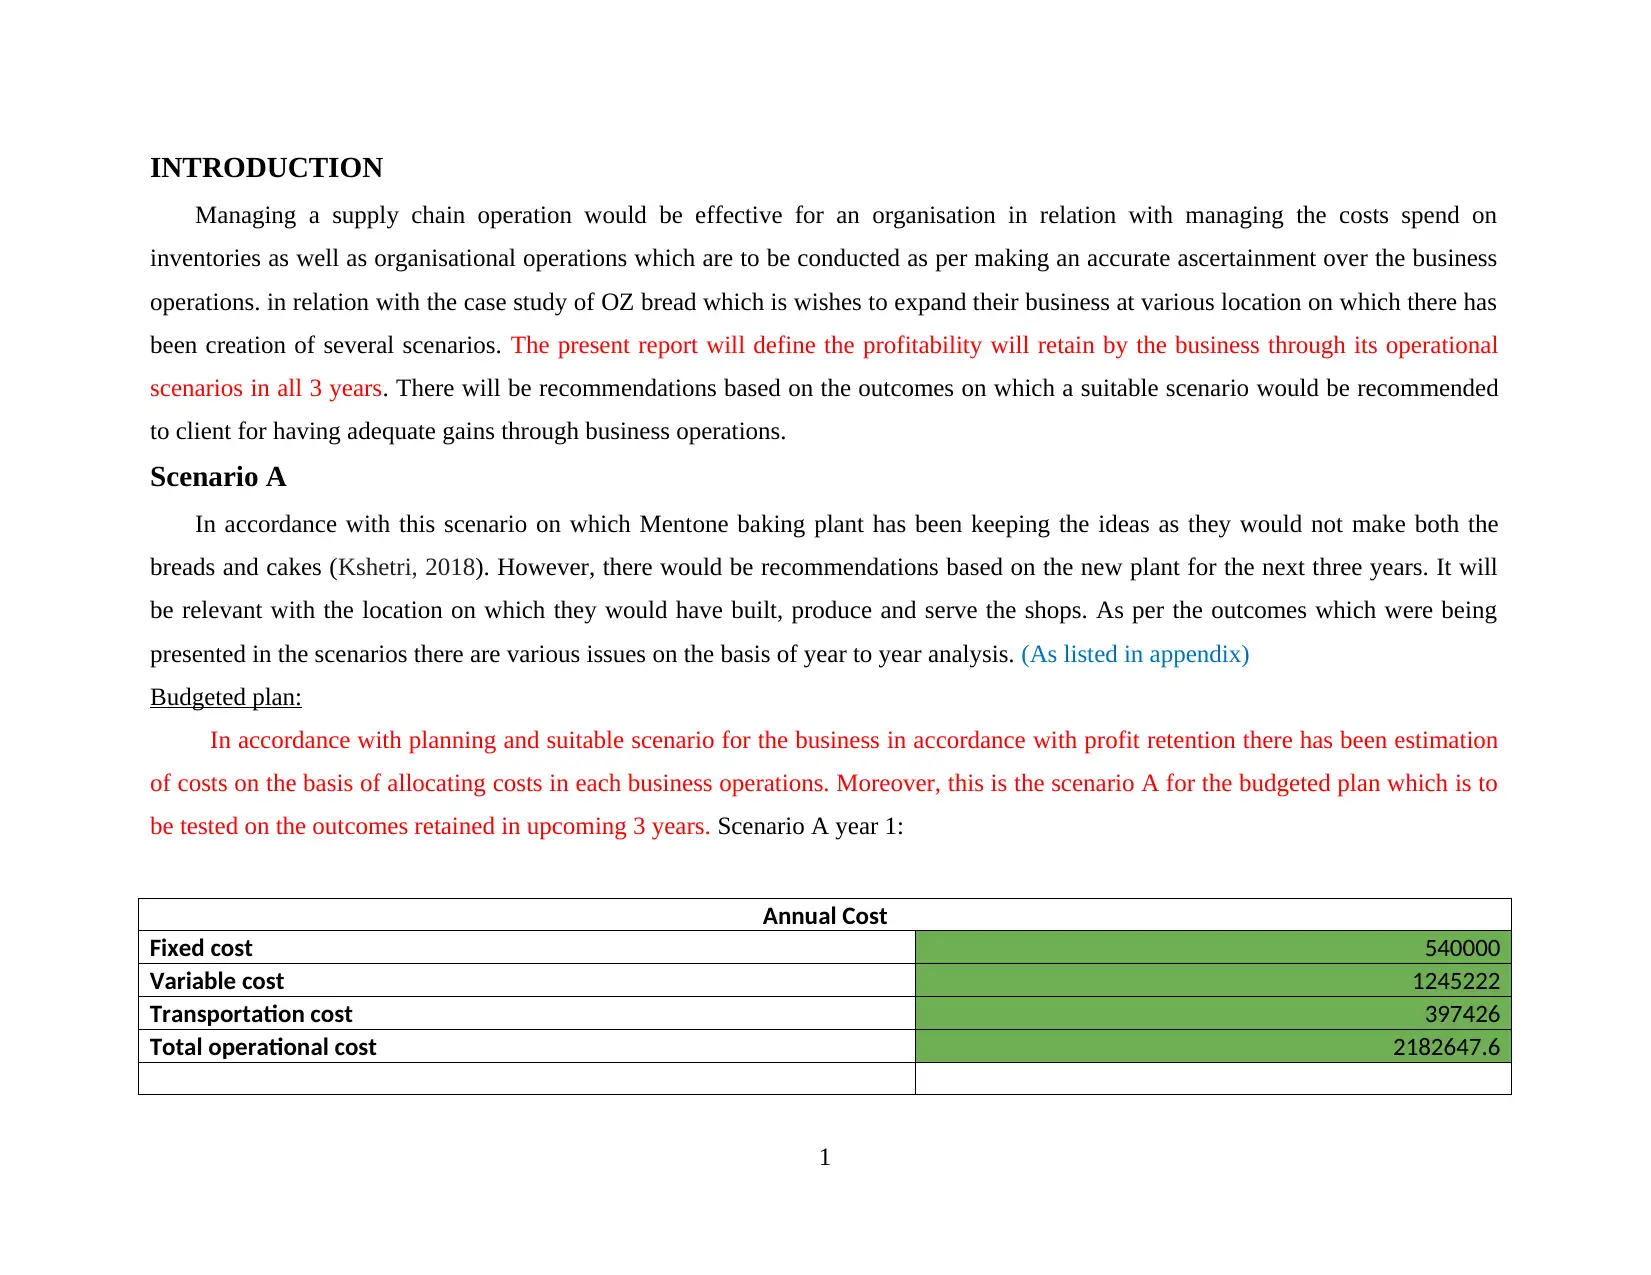
Budgeted plan:
In accordance with planning and suitable scenario for the business in accordance with profit retention there has been estimation
of costs on the basis of allocating costs in each business operations. Moreover, this is the scenario A for the budgeted plan which is to
be tested on the outcomes retained in upcoming 3 years. Scenario A year 1:
Annual Cost
Fixed cost 540000
Variable cost 1245222
Transportation cost 397426
Total operational cost 2182647.6
1
Managing a supply chain operation would be effective for an organisation in relation with managing the costs spend on
inventories as well as organisational operations which are to be conducted as per making an accurate ascertainment over the business
operations. in relation with the case study of OZ bread which is wishes to expand their business at various location on which there has
been creation of several scenarios. The present report will define the profitability will retain by the business through its operational
scenarios in all 3 years. There will be recommendations based on the outcomes on which a suitable scenario would be recommended
to client for having adequate gains through business operations.
Scenario A
In accordance with this scenario on which Mentone baking plant has been keeping the ideas as they would not make both the
breads and cakes (Kshetri, 2018). However, there would be recommendations based on the new plant for the next three years. It will
be relevant with the location on which they would have built, produce and serve the shops. As per the outcomes which were being
presented in the scenarios there are various issues on the basis of year to year analysis. (As listed in appendix)
Budgeted plan:
In accordance with planning and suitable scenario for the business in accordance with profit retention there has been estimation
of costs on the basis of allocating costs in each business operations. Moreover, this is the scenario A for the budgeted plan which is to
be tested on the outcomes retained in upcoming 3 years. Scenario A year 1:
Annual Cost
Fixed cost 540000
Variable cost 1245222
Transportation cost 397426
Total operational cost 2182647.6
1
⊘ This is a preview!⊘
Do you want full access?
Subscribe today to unlock all pages.
Trusted by 1+ million students worldwide
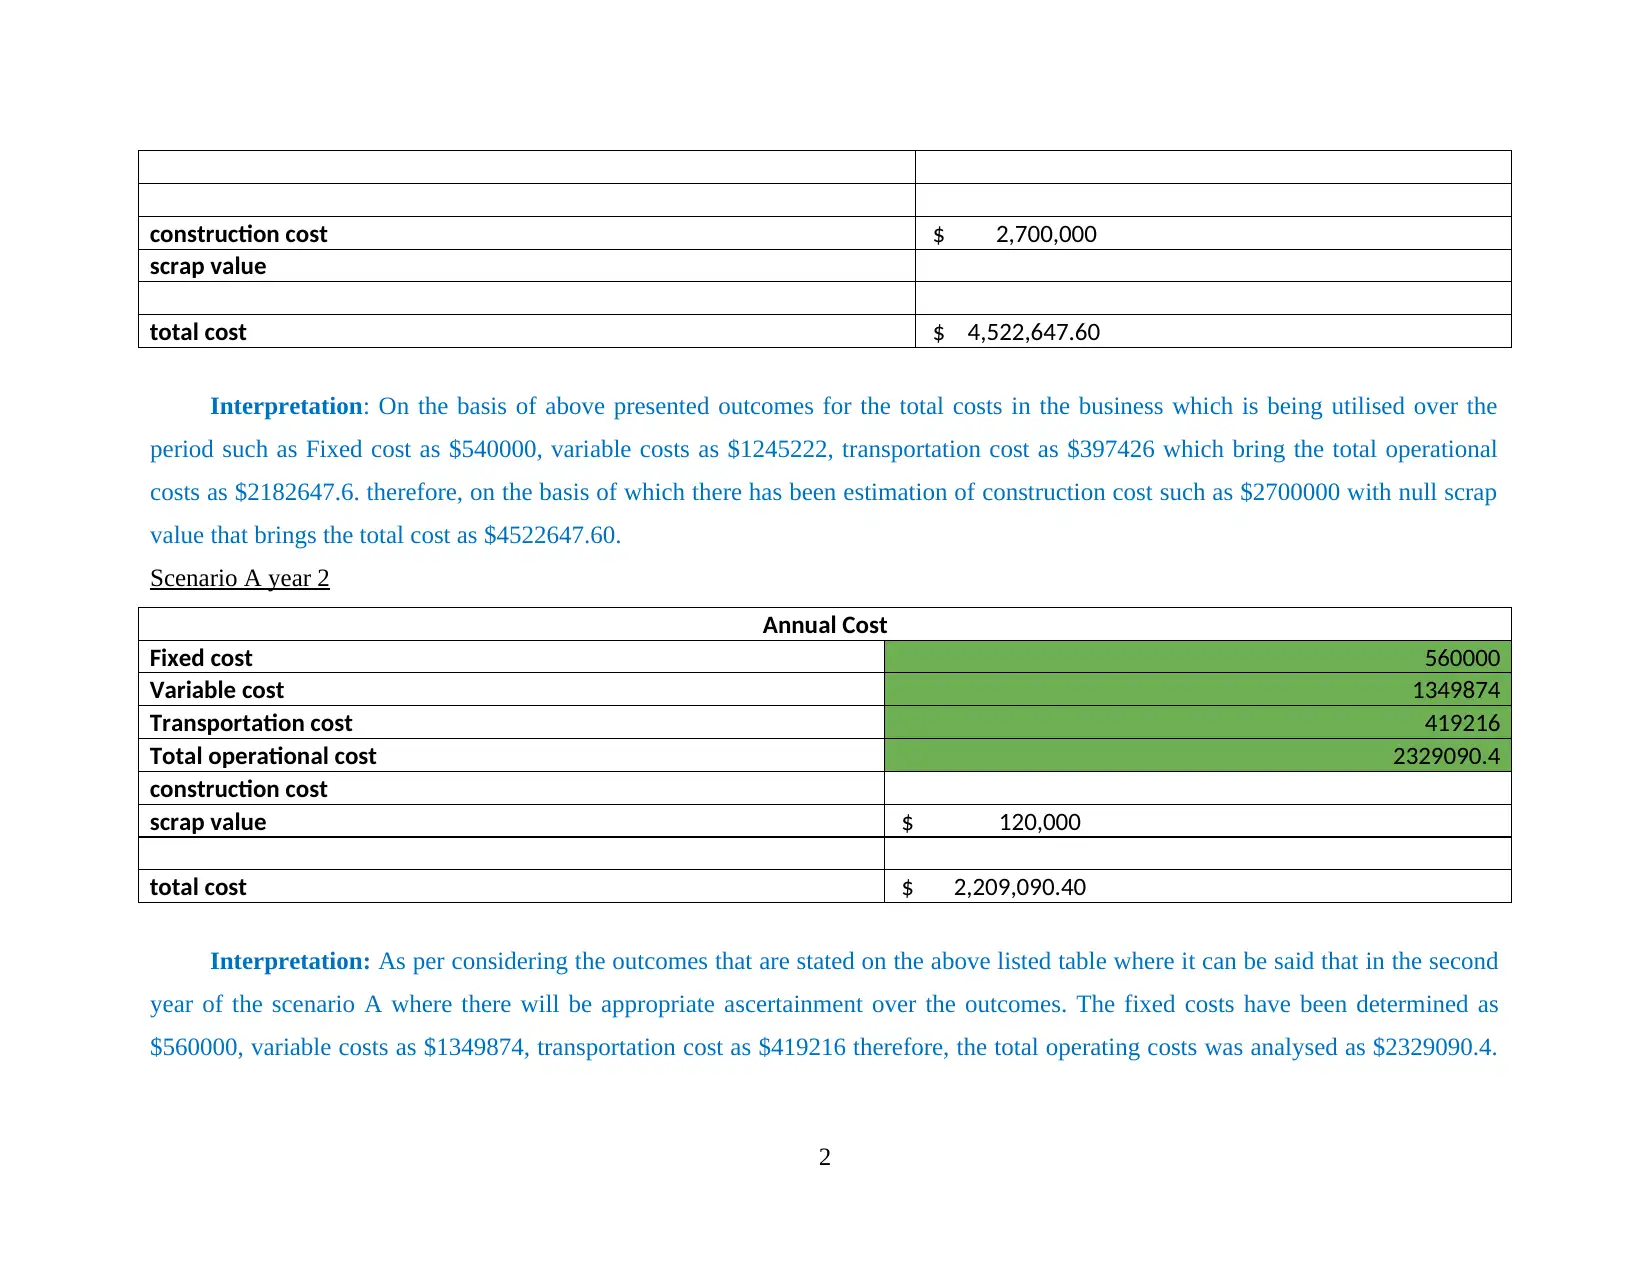
construction cost $ 2,700,000
scrap value
total cost $ 4,522,647.60
Interpretation: On the basis of above presented outcomes for the total costs in the business which is being utilised over the
period such as Fixed cost as $540000, variable costs as $1245222, transportation cost as $397426 which bring the total operational
costs as $2182647.6. therefore, on the basis of which there has been estimation of construction cost such as $2700000 with null scrap
value that brings the total cost as $4522647.60.
Scenario A year 2
Annual Cost
Fixed cost 560000
Variable cost 1349874
Transportation cost 419216
Total operational cost 2329090.4
construction cost
scrap value $ 120,000
total cost $ 2,209,090.40
Interpretation: As per considering the outcomes that are stated on the above listed table where it can be said that in the second
year of the scenario A where there will be appropriate ascertainment over the outcomes. The fixed costs have been determined as
$560000, variable costs as $1349874, transportation cost as $419216 therefore, the total operating costs was analysed as $2329090.4.
2
Paraphrase This Document
Need a fresh take? Get an instant paraphrase of this document with our AI Paraphraser
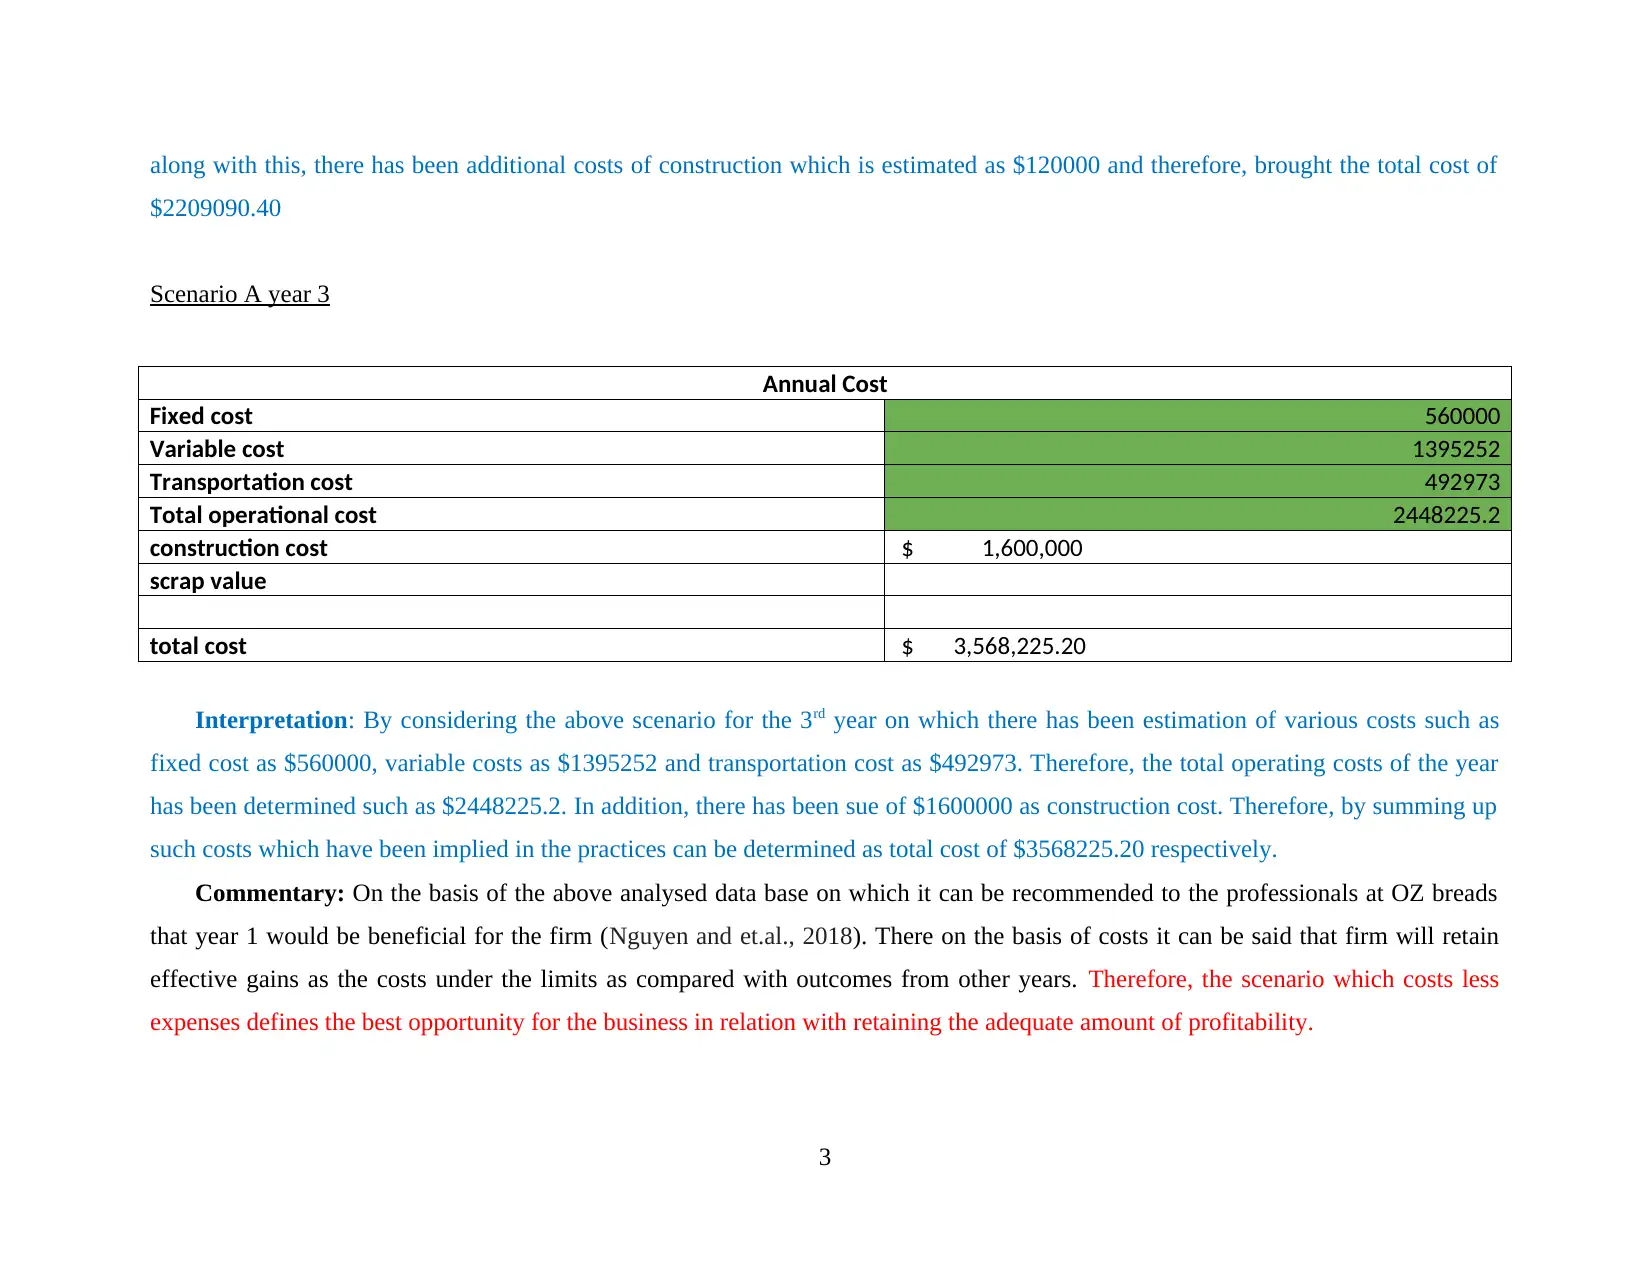
along with this, there has been additional costs of construction which is estimated as $120000 and therefore, brought the total cost of
$2209090.40
Scenario A year 3
Annual Cost
Fixed cost 560000
Variable cost 1395252
Transportation cost 492973
Total operational cost 2448225.2
construction cost $ 1,600,000
scrap value
total cost $ 3,568,225.20
Interpretation: By considering the above scenario for the 3rd year on which there has been estimation of various costs such as
fixed cost as $560000, variable costs as $1395252 and transportation cost as $492973. Therefore, the total operating costs of the year
has been determined such as $2448225.2. In addition, there has been sue of $1600000 as construction cost. Therefore, by summing up
such costs which have been implied in the practices can be determined as total cost of $3568225.20 respectively.
Commentary: On the basis of the above analysed data base on which it can be recommended to the professionals at OZ breads
that year 1 would be beneficial for the firm (Nguyen and et.al., 2018). There on the basis of costs it can be said that firm will retain
effective gains as the costs under the limits as compared with outcomes from other years. Therefore, the scenario which costs less
expenses defines the best opportunity for the business in relation with retaining the adequate amount of profitability.
3
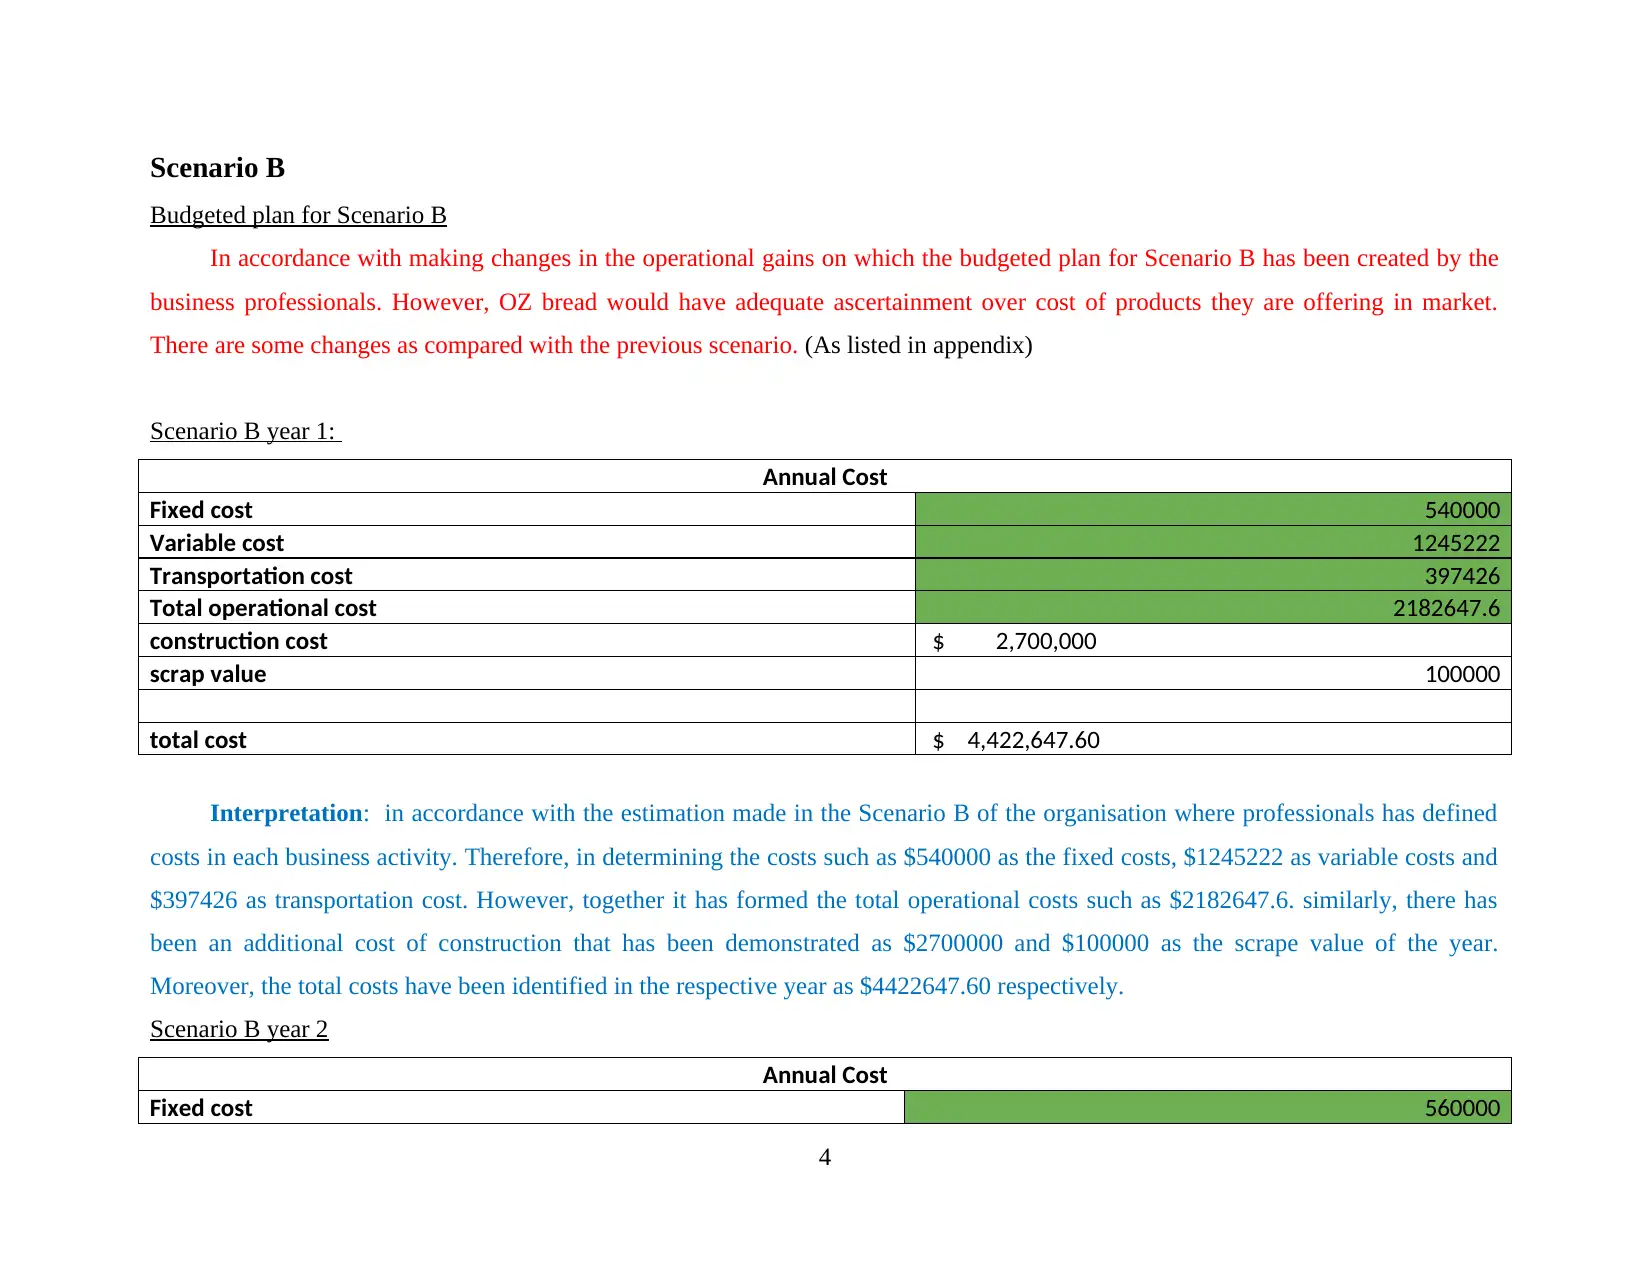
Scenario B
Budgeted plan for Scenario B
In accordance with making changes in the operational gains on which the budgeted plan for Scenario B has been created by the
business professionals. However, OZ bread would have adequate ascertainment over cost of products they are offering in market.
There are some changes as compared with the previous scenario. (As listed in appendix)
Scenario B year 1:
Annual Cost
Fixed cost 540000
Variable cost 1245222
Transportation cost 397426
Total operational cost 2182647.6
construction cost $ 2,700,000
scrap value 100000
total cost $ 4,422,647.60
Interpretation: in accordance with the estimation made in the Scenario B of the organisation where professionals has defined
costs in each business activity. Therefore, in determining the costs such as $540000 as the fixed costs, $1245222 as variable costs and
$397426 as transportation cost. However, together it has formed the total operational costs such as $2182647.6. similarly, there has
been an additional cost of construction that has been demonstrated as $2700000 and $100000 as the scrape value of the year.
Moreover, the total costs have been identified in the respective year as $4422647.60 respectively.
Scenario B year 2
Annual Cost
Fixed cost 560000
4
⊘ This is a preview!⊘
Do you want full access?
Subscribe today to unlock all pages.
Trusted by 1+ million students worldwide
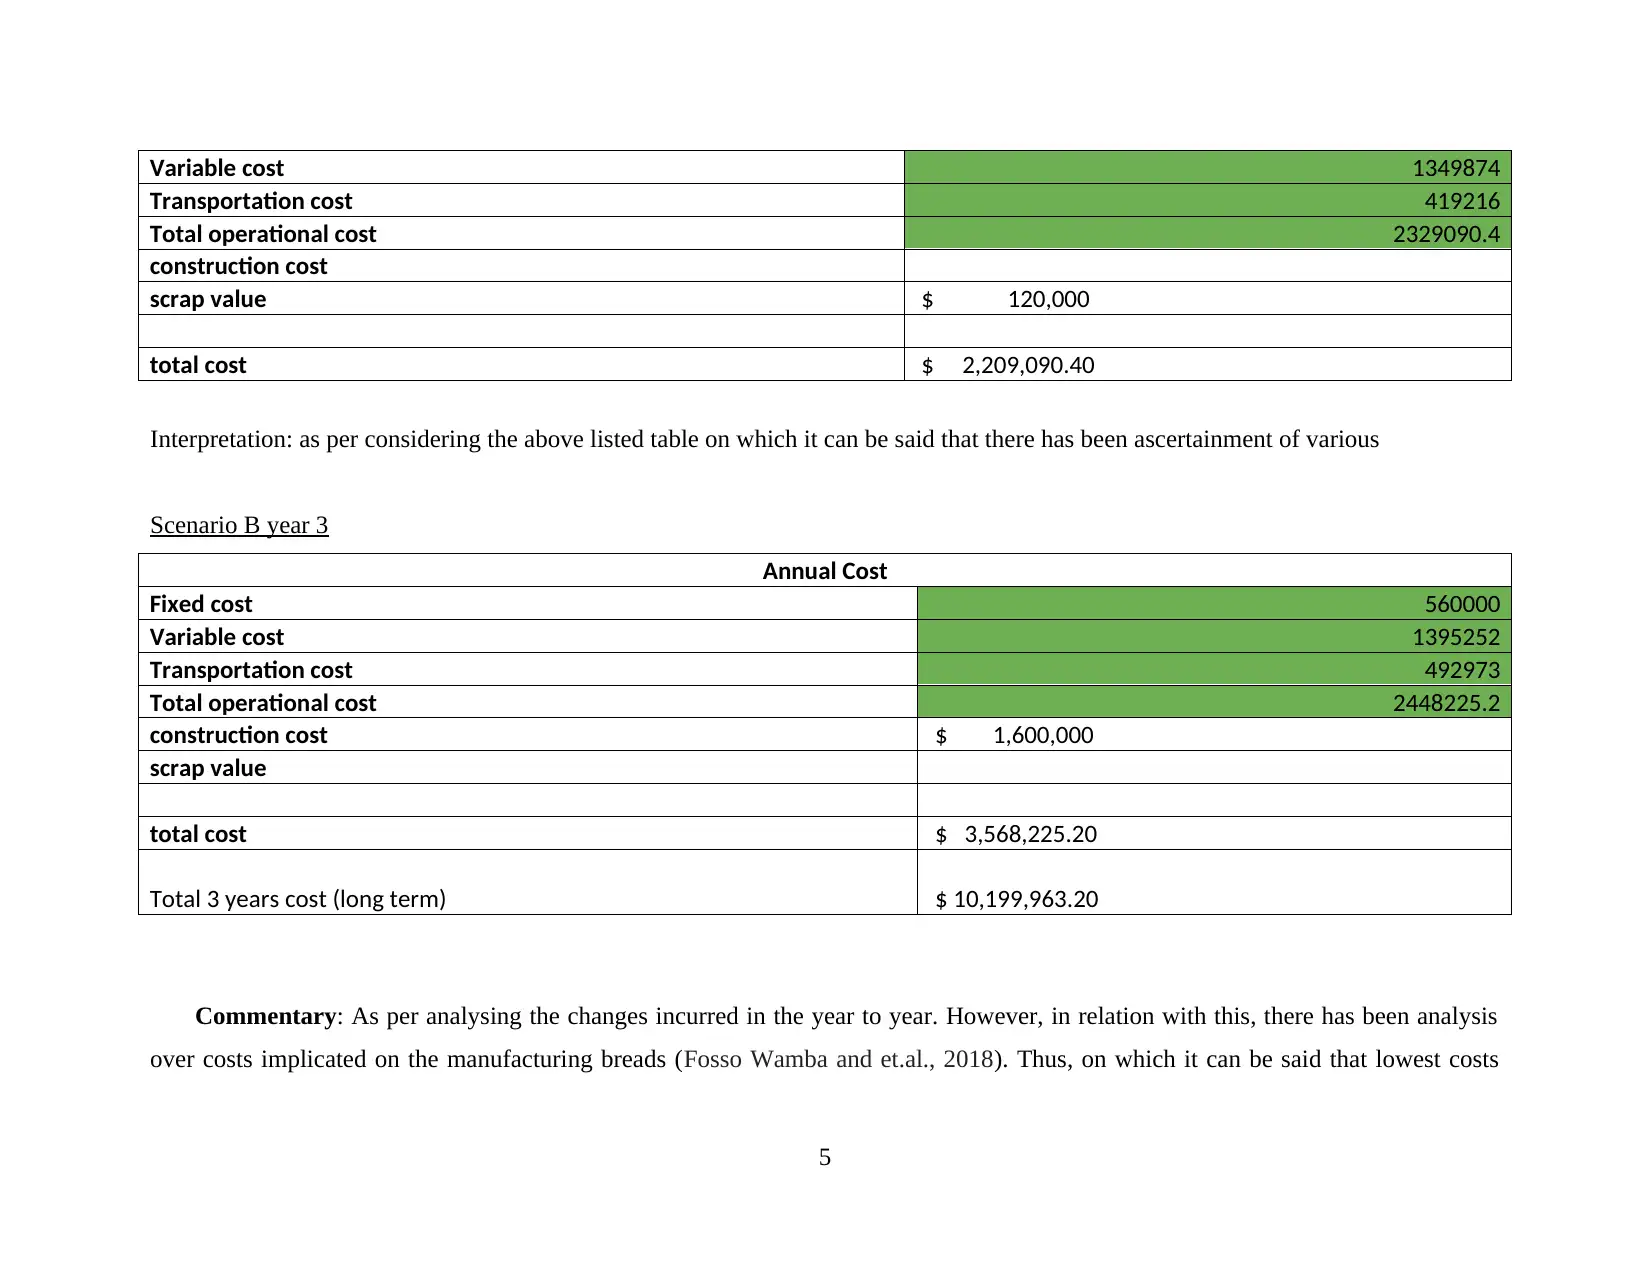
Variable cost 1349874
Transportation cost 419216
Total operational cost 2329090.4
construction cost
scrap value $ 120,000
total cost $ 2,209,090.40
Interpretation: as per considering the above listed table on which it can be said that there has been ascertainment of various
Scenario B year 3
Annual Cost
Fixed cost 560000
Variable cost 1395252
Transportation cost 492973
Total operational cost 2448225.2
construction cost $ 1,600,000
scrap value
total cost $ 3,568,225.20
Total 3 years cost (long term) $ 10,199,963.20
Commentary: As per analysing the changes incurred in the year to year. However, in relation with this, there has been analysis
over costs implicated on the manufacturing breads (Fosso Wamba and et.al., 2018). Thus, on which it can be said that lowest costs
5
Paraphrase This Document
Need a fresh take? Get an instant paraphrase of this document with our AI Paraphraser
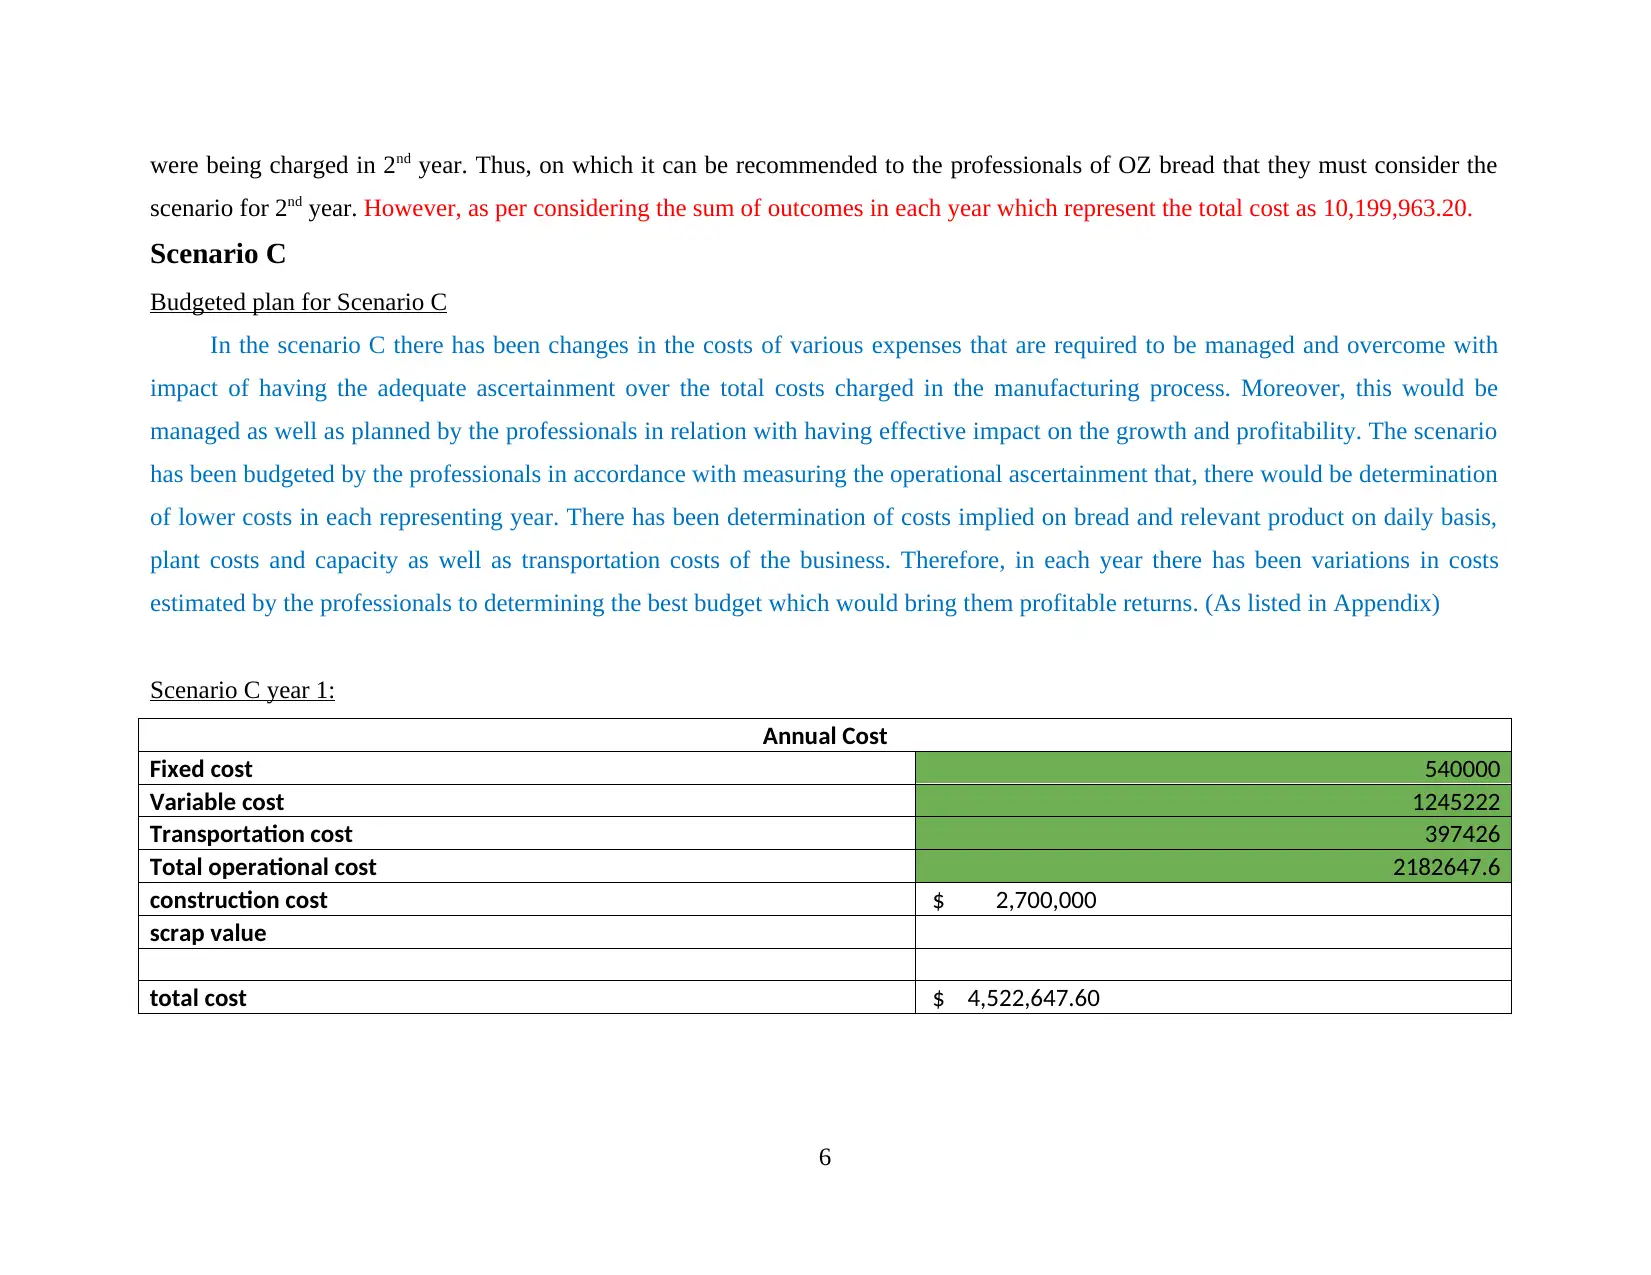
were being charged in 2nd year. Thus, on which it can be recommended to the professionals of OZ bread that they must consider the
scenario for 2nd year. However, as per considering the sum of outcomes in each year which represent the total cost as 10,199,963.20.
Scenario C
Budgeted plan for Scenario C
In the scenario C there has been changes in the costs of various expenses that are required to be managed and overcome with
impact of having the adequate ascertainment over the total costs charged in the manufacturing process. Moreover, this would be
managed as well as planned by the professionals in relation with having effective impact on the growth and profitability. The scenario
has been budgeted by the professionals in accordance with measuring the operational ascertainment that, there would be determination
of lower costs in each representing year. There has been determination of costs implied on bread and relevant product on daily basis,
plant costs and capacity as well as transportation costs of the business. Therefore, in each year there has been variations in costs
estimated by the professionals to determining the best budget which would bring them profitable returns. (As listed in Appendix)
Scenario C year 1:
Annual Cost
Fixed cost 540000
Variable cost 1245222
Transportation cost 397426
Total operational cost 2182647.6
construction cost $ 2,700,000
scrap value
total cost $ 4,522,647.60
6
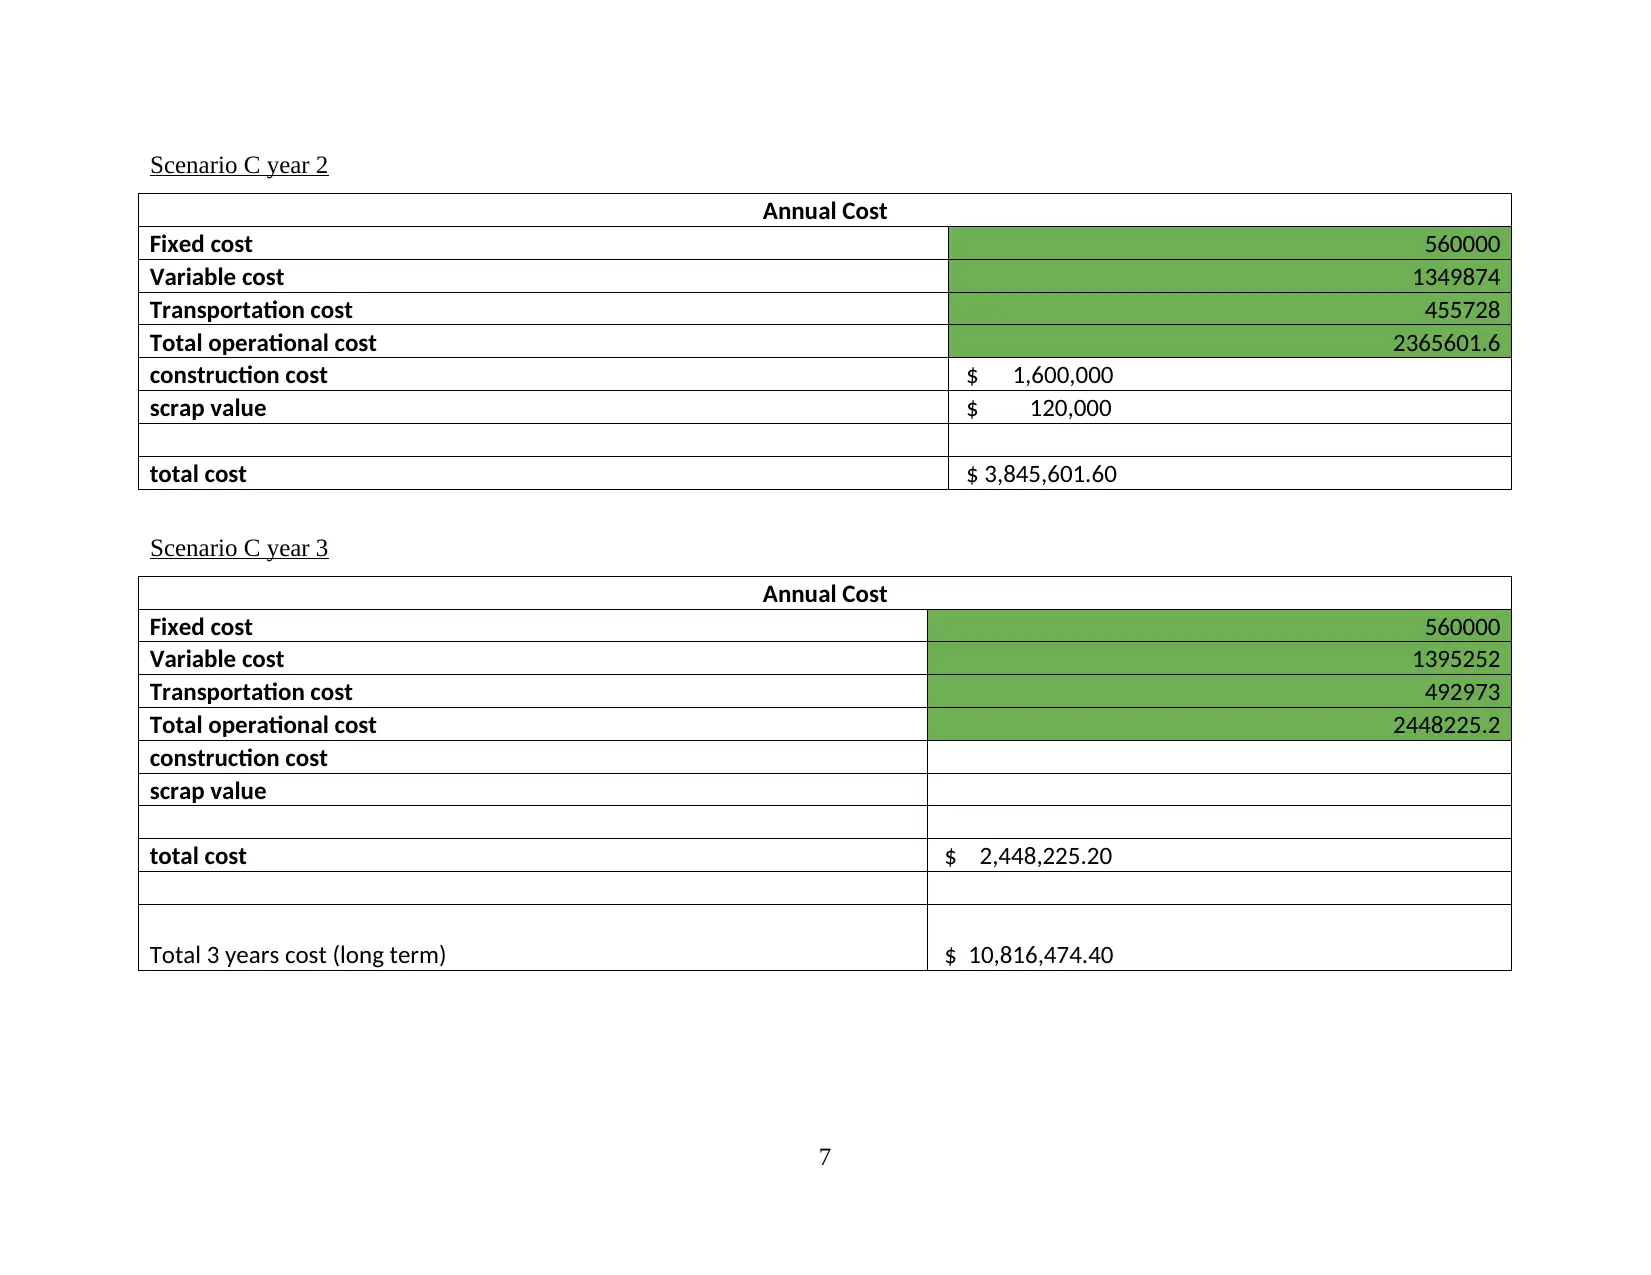
Scenario C year 2
Annual Cost
Fixed cost 560000
Variable cost 1349874
Transportation cost 455728
Total operational cost 2365601.6
construction cost $ 1,600,000
scrap value $ 120,000
total cost $ 3,845,601.60
Scenario C year 3
Annual Cost
Fixed cost 560000
Variable cost 1395252
Transportation cost 492973
Total operational cost 2448225.2
construction cost
scrap value
total cost $ 2,448,225.20
Total 3 years cost (long term) $ 10,816,474.40
7
Annual Cost
Fixed cost 560000
Variable cost 1349874
Transportation cost 455728
Total operational cost 2365601.6
construction cost $ 1,600,000
scrap value $ 120,000
total cost $ 3,845,601.60
Scenario C year 3
Annual Cost
Fixed cost 560000
Variable cost 1395252
Transportation cost 492973
Total operational cost 2448225.2
construction cost
scrap value
total cost $ 2,448,225.20
Total 3 years cost (long term) $ 10,816,474.40
7
⊘ This is a preview!⊘
Do you want full access?
Subscribe today to unlock all pages.
Trusted by 1+ million students worldwide
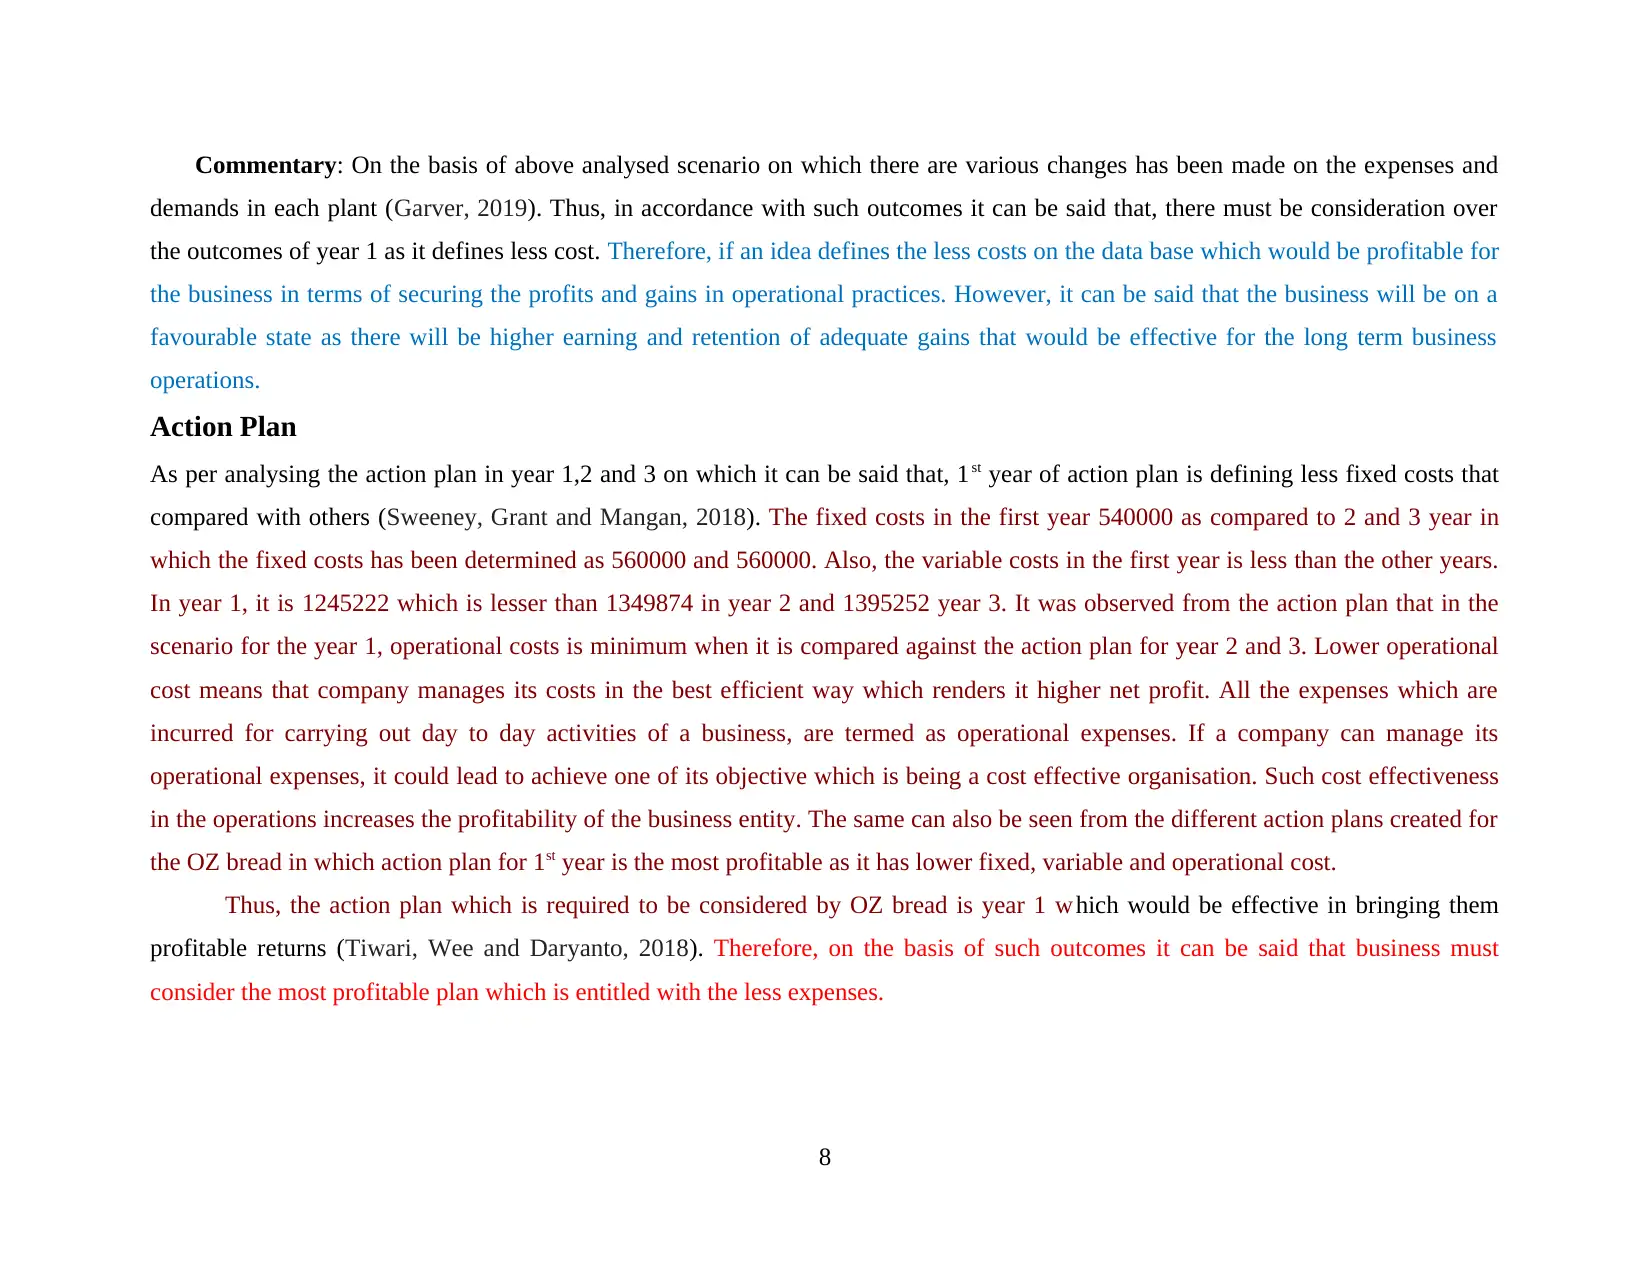
Commentary: On the basis of above analysed scenario on which there are various changes has been made on the expenses and
demands in each plant (Garver, 2019). Thus, in accordance with such outcomes it can be said that, there must be consideration over
the outcomes of year 1 as it defines less cost. Therefore, if an idea defines the less costs on the data base which would be profitable for
the business in terms of securing the profits and gains in operational practices. However, it can be said that the business will be on a
favourable state as there will be higher earning and retention of adequate gains that would be effective for the long term business
operations.
Action Plan
As per analysing the action plan in year 1,2 and 3 on which it can be said that, 1st year of action plan is defining less fixed costs that
compared with others (Sweeney, Grant and Mangan, 2018). The fixed costs in the first year 540000 as compared to 2 and 3 year in
which the fixed costs has been determined as 560000 and 560000. Also, the variable costs in the first year is less than the other years.
In year 1, it is 1245222 which is lesser than 1349874 in year 2 and 1395252 year 3. It was observed from the action plan that in the
scenario for the year 1, operational costs is minimum when it is compared against the action plan for year 2 and 3. Lower operational
cost means that company manages its costs in the best efficient way which renders it higher net profit. All the expenses which are
incurred for carrying out day to day activities of a business, are termed as operational expenses. If a company can manage its
operational expenses, it could lead to achieve one of its objective which is being a cost effective organisation. Such cost effectiveness
in the operations increases the profitability of the business entity. The same can also be seen from the different action plans created for
the OZ bread in which action plan for 1st year is the most profitable as it has lower fixed, variable and operational cost.
Thus, the action plan which is required to be considered by OZ bread is year 1 w hich would be effective in bringing them
profitable returns (Tiwari, Wee and Daryanto, 2018). Therefore, on the basis of such outcomes it can be said that business must
consider the most profitable plan which is entitled with the less expenses.
8
Paraphrase This Document
Need a fresh take? Get an instant paraphrase of this document with our AI Paraphraser
CONCLUSION
On the basis of above report on which it can be concluded that, there were various scenarios which would be effective for the firm
in retaining the adequate gains at the right time. The plan relevant with expanding business operations such as producing bread and
cakes would be effective in leading the organisation on the right state.
9
REFERENCES
Books and Journals
Fosso Wamba, S. and et.al., 2018. Big data analytics in logistics and supply chain management. The International Journal of Logistics
Management. 29(2). pp.478-484.
Garver, M. S., 2019. Threats to the Validity of Logistics and Supply Chain Management Research. Journal of Business Logistics.
Kshetri, N., 2018. 1 Blockchain’s roles in meeting key supply chain management objectives. International Journal of Information
Management. 39. pp.80-89.
Nguyen, T. and et.al., 2018. Big data analytics in supply chain management: A state-of-the-art literature review. Computers &
Operations Research. 98. pp.254-264.
Sweeney, E., Grant, D. B. and Mangan, D. J., 2018. Strategic adoption of logistics and supply chain management. International
Journal of Operations & Production Management. 38(3). pp.852-873.
Tiwari, S., Wee, H. M. and Daryanto, Y., 2018. Big data analytics in supply chain management between 2010 and 2016: Insights to
industries. Computers & Industrial Engineering. 115. pp.319-330.
10
⊘ This is a preview!⊘
Do you want full access?
Subscribe today to unlock all pages.
Trusted by 1+ million students worldwide
1 out of 16
Related Documents


Your All-in-One AI-Powered Toolkit for Academic Success.
+13062052269
info@desklib.com
Available 24*7 on WhatsApp / Email
![[object Object]](/_next/static/media/star-bottom.7253800d.svg)
Unlock your academic potential
Copyright © 2020–2026 A2Z Services. All Rights Reserved. Developed and managed by ZUCOL.