Business Process Analysis: P-Bicycle Corporation Case Study
VerifiedAdded on 2023/01/23
|14
|3048
|33
Report
AI Summary
This report presents a comprehensive process mapping and analysis of P-Bicycle Corporation, based on an interview with a company representative. It begins with an executive summary and introduction to process mapping, emphasizing its significance in visualizing and communicating workflows. The core of the report includes the creation and analysis of a relationship map, illustrating the supplier-customer linkages within the company, followed by a cross-functional map that details the steps involved in various processes, such as order fulfillment and servicing. The report identifies omissions and proposes improvements, particularly concerning payment methods and customer invoicing. It also explores performance measurement indicators that P-Bicycle Corporation could utilize. Finally, the report offers conclusions and recommendations aimed at enhancing the efficiency and effectiveness of the company's business processes.

Process Mapping and Analysis
Student’s name
Institution Affiliation(s)
Student’s name
Institution Affiliation(s)
Paraphrase This Document
Need a fresh take? Get an instant paraphrase of this document with our AI Paraphraser
Table of Contents
Executive Summary...................................................................................................................2
Introduction................................................................................................................................3
Process Mapping........................................................................................................................5
Process Analysis.........................................................................................................................8
Conclusion and Recommendations..........................................................................................10
References................................................................................................................................11
Table of Figures
Figure 1: A relationship Map of P-Bicycle Corporation............................................................3
Figure 2: Cross-Functional Map of P-Bicycle Corporation.......................................................4
Executive Summary
The following report gives an encounter which is in an interview between Oscar and
Phil who is a representative of P-Bicycle Corporation. Oscar wants to know the processes
that the company goes through during its operations. Using this interview as the primary
source of data the report comes up with a relationship map and a cross-functional map for P-
Bicycle Corporation. The report is divided into various sections including an introduction,
process map where a relationship map and its analysis is explained, process analysis where a
cross-functional map is explained, and finally, there is a section for conclusions and
recommendation for P-Bicycle Corporation.
⊘ This is a preview!⊘
Do you want full access?
Subscribe today to unlock all pages.
Trusted by 1+ million students worldwide
Introduction
Process mapping is a visual depiction of the flow of a process, in order to ease better
understanding and communicate it effectively to the stakeholders (Gallia, 2019). It is defined
as creating a map of the course a patient takes, through the relevant administrative processes
and pertinent procedures, in a pictorial format. Process maps have a number of uses (Chung
et al., 2017). They help in explaining the workflow to new employees while clarifying the job
responsibilities of existing ones. Relationship mapping is a tool that organizations use for
very specific reasons like:
a) To acquire and win new customers
b) To protect the existing clients and their accounts and
c) To grow revenues among the existing clients
Traditionally relationship mapping was used to build out a visual chart that included all
the key stakeholders. A card for each stakeholder would include their background notes, what
motivates them and their biases (Biggs, Farrell, Lawrence, & Johnson, 2014). From there, an
arrangement of the cards would be made to show who reports to whom. Different symbols
would be used including line types and colour codes depending on how complex an
organization wanted their relationship mapping to be. Relationship mapping would indicate
the relationship strength, relationship types, internal alliances, conflicts, and all the
influencers.
While the traditional relationship mapping tool was a worthwhile activity and a strategic
practice, the sheer complexity of coming up with a relationship map made difficult for an
organization to execute making various companies that could benefit from relationship maps
to avoid them altogether. After a relationship map has been created most visual charts would
quickly become absolute because updating these maps was deemed as an inefficient and
cumbersome activity. This is because the relationship maps are not portable and its content
Paraphrase This Document
Need a fresh take? Get an instant paraphrase of this document with our AI Paraphraser
was housed in a centralized location. However, with the advancement in technology,
relationship mapping software are able to create insights that are kept up-to-date with
automatic feeding of the inputs which can be delivered through mobile platforms and emails.
In the end, the sales and business development departments of any organization values
business mapping for the benefit it brings to the organization (DeGirolamo et al., 2018).
On the other hand, Cross-functional maps the depth of the processes details of an
organization by expanding the limits of conventional charts to a multi-dimensional range.
This allows anyone that is examining the cross-functional map to examine the processes and
the attributes related to the specific processes along with the categories that they belong to.
Cross-functional maps focus more on showing us more details of how the organization uses
processes for customer value creation, unlike relationship maps that focus on the long-term
link between the customer and the suppliers that make up the organization (Black et al.,
2016).
Process Mapping
Suppliers Purchasing
Department
Engineering
Distribution
Department Customer
Sales
Bicycle
Manufacturer
Bicycle
Servicing
Service request
Work Order
Material Request
Material Request
Purchase Order
Materials
Verifies Order
Produce Specs
Detailed Drawing
Order not Verified
Verified
Order
Complete New Bicycle
Servicing complete
Serviced bicycle
New bicycle
P-Bicycle Corporation
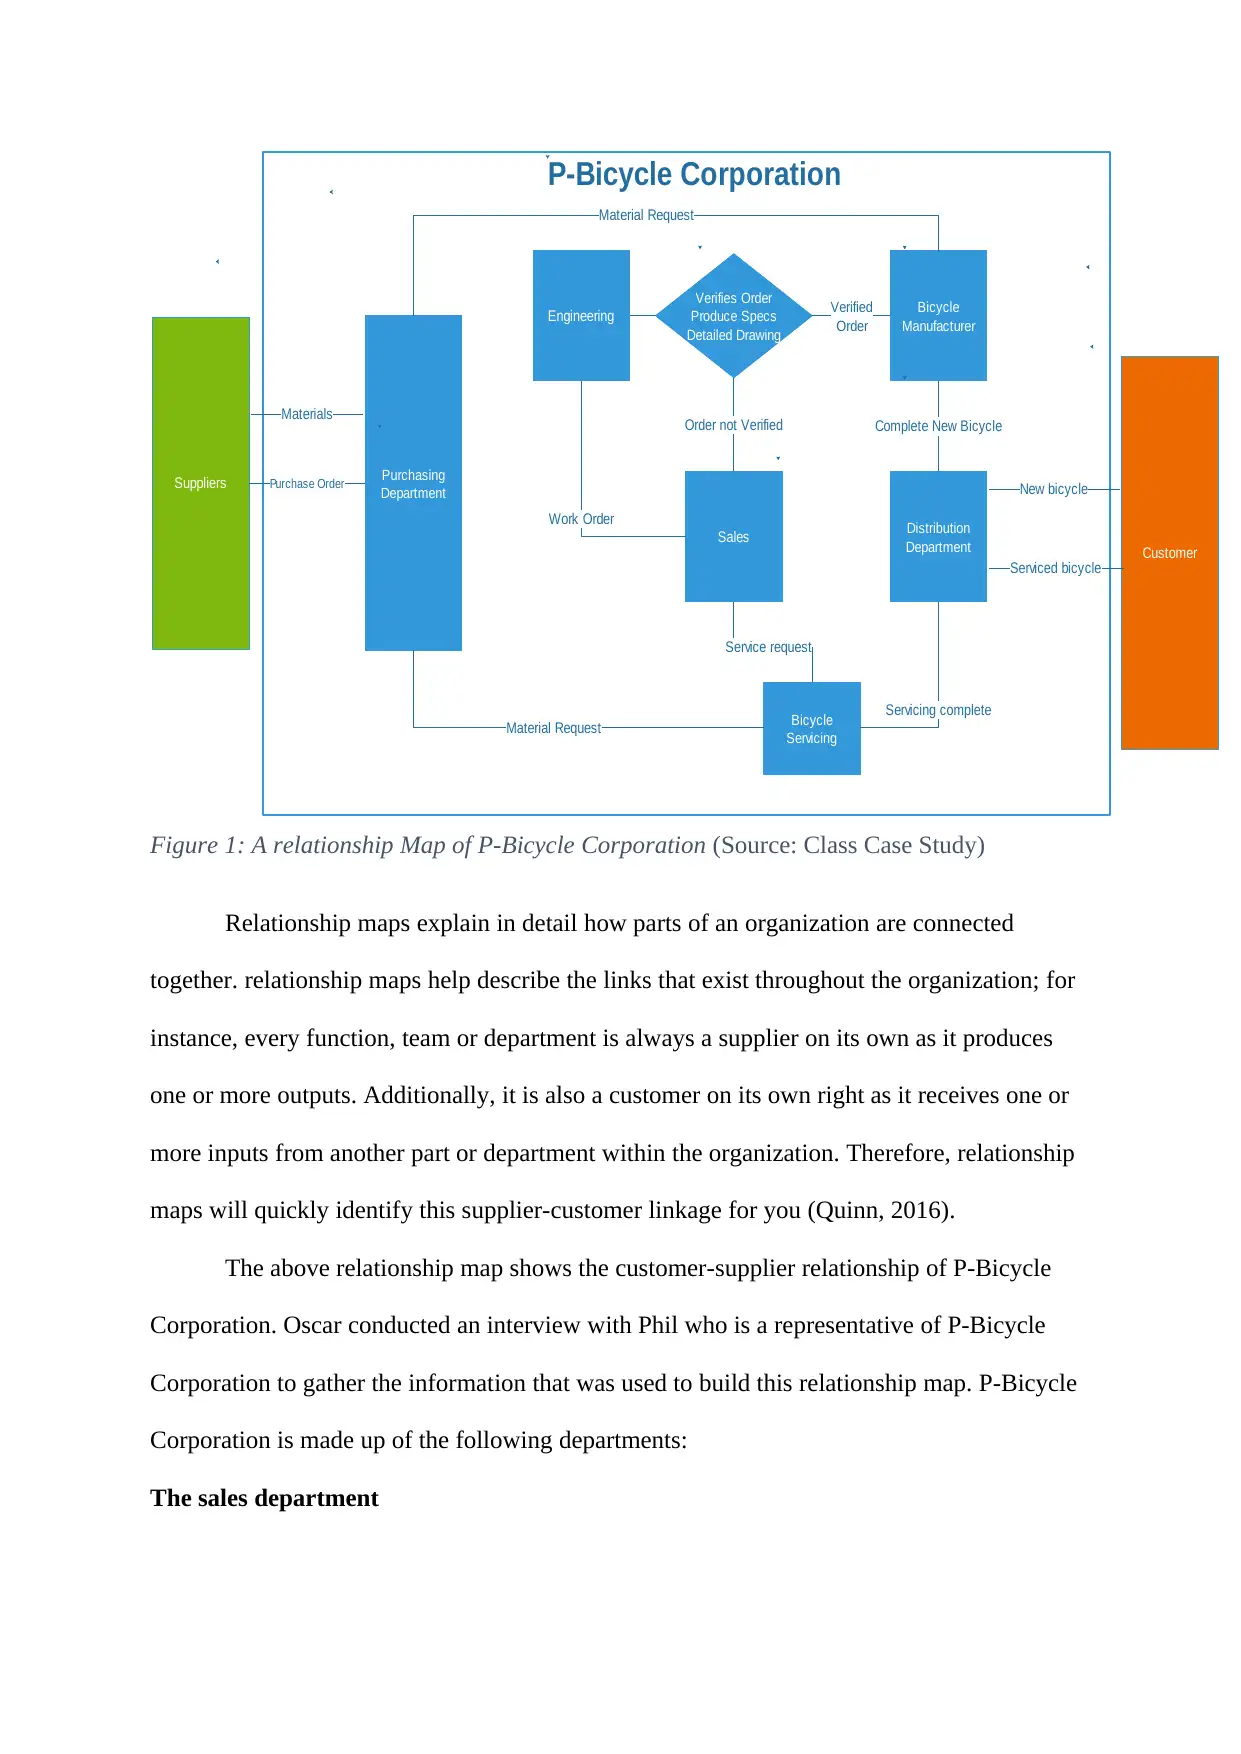
Figure 1: A relationship Map of P-Bicycle Corporation (Source: Class Case Study)
Relationship maps explain in detail how parts of an organization are connected
together. relationship maps help describe the links that exist throughout the organization; for
instance, every function, team or department is always a supplier on its own as it produces
one or more outputs. Additionally, it is also a customer on its own right as it receives one or
more inputs from another part or department within the organization. Therefore, relationship
maps will quickly identify this supplier-customer linkage for you (Quinn, 2016).
The above relationship map shows the customer-supplier relationship of P-Bicycle
Corporation. Oscar conducted an interview with Phil who is a representative of P-Bicycle
Corporation to gather the information that was used to build this relationship map. P-Bicycle
Corporation is made up of the following departments:
The sales department
Department
Engineering
Distribution
Department Customer
Sales
Bicycle
Manufacturer
Bicycle
Servicing
Service request
Work Order
Material Request
Material Request
Purchase Order
Materials
Verifies Order
Produce Specs
Detailed Drawing
Order not Verified
Verified
Order
Complete New Bicycle
Servicing complete
Serviced bicycle
New bicycle
P-Bicycle Corporation
Figure 1: A relationship Map of P-Bicycle Corporation (Source: Class Case Study)
Relationship maps explain in detail how parts of an organization are connected
together. relationship maps help describe the links that exist throughout the organization; for
instance, every function, team or department is always a supplier on its own as it produces
one or more outputs. Additionally, it is also a customer on its own right as it receives one or
more inputs from another part or department within the organization. Therefore, relationship
maps will quickly identify this supplier-customer linkage for you (Quinn, 2016).
The above relationship map shows the customer-supplier relationship of P-Bicycle
Corporation. Oscar conducted an interview with Phil who is a representative of P-Bicycle
Corporation to gather the information that was used to build this relationship map. P-Bicycle
Corporation is made up of the following departments:
The sales department
⊘ This is a preview!⊘
Do you want full access?
Subscribe today to unlock all pages.
Trusted by 1+ million students worldwide
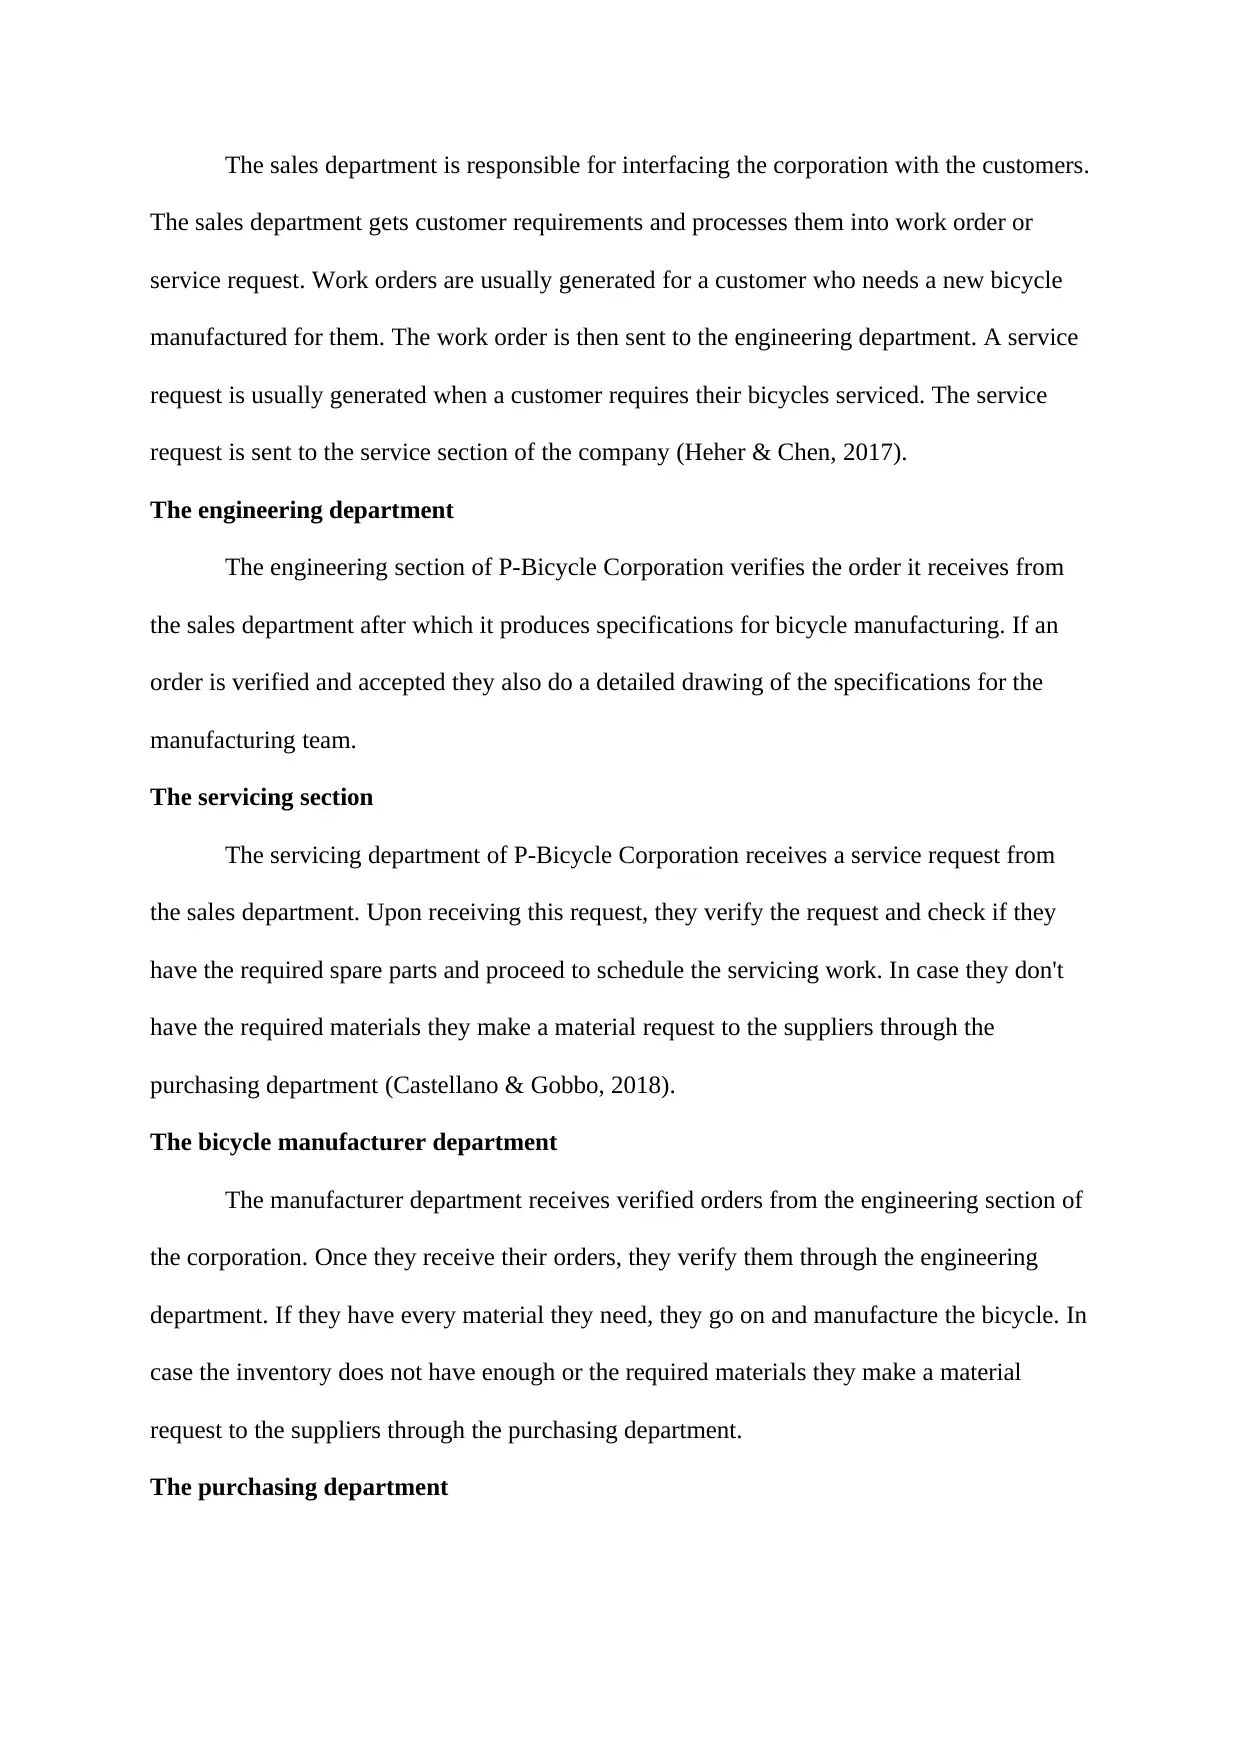
The sales department is responsible for interfacing the corporation with the customers.
The sales department gets customer requirements and processes them into work order or
service request. Work orders are usually generated for a customer who needs a new bicycle
manufactured for them. The work order is then sent to the engineering department. A service
request is usually generated when a customer requires their bicycles serviced. The service
request is sent to the service section of the company (Heher & Chen, 2017).
The engineering department
The engineering section of P-Bicycle Corporation verifies the order it receives from
the sales department after which it produces specifications for bicycle manufacturing. If an
order is verified and accepted they also do a detailed drawing of the specifications for the
manufacturing team.
The servicing section
The servicing department of P-Bicycle Corporation receives a service request from
the sales department. Upon receiving this request, they verify the request and check if they
have the required spare parts and proceed to schedule the servicing work. In case they don't
have the required materials they make a material request to the suppliers through the
purchasing department (Castellano & Gobbo, 2018).
The bicycle manufacturer department
The manufacturer department receives verified orders from the engineering section of
the corporation. Once they receive their orders, they verify them through the engineering
department. If they have every material they need, they go on and manufacture the bicycle. In
case the inventory does not have enough or the required materials they make a material
request to the suppliers through the purchasing department.
The purchasing department
Paraphrase This Document
Need a fresh take? Get an instant paraphrase of this document with our AI Paraphraser
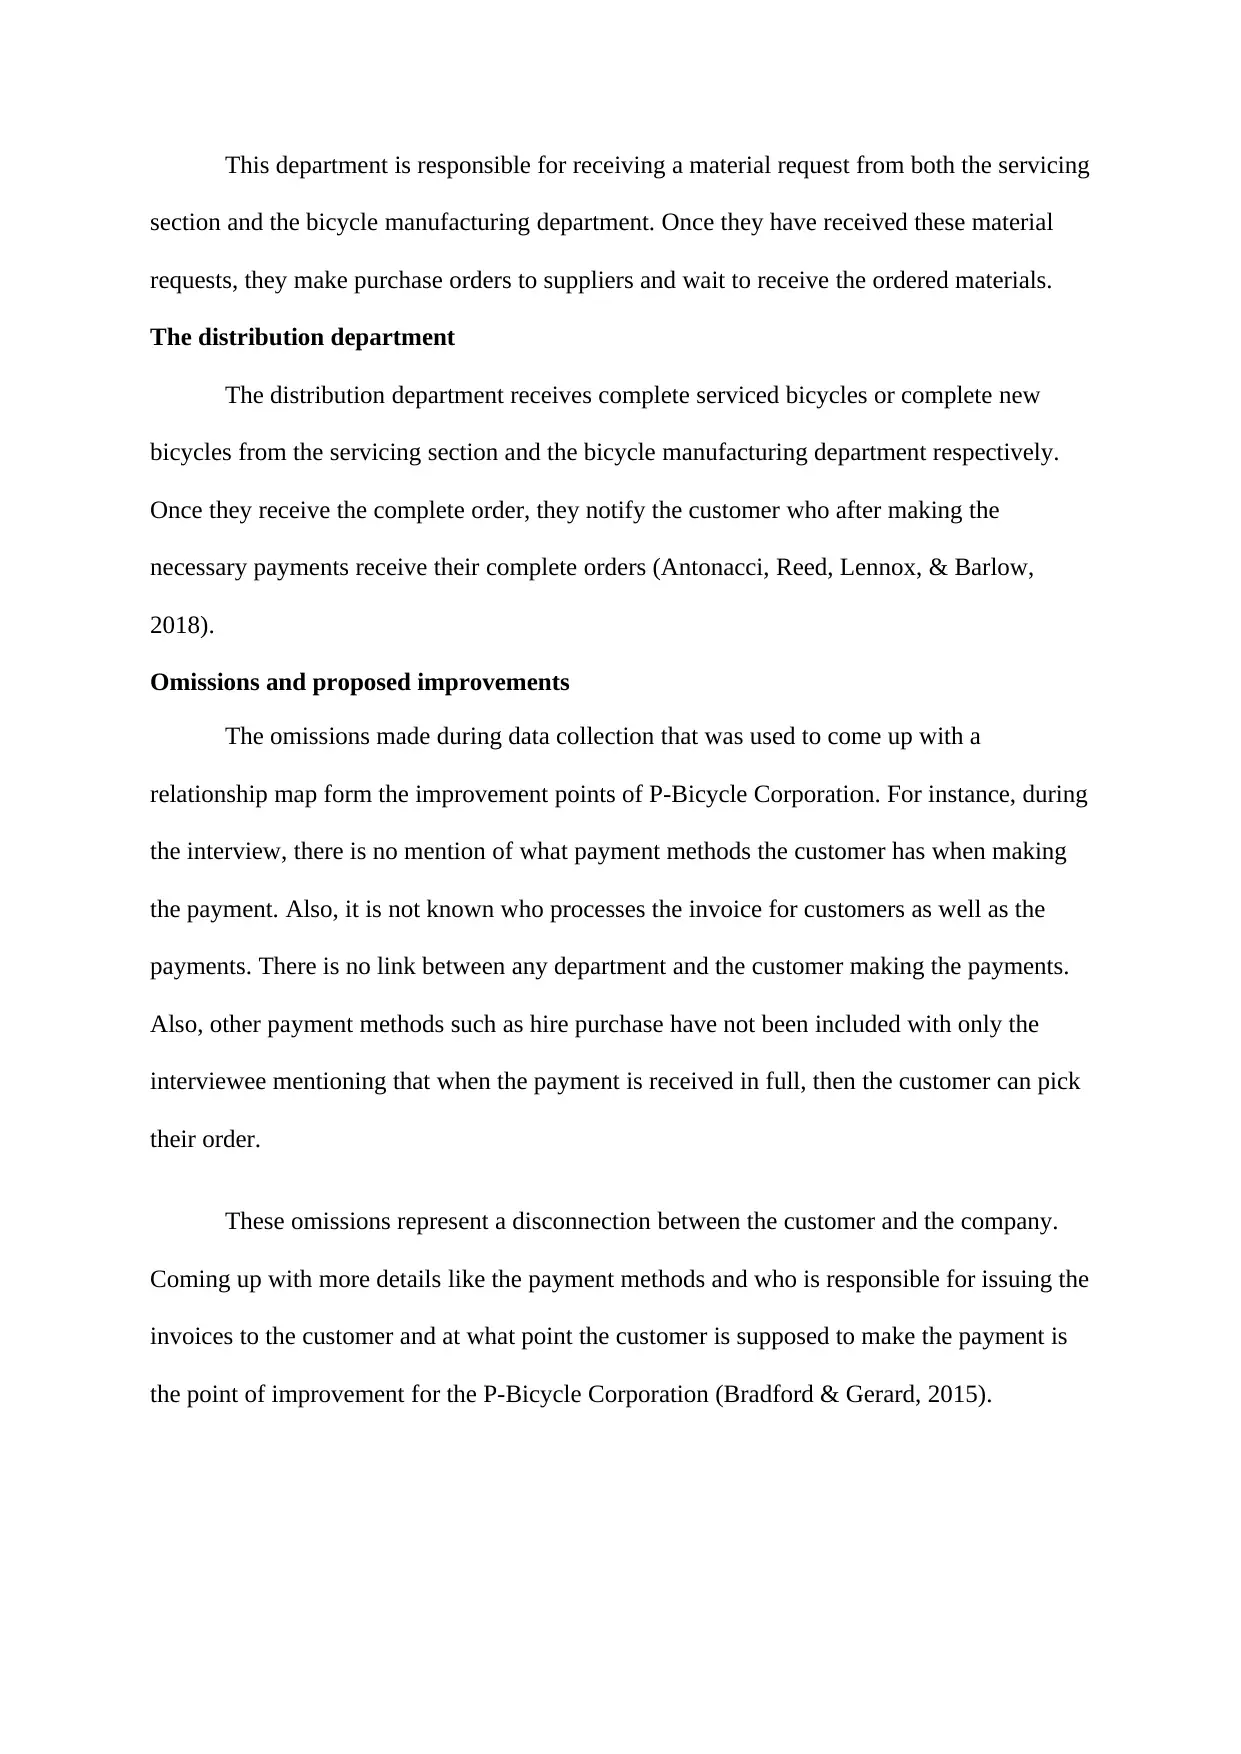
This department is responsible for receiving a material request from both the servicing
section and the bicycle manufacturing department. Once they have received these material
requests, they make purchase orders to suppliers and wait to receive the ordered materials.
The distribution department
The distribution department receives complete serviced bicycles or complete new
bicycles from the servicing section and the bicycle manufacturing department respectively.
Once they receive the complete order, they notify the customer who after making the
necessary payments receive their complete orders (Antonacci, Reed, Lennox, & Barlow,
2018).
Omissions and proposed improvements
The omissions made during data collection that was used to come up with a
relationship map form the improvement points of P-Bicycle Corporation. For instance, during
the interview, there is no mention of what payment methods the customer has when making
the payment. Also, it is not known who processes the invoice for customers as well as the
payments. There is no link between any department and the customer making the payments.
Also, other payment methods such as hire purchase have not been included with only the
interviewee mentioning that when the payment is received in full, then the customer can pick
their order.
These omissions represent a disconnection between the customer and the company.
Coming up with more details like the payment methods and who is responsible for issuing the
invoices to the customer and at what point the customer is supposed to make the payment is
the point of improvement for the P-Bicycle Corporation (Bradford & Gerard, 2015).
Process Analysis
CustomerSales
Engineering
and Servicing
ManufacturingDistribution
No
Customer request
New bicycle or
Servicing
Complete work
order
Engineering
Servicing
Manufacture the new
bicycle
Get more details
from customer
More feedback
Confirm with
customer
Make payment
P-Bicycle Corporation Cross-Functional Process
Work order prepared
New Bicycle order
Servicing order
Servicing Complete
order new parts
Acquire New Parts
Get new parts
Serviced bicycle
ready New bicycle ready
Prepare
Invoice
Complete Work
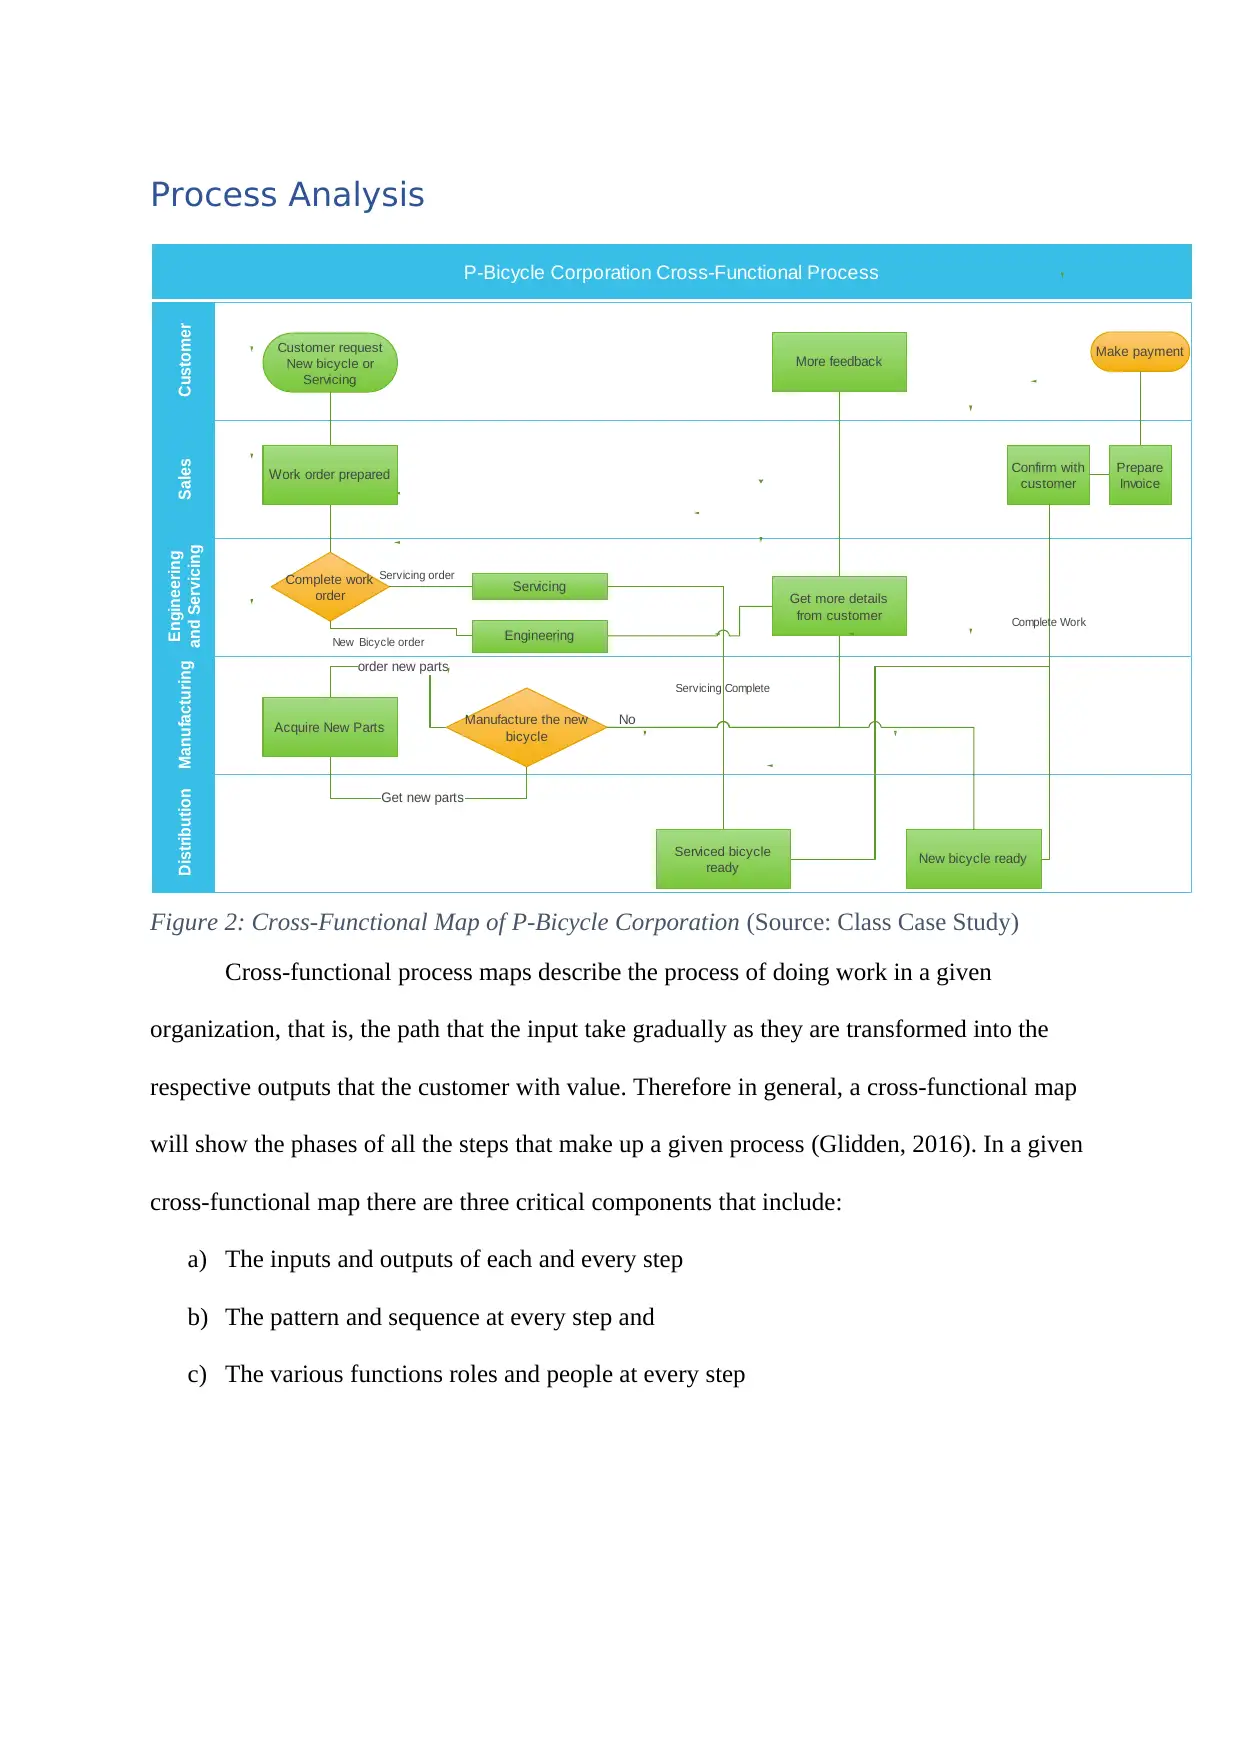
Figure 2: Cross-Functional Map of P-Bicycle Corporation (Source: Class Case Study)
Cross-functional process maps describe the process of doing work in a given
organization, that is, the path that the input take gradually as they are transformed into the
respective outputs that the customer with value. Therefore in general, a cross-functional map
will show the phases of all the steps that make up a given process (Glidden, 2016). In a given
cross-functional map there are three critical components that include:
a) The inputs and outputs of each and every step
b) The pattern and sequence at every step and
c) The various functions roles and people at every step
CustomerSales
Engineering
and Servicing
ManufacturingDistribution
No
Customer request
New bicycle or
Servicing
Complete work
order
Engineering
Servicing
Manufacture the new
bicycle
Get more details
from customer
More feedback
Confirm with
customer
Make payment
P-Bicycle Corporation Cross-Functional Process
Work order prepared
New Bicycle order
Servicing order
Servicing Complete
order new parts
Acquire New Parts
Get new parts
Serviced bicycle
ready New bicycle ready
Prepare
Invoice
Complete Work
Figure 2: Cross-Functional Map of P-Bicycle Corporation (Source: Class Case Study)
Cross-functional process maps describe the process of doing work in a given
organization, that is, the path that the input take gradually as they are transformed into the
respective outputs that the customer with value. Therefore in general, a cross-functional map
will show the phases of all the steps that make up a given process (Glidden, 2016). In a given
cross-functional map there are three critical components that include:
a) The inputs and outputs of each and every step
b) The pattern and sequence at every step and
c) The various functions roles and people at every step
⊘ This is a preview!⊘
Do you want full access?
Subscribe today to unlock all pages.
Trusted by 1+ million students worldwide
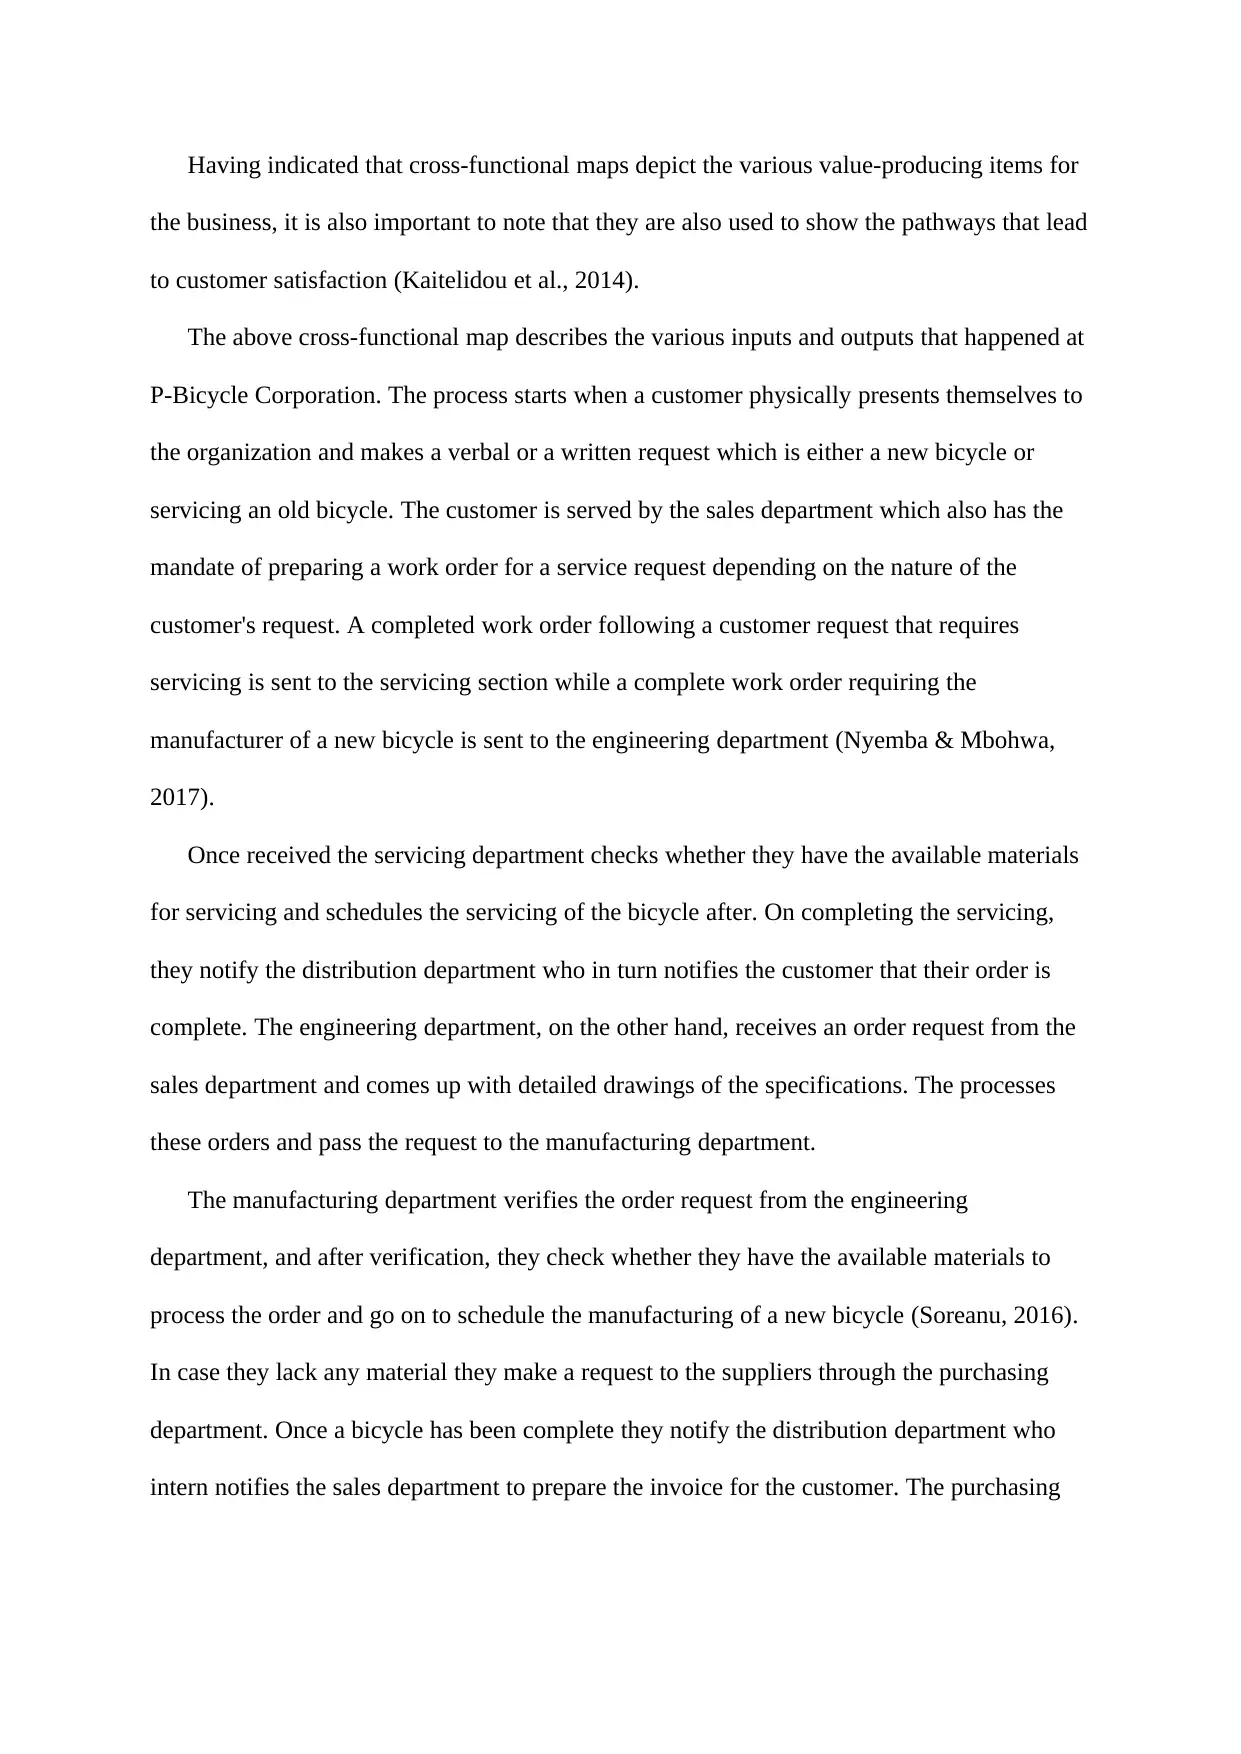
Having indicated that cross-functional maps depict the various value-producing items for
the business, it is also important to note that they are also used to show the pathways that lead
to customer satisfaction (Kaitelidou et al., 2014).
The above cross-functional map describes the various inputs and outputs that happened at
P-Bicycle Corporation. The process starts when a customer physically presents themselves to
the organization and makes a verbal or a written request which is either a new bicycle or
servicing an old bicycle. The customer is served by the sales department which also has the
mandate of preparing a work order for a service request depending on the nature of the
customer's request. A completed work order following a customer request that requires
servicing is sent to the servicing section while a complete work order requiring the
manufacturer of a new bicycle is sent to the engineering department (Nyemba & Mbohwa,
2017).
Once received the servicing department checks whether they have the available materials
for servicing and schedules the servicing of the bicycle after. On completing the servicing,
they notify the distribution department who in turn notifies the customer that their order is
complete. The engineering department, on the other hand, receives an order request from the
sales department and comes up with detailed drawings of the specifications. The processes
these orders and pass the request to the manufacturing department.
The manufacturing department verifies the order request from the engineering
department, and after verification, they check whether they have the available materials to
process the order and go on to schedule the manufacturing of a new bicycle (Soreanu, 2016).
In case they lack any material they make a request to the suppliers through the purchasing
department. Once a bicycle has been complete they notify the distribution department who
intern notifies the sales department to prepare the invoice for the customer. The purchasing
Paraphrase This Document
Need a fresh take? Get an instant paraphrase of this document with our AI Paraphraser
department is involved with receiving a material request from both the servicing and the
engineering departments and making purchase orders to the respective suppliers.
Omissions and proposed improvements.
Cross-functional maps depict what takes place inside one or more functions for a given
process, and therefore any disconnect or omissions that were identified during the creation of
a relationship map will also be present while analysing the cross-functional process map.
Therefore, the cross-functional map also identifies the problem of missing payment methods.
The primary data used to come up with the map does not identify the options that a customer
has (Nyemba & Mbohwa, 2017).
Performance Measurement
It is critical that business managers are aware of how various business processes and
departments are performing. That is where performance measurements come in. performance
measures will allow you to evaluate the various triggers that indicate a need for change in
performance. There are various performance indicators that P-Bicycle Corporation can use as
measures of performance success like:
a) The number or items that are returned.
b) The time it takes to fulfil an order
c) The number of customer complaints received.
For P-Bicycle Corporation, the organization would use the number of customer
complaints received as the performance measure. This is because every complaint received
indicate a dissatisfied customer. Also, it is an indication that one of the departments did not
give their expected outputs.
Conclusion and Recommendations
In conclusion, the process maps assist in identifying weak and strong points of the
organization, problems associated with the process and strategizing process improvement
efforts among others. These provide new insights into developing advanced interfaces among
different processes in order to achieve efficiencies. Process maps also bring forth the cost
structure and the main cost centres in the organizations. If in any case, that they only have
one payment method, then it is time for P-Bicycle Corporation to ensure they provide their
customers with various payment options as this will help improve the customer satisfaction
level. It is also important that in the various processes, the inputs and outputs are explicitly
defined so that every employee in these departments knows what to expect in, and what to
give out and to who.
⊘ This is a preview!⊘
Do you want full access?
Subscribe today to unlock all pages.
Trusted by 1+ million students worldwide
1 out of 14
Related Documents


Your All-in-One AI-Powered Toolkit for Academic Success.
+13062052269
info@desklib.com
Available 24*7 on WhatsApp / Email
![[object Object]](/_next/static/media/star-bottom.7253800d.svg)
Unlock your academic potential
Copyright © 2020–2026 A2Z Services. All Rights Reserved. Developed and managed by ZUCOL.