PACCC6000 Financial Analysis: Accent Group Limited Report 2016-2018
VerifiedAdded on 2023/06/03
|18
|4233
|102
Report
AI Summary
This report provides a financial analysis of Accent Group Limited, a leading Australian retailer of sports footwear and apparel, using data from their 2016, 2017, and 2018 annual reports. The analysis includes horizontal analysis, vertical analysis, and ratio analysis to assess the company's profitability, liquidity, and capital structure. The findings indicate that Accent Group achieved profitability throughout the period, with peak profitability in 2018, although its liquidity position weakened in the same year. The company's capital structure remained adequate across the three years, with debt financing peaking in 2017. The report evaluates key financial ratios such as return on net sales, return on total assets, asset turnover, return on equity, current ratio, quick ratio, inventory turnover, gross profit ratio, receivables turnover, debt to asset ratio, debt to equity ratio and interest coverage ratio to provide a comprehensive overview of the company's financial health and performance.
Running Head: Financial Statement Analysis
Financial Analysis
Accent Group Limited
Financial Analysis
Accent Group Limited
Paraphrase This Document
Need a fresh take? Get an instant paraphrase of this document with our AI Paraphraser
Financial Statement Analysis 1
Executive summary:
This report has been prepared to identify and highlight the financial strengths and weaknesses
of Accent Group Limited. The company is operating as the leading dealer of wide range of
sports footwear, apparel and other accessories in Australia. To analyse the financial
performance of the company various approaches have been used such as horizontal analysis,
vertical analysis and ratio analysis. The annual reports of Accent Group for the financial
years 2018, 2017 and 2016 have been thoroughly examined. The results of financial ratios
have revealed that the company has achieved profitability over the last three years. But it has
distributed maximum profits to its shareholders in 2018 among all the 3 years. However, at
the same time the liquidity position of the company in 2018 is not as strong as that was in the
previous two years. The capital structure of the company in all the three financial years is
adequate. However, in 2017, the portion of debt financing was relatively higher than that of
2016 and 2018.
Financial Statement Analysis 2
Table of Contents
Executive summary:..............................................................................................................................1
Introduction:..........................................................................................................................................3
Profitability position:.............................................................................................................................3
Return on net sales ratio...................................................................................................................4
Ratio of return on total assets...........................................................................................................4
Asset turnover ratio...........................................................................................................................5
Return on equity ratio.......................................................................................................................5
Liquidity Position:..................................................................................................................................6
Current Ratio.....................................................................................................................................6
Quick Ratio........................................................................................................................................6
Inventory turnover ratio and day’s inventory ratio...........................................................................7
Gross Profit Ratio...............................................................................................................................7
Receivables turnover ratio.................................................................................................................7
Day’s sales in receivables...................................................................................................................7
Gearing Ratios:......................................................................................................................................8
Debt to asset ratio.............................................................................................................................8
Debt to equity ratio...........................................................................................................................8
Interest Coverage Ratio.....................................................................................................................8
Conclusion:............................................................................................................................................8
References:..........................................................................................................................................10
Appendix:............................................................................................................................................11
⊘ This is a preview!⊘
Do you want full access?
Subscribe today to unlock all pages.
Trusted by 1+ million students worldwide
Financial Statement Analysis 3
Introduction:
Accent Group Limited is an Australian company listed on Australia’s Securities Exchange. It
had started its business operations in year 1981 and is headquartered at Waterloo, Australia.
The company is engaged in the retail, distribution as well as franchisee business of footwear,
Apparel and the various types of accessories across Australia as well as New Zealand. Accent
Group was initially known with the name of RCG Corporation Limited. The company is
operating as the regional leading distribution of lifestyle footwear and it currently owning
over 420 stores and 10 distribution brands across both the countries of its operations. The
brand portfolio of the company includes Athlete’s Foot, Hype DC, Platypus Shoes, Podium
Sports, Sketchers, Merrell, CAT, Vans, Dr. Martens, Saucony, Timberland, Sperry Top-
Sider, Palladium, and Stance (Bloomberg, 2018).
The present report is prepared to carry out the financial analysis of the Accent Group using
different techniques such as horizontal analysis (also known as trend analysis), vertical
analysis and ratio analysis. Under this report the financial performance of the company over
last three financial years i.e. 2016, 2017 and 2018 has been analysed using different financial
ratios. Financial performance of business is based on various aspects such as its profitability
position, liquidity position, solvency position and its efficiency in managing and using
different assets of the business (Higgins, 2003). These aspects have been taken into
consideration in order to assess the overall financial position of Accent Group.
For ratios calculation: Refer Appendix Table 3
Profitability position:
Profitability is the state when the firm has sufficient amount of earnings left after meeting all
the costs and expenses of the business. There are various rations which determine the
profitability position of the business. (Tracy, 2012). The use of the key profitability ratios
Paraphrase This Document
Need a fresh take? Get an instant paraphrase of this document with our AI Paraphraser
Financial Statement Analysis 4
has been made in the present case to analyse the profitability position of business of Accent
Group Limited.
Return on net sales ratio
The return on net sales ratio is commonly known as Net Profit Margin Ratio. This ratio
measures the amount the earnings that are left in the business after making payment for the
expenses of the business in the given period of time. A firm with higher net profits is able to
offer higher returns to its owners and hence higher net profit is preferred in all types of
businesses. In the present case of Accent Group Limited, the net margin ratio was lowest in
2017 among all the three years under consideration. Though, the business of Accent Group
has experienced inclining trend in terms of sales revenue generation since 2016 to 2018.
However, the operating expenses in 2017 are relatively higher in 2017. The increased net
profit margin in 2018 as compared to 2018 reflects that company has earned better profits for
its owners in 2018.
Ratio of return on total assets
The ratio of return on total assets measures how effectively and efficiently the firm is
utilising its total assets in the business to generate returns for its owners. The ROA of Accent
Group is highest in 2018. It shows that the company has been able to utilise its total assets in
most efficient manner in 2018 when compared to 2016 and 2017. The increased operating
expenses and declining profit before interest have led to minimum ROA in 2017. Moreover,
increase in the level of fixed assets held in the business of Accent Group must have also
contributed to the lowest ROA in 2017 as the company could not have utilised its total assets
efficiently and therefore some of the assets must have remained idle in 2017. The excessive
investment in total assets has blocked the surplus funds of the business which could have
distributed among the owners of company if prudent investment in fixed assets was made
Financial Statement Analysis 5
where minimum finance cost could be incurred to finance the assets (Accent Group Limited,
2018).
Asset turnover ratio
Asset turnover ratio is the type of efficiency ratio which is used to assess the efficiency of
firm in deploying the overall business in the business. Higher Asset turnover ratio is desirable
in any business as higher the asset turnover ratio, more is the efficiency of the firm in
utilising its assets to generate sales revenue (Tracy, 2012). Accent Group has highest ATR in
2017 despite of the fact that in this particular year company has achieved lowest ROA. This
shows that the company has earned highest sales revenue in 2017 by utilising its assets due
the reason that it has maintained fixed assets in highest proportion as compared to other years
i.e. 2018 and 2016. However, in order to invest more in assets in 2017, the company must
have had borrowed funds from the external market where cost of financing such assets had to
be paid which in turn must have reduced its level of profits. This has resulted in lower ROA
but higher ATR in 201. Moreover, the ratio of 1.15 shows that Accent Group must have
earned $ 1.50 sales by making investment of each dollar in assets (Accent Group Limited,
2018) (Refer Appendix Table 3).
Return on equity ratio
The return on equity ratio measures the quantum of profits which have been passed to the
shareholders of the company (Nissim & Penman, 2001). Accent Group has generated
maximum returns for its shareholders in 2018 and this shows that it has effectively utilised
the funds provided by its shareholders in its business and through the effective utilisation, it
has distributed highest returns for its shareholders. Moreover, the earning per share of Accent
Group Limited is highest in 2018 which depicts that the company had strongest profitability
position in 2018. The reason of highest EPS in 2018 is that the company has earned highest
quantum of profits that are distributable among the shareholders is earned.
⊘ This is a preview!⊘
Do you want full access?
Subscribe today to unlock all pages.
Trusted by 1+ million students worldwide
Financial Statement Analysis 6
Liquidity Position:
The liquidity is the state which is achieved when the firm has sufficient amount of current
assets available with us to meet its current liabilities which falls due within next one year. To
determine the liquidity position of Accent Group Limited, use of various prominent ratios has
been made such as current ratio, quick ratio. If the company has implemented best working
capital management practices then it will certainly have the strong liquidity position in the
market.
Current Ratio
A company must have at-least maintained quantum of current assets which is equivalent to its
current liabilities. In the present case of Accent Group, the current ratio in all the 3 years is
higher than 1 which shows that the company has adequately invested in its current assets so
that it can meet its short term financial obligations as and when they become due without
requiring to dispose-off its fixed assets (Accent Group Limited, 2016). However, Accent
Group had experienced strongest liquidity position in 2016 and thereafter its liquidity state
had started weakening due to increase in the current liabilities like short term borrowings,
employees benefit expenses and deferred lease incentives. Moreover the total current assets
have been declined considerably in 2018 as compared to that of 2017 (Refer Appendix Table
1). In 2016, the company held lesser current financial obligations than that of 2017 and 2018.
However, in 2017, it has enhanced its investment in current assets to maintain its liquidity.
But, in 2018 the quantum of its current asset has reduced which had ultimately resulted in
weakened liquidity position.
Quick Ratio
The lowest quick ratio in 2018 as compared to that of 2017 and 2016 shows that although the
company has sufficient current assets to meet its short term financial obligations but the
balance of liquid asset which can easily and quickly be converted into cash is not sufficient
enough due to weaker cash conversion cycle (Higgins, 2012).
Paraphrase This Document
Need a fresh take? Get an instant paraphrase of this document with our AI Paraphraser
Financial Statement Analysis 7
Inventory turnover ratio and day’s inventory ratio
The inventory turnover ratio of a firm shows the number of times the business inventory has
been converted into sales in the given period of time, generally a year (Foster, 2004). The
ITR of Accent Group has not varied significantly over the last three financial years. However,
the highest ITR was reported by the company in 2017 which shows that the inventory was
converted into sales more frequently in 2017 as compared to 2018 and 2016. Also, the
company has taken relatively lesser time to convert its inventory into sales in 2017 than 2018
and 2016. The highest ITR in 2016 reflects the inefficient working capital management
practices of the company.
Gross Profit Ratio
In 2018, highest quantum of revenue was generated out of sales. However, the cost of goods
sold which has been incurred in the lesser proportion of total sales as compared to 2017 and
2016.Due to this highest GP rate has been achieved in 2018.
Receivables turnover ratio
The receivables turnover ratio measures the frequency with which the receivables were
converted into cash. Higher receivable turnover ratio is generally preferred. In 2018, highest
RTR is achieved which shows that Accent Group has managed its accounts receivables in the
most efficient way in 2018.
Day’s sales in receivables
In terms of management of accounts receivable of the business, the company has performed
best in 2018 as it has taken least time to convert its trade receivables into cash sales as
compared to other two years. It clearly shows that Accent Group has strongest cash operating
cycle in 2018 due to which it quickly convert its credit sales into cash.
Financial Statement Analysis 8
Gearing Ratios:
The gearing ratios are used to determine the appropriateness of capital structure of the
business.
Debt to asset ratio
The debt to asset ratio measures the proportion of total assets which has been financed
through the use of external debt sources (Cull, Demirgu Kunt & Morduch, 2007). Accent
Group had strongest solvency position in 2016 as it had relied more on equity financing i.e.
the internal sources of finance to invest in the business assets. Hence, it had to face least
financial leverage in 2016.But in 2018 the company is facing higher insolvency risk because
it has higher proportion of debt in its total capital structure.
Debt to equity ratio
Debt to equity ratio shows the proportion of total debt and total equity in the total capital
structure of the firm. As the proportion of debt is quite lower in the total capital structure of
the company, it can be said that Accent Group is facing lesser risk of insolvency.
Interest Coverage Ratio
In 2017, Accent Group Limited had lowest interest coverage ratio which reflects higher
chances of its bankruptcy. The interest coverage ratio shows the quantum of earnings
available with the company to meet its financing costs. As the proportion of external debt is
highest in 2017, higher is the chance of not meeting its interest obligations on timely manner.
Conclusion:
From the above analysis it can be said that, the profitability position of Accent Group was
best in 2016 and lowest in 2017. However, in 2018, the company has managed to improve
again its profitability state by making effective utilisation of its overall assets as well the
investments made by its shareholders. Also, it has been found that the company has paid
maximum returns to its equity shareholders in 2018. Further, the liquidity position of
⊘ This is a preview!⊘
Do you want full access?
Subscribe today to unlock all pages.
Trusted by 1+ million students worldwide
Financial Statement Analysis 9
business was strongest in 2016 due to limited short financial obligations but the same is not
the case in 2018 due to which it does not have satisfactory liquidity position. It must therefore
enhance its investments in current assets. Lastly, it can be said that Accent Group has
strongest financial position in 2016 as it had relied less on external debt financing sources to
acquire its fixed assets.
Paraphrase This Document
Need a fresh take? Get an instant paraphrase of this document with our AI Paraphraser
Financial Statement Analysis 10
References:
Accent Group Limited. (2016). Annual Report: 2016. Retrieved from:
http://onlinereports.irmau.com/2016/RCG/index.html#27/z
Accent Group Limited. (2018). Annual Report: 2018. Retrieved from:
http://onlinereports.irmau.com/2018/AX1/26/#zoom=z
Bloomberg. (2018). Company Overview of Accent Group Limited. (2018). Retrieved from:
https://www.bloomberg.com/research/stocks/private/snapshot.asp?
privcapId=10636950
Cull, R., Demirgu¨ ç‐Kunt, A. and Morduch, J. (2007). Financial performance and outreach:
A global analysis of leading microbanks. The Economic Journal, 117(517), pp.F107-
F133.
Foster, G. (2004). Financial Statement Analysis, 2/e. Pearson Education India.
Higgins, R.C. (2012). Analysis for financial management. McGraw-Hill/Irwin.
Nissim, D. and Penman, S.H. (2001). Ratio analysis and equity valuation: From research to
practice. Review of accounting studies, 6(1), pp.109-154.
Tracy, A. (2012). Ratio analysis fundamentals: how 17 financial ratios can allow you to
analyse any business on the planet. Ratio Analysis. Net.
Financial Statement Analysis 11
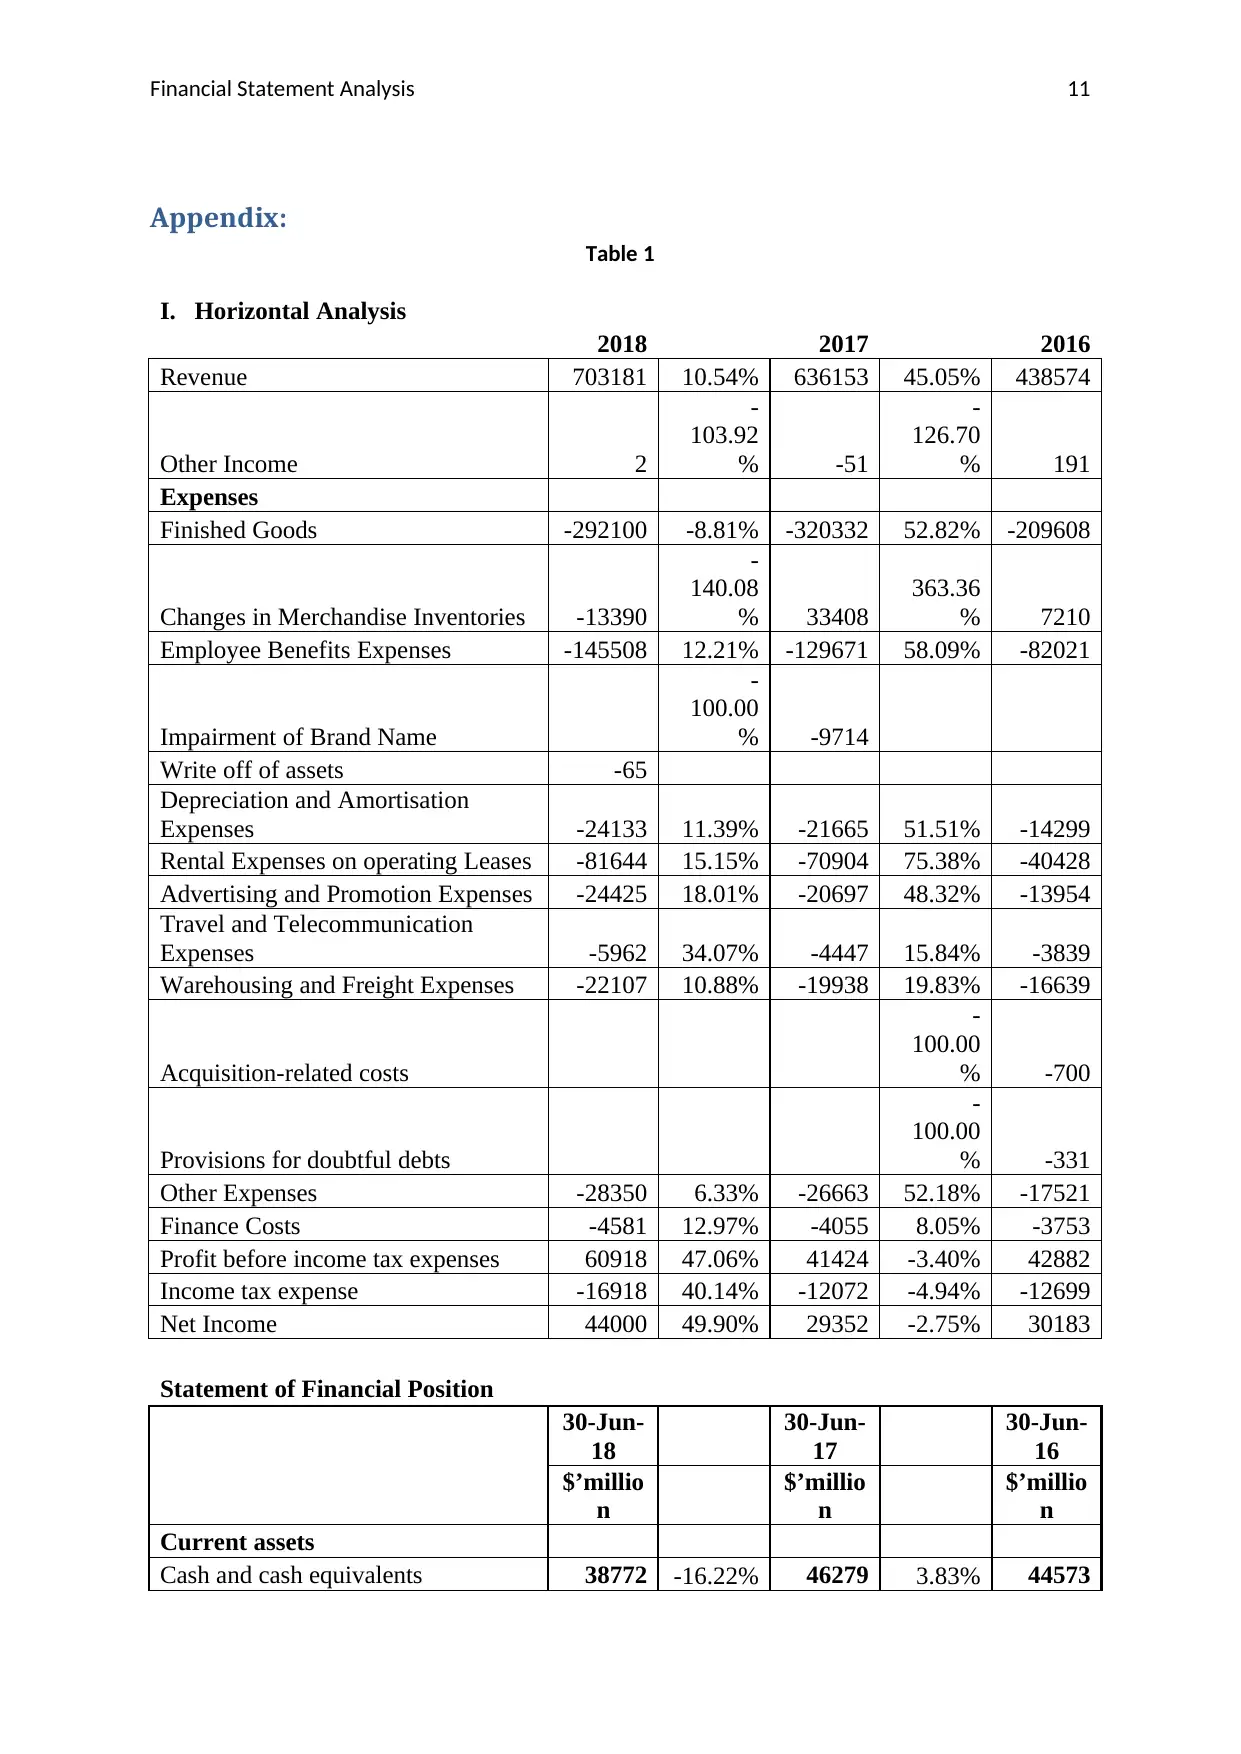
Appendix:
Table 1
I. Horizontal Analysis
2018 2017 2016
Revenue 703181 10.54% 636153 45.05% 438574
Other Income 2
-
103.92
% -51
-
126.70
% 191
Expenses
Finished Goods -292100 -8.81% -320332 52.82% -209608
Changes in Merchandise Inventories -13390
-
140.08
% 33408
363.36
% 7210
Employee Benefits Expenses -145508 12.21% -129671 58.09% -82021
Impairment of Brand Name
-
100.00
% -9714
Write off of assets -65
Depreciation and Amortisation
Expenses -24133 11.39% -21665 51.51% -14299
Rental Expenses on operating Leases -81644 15.15% -70904 75.38% -40428
Advertising and Promotion Expenses -24425 18.01% -20697 48.32% -13954
Travel and Telecommunication
Expenses -5962 34.07% -4447 15.84% -3839
Warehousing and Freight Expenses -22107 10.88% -19938 19.83% -16639
Acquisition-related costs
-
100.00
% -700
Provisions for doubtful debts
-
100.00
% -331
Other Expenses -28350 6.33% -26663 52.18% -17521
Finance Costs -4581 12.97% -4055 8.05% -3753
Profit before income tax expenses 60918 47.06% 41424 -3.40% 42882
Income tax expense -16918 40.14% -12072 -4.94% -12699
Net Income 44000 49.90% 29352 -2.75% 30183
Statement of Financial Position
30-Jun-
18
30-Jun-
17
30-Jun-
16
$’millio
n
$’millio
n
$’millio
n
Current assets
Cash and cash equivalents 38772 -16.22% 46279 3.83% 44573
⊘ This is a preview!⊘
Do you want full access?
Subscribe today to unlock all pages.
Trusted by 1+ million students worldwide
1 out of 18
Related Documents


Your All-in-One AI-Powered Toolkit for Academic Success.
+13062052269
info@desklib.com
Available 24*7 on WhatsApp / Email
![[object Object]](/_next/static/media/star-bottom.7253800d.svg)
Unlock your academic potential
Copyright © 2020–2026 A2Z Services. All Rights Reserved. Developed and managed by ZUCOL.