Pace University Spring 2019 Math 117 Data Analysis Project
VerifiedAdded on 2022/11/26
|11
|829
|378
Project
AI Summary
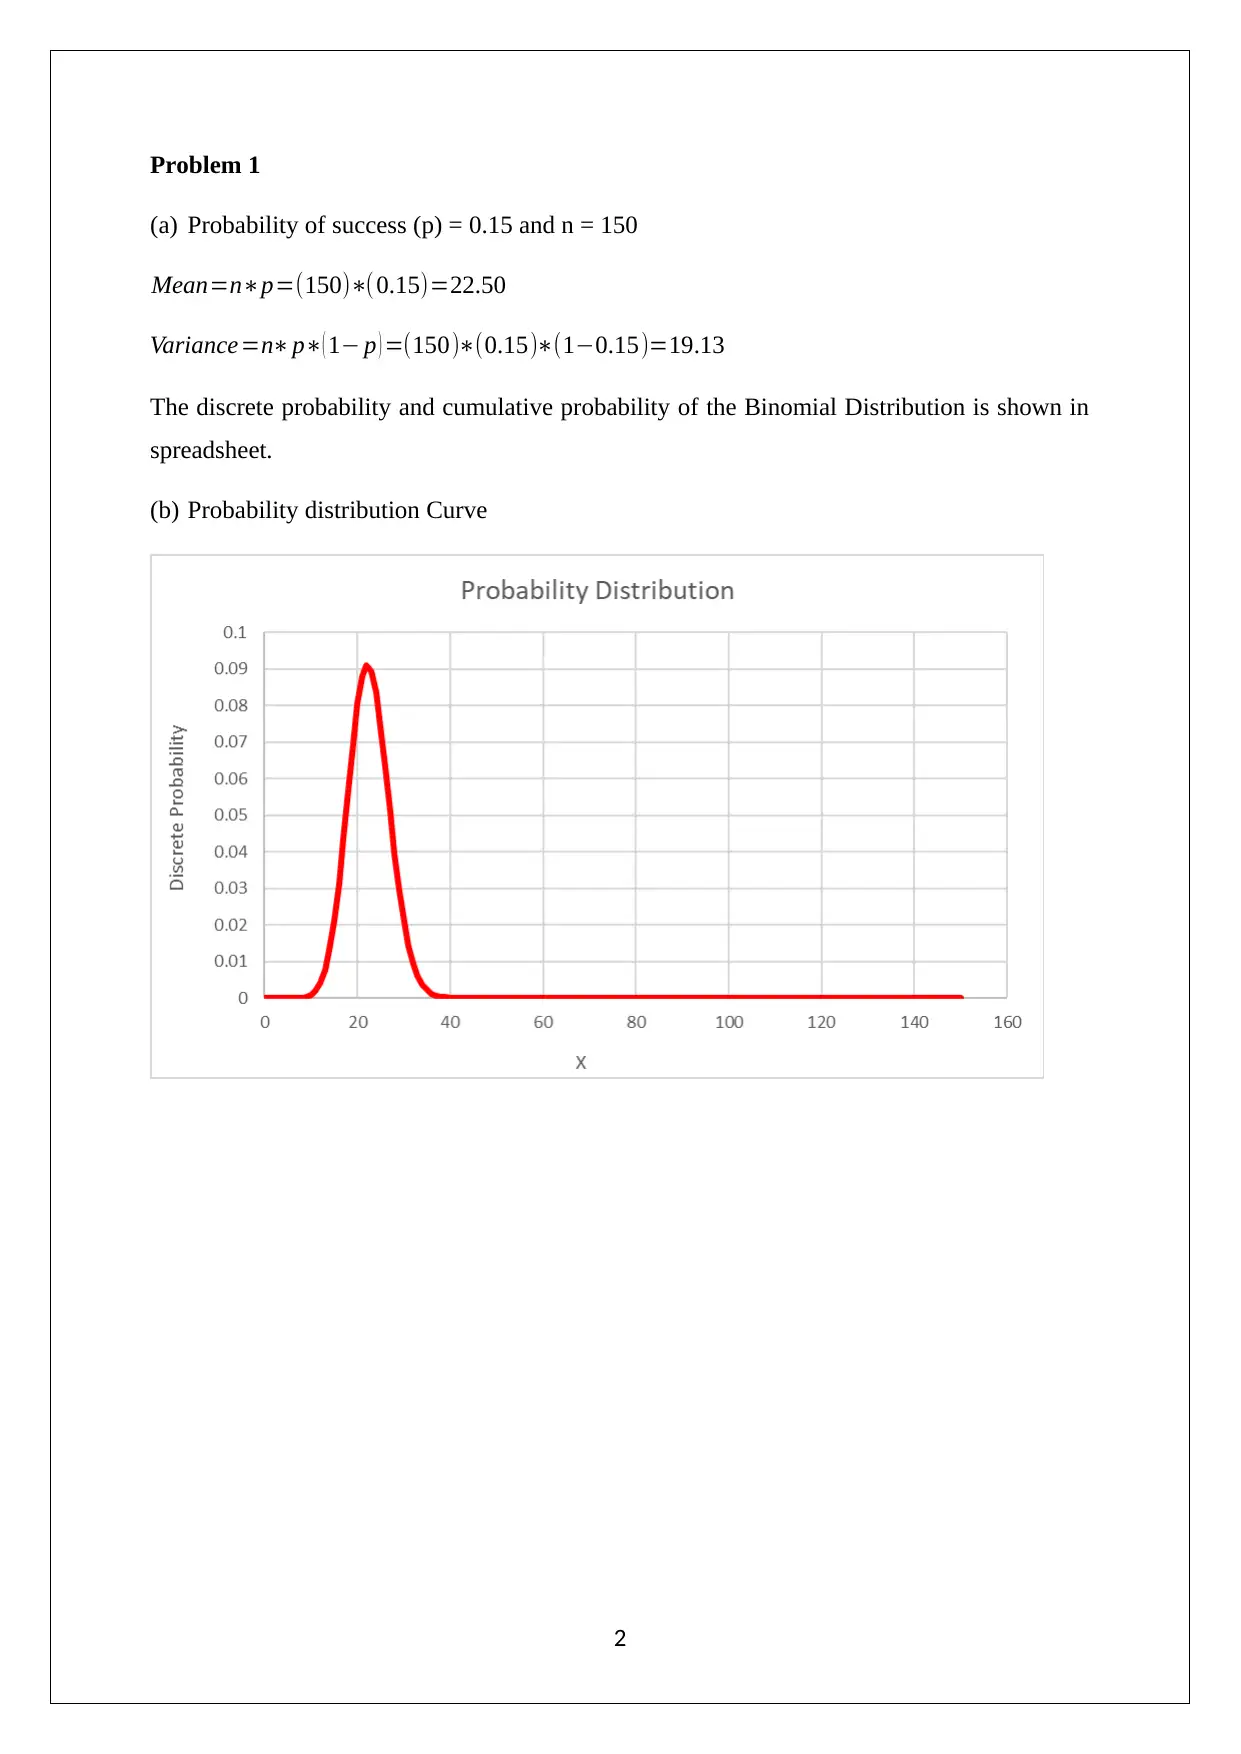
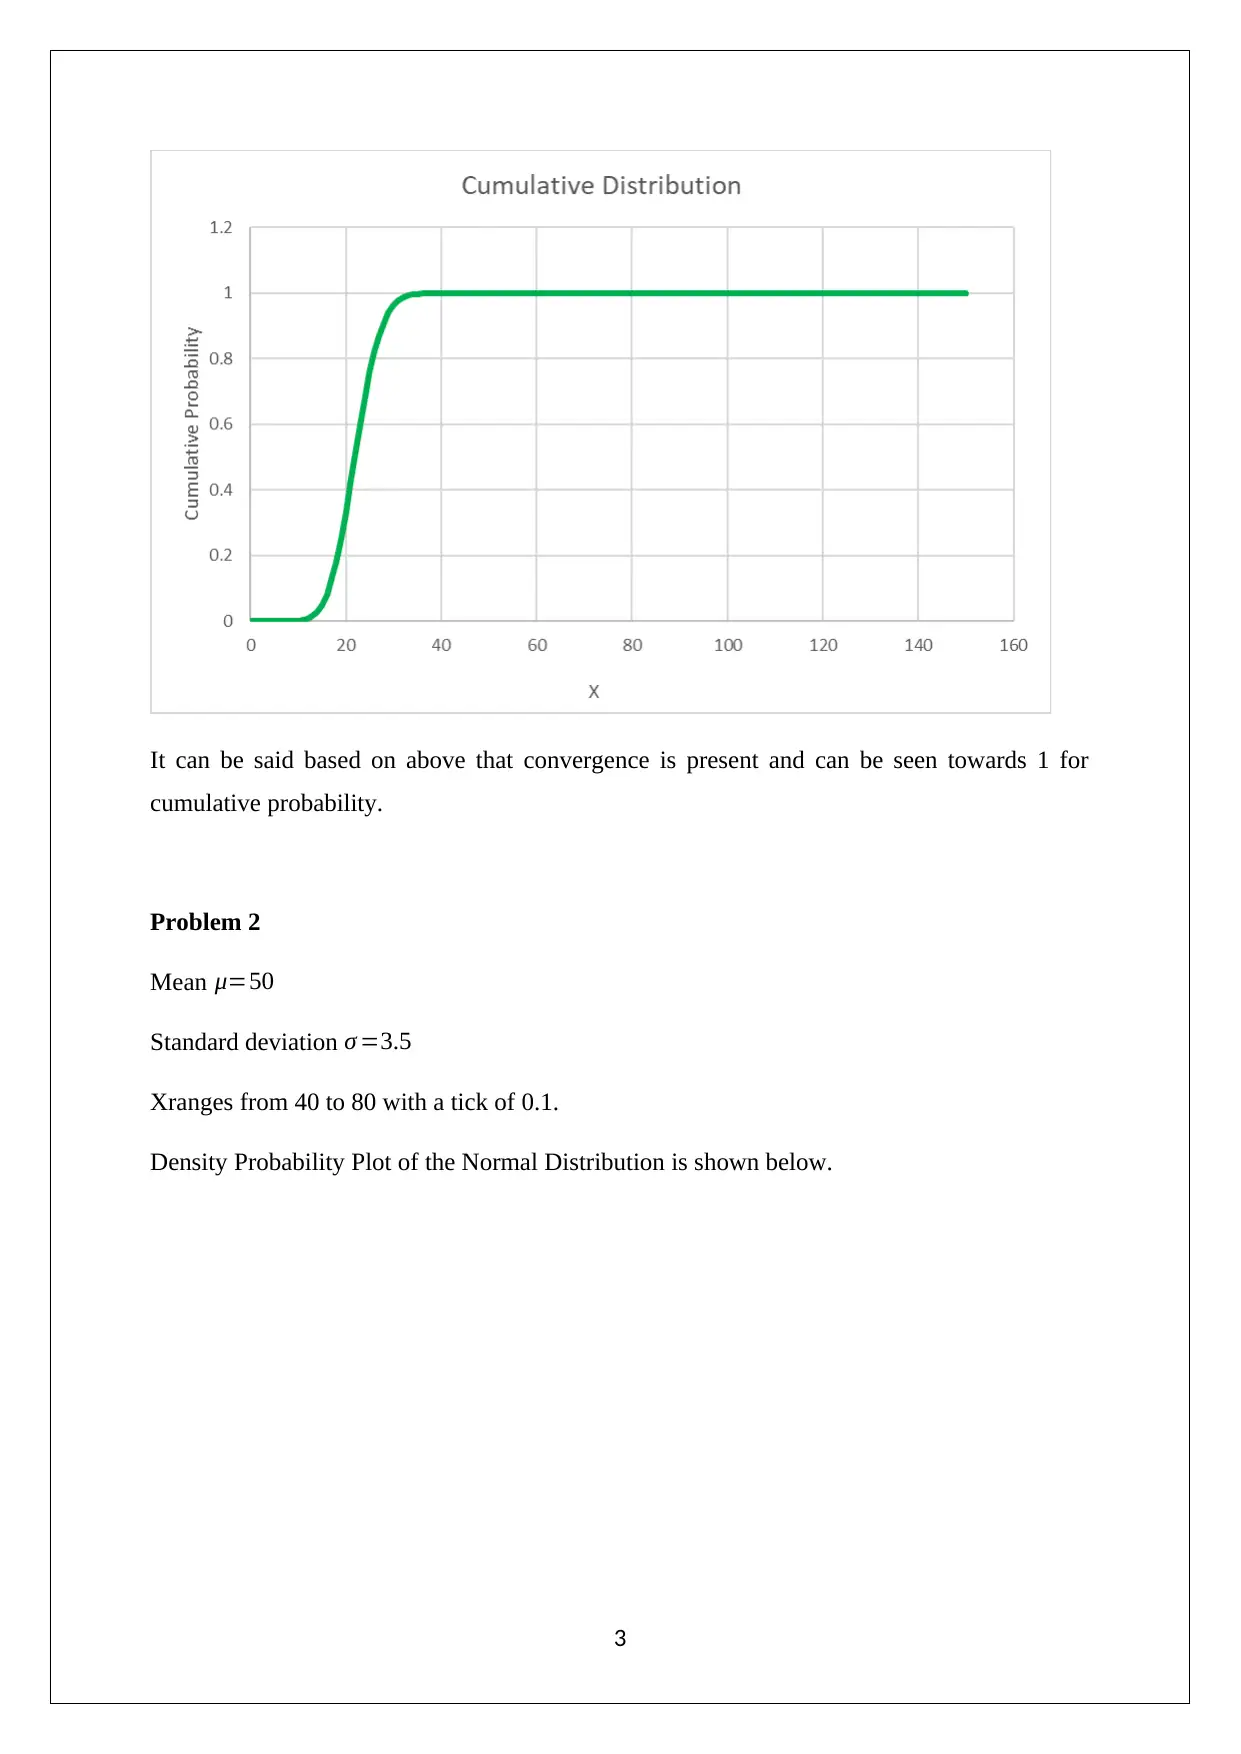
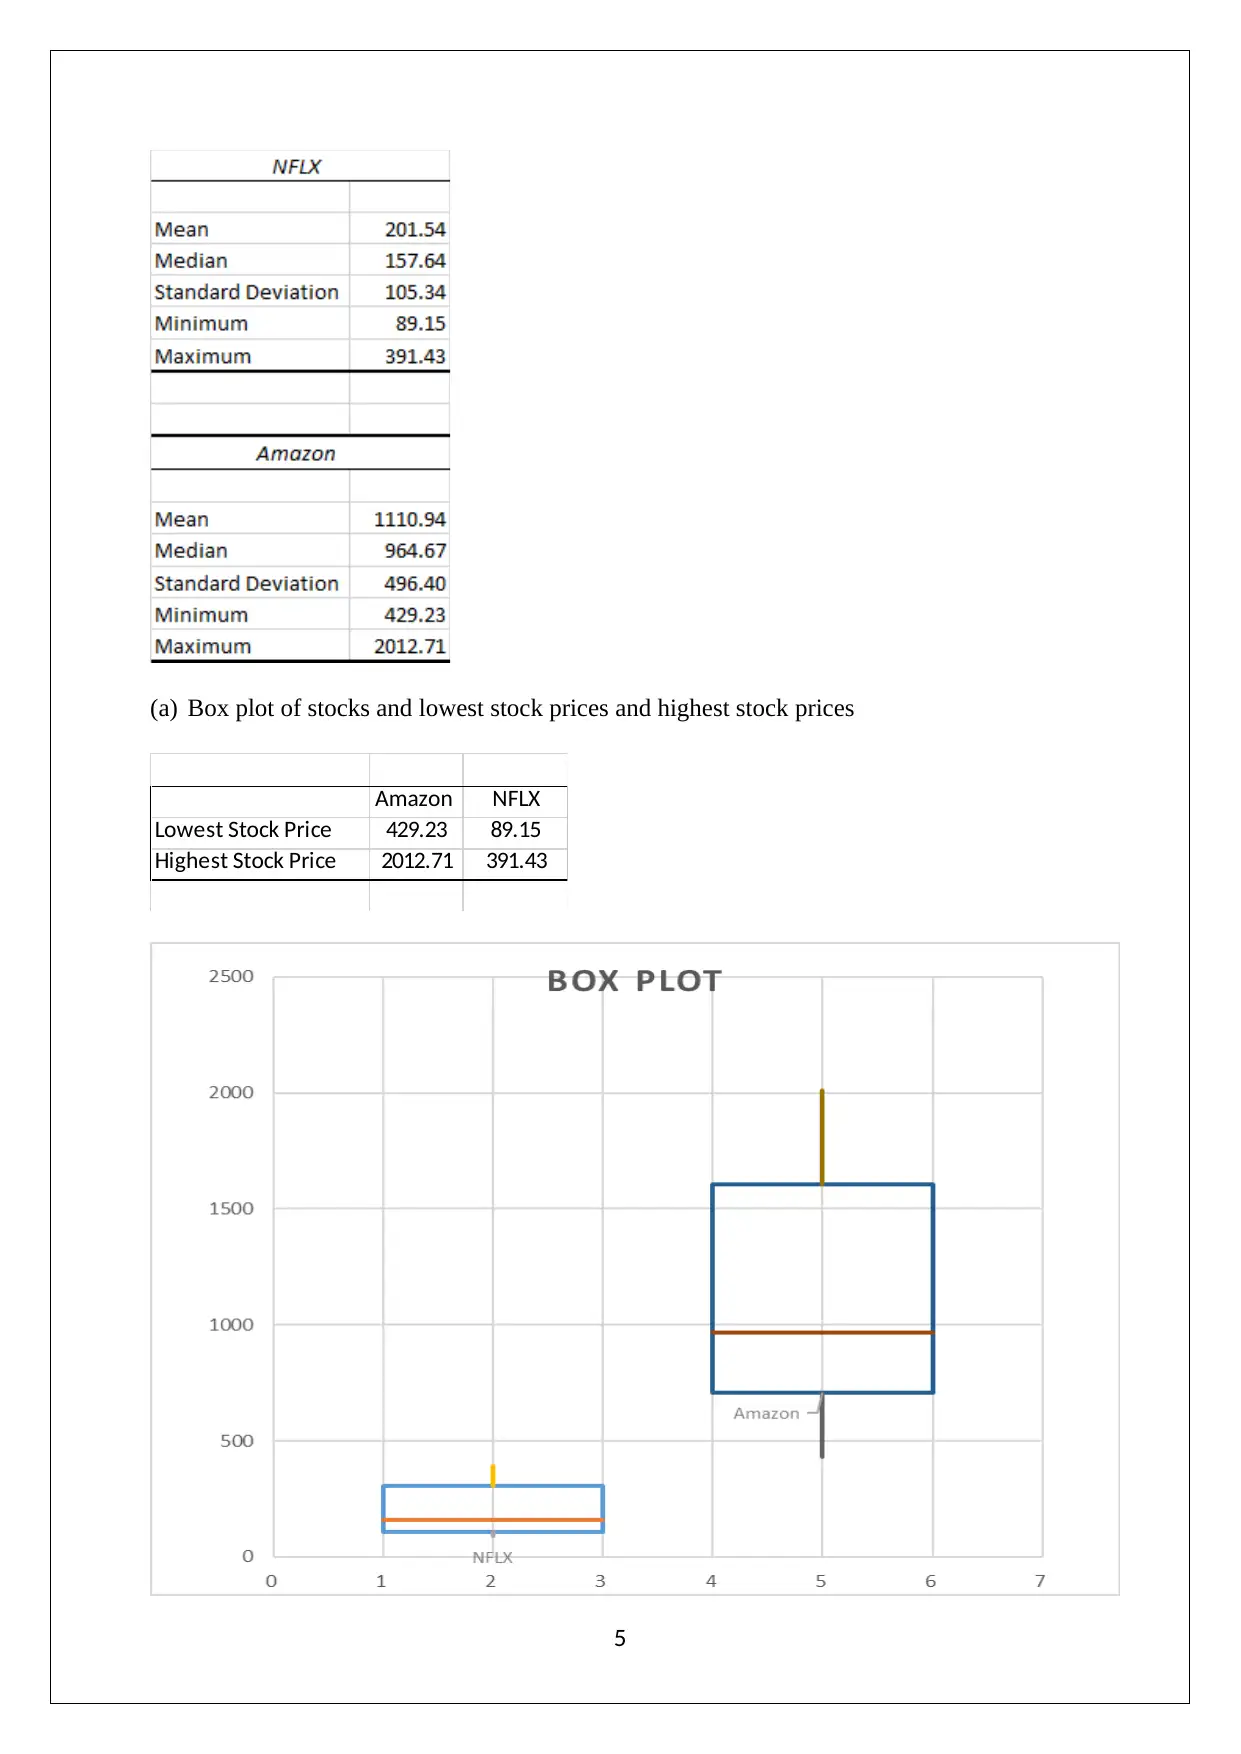
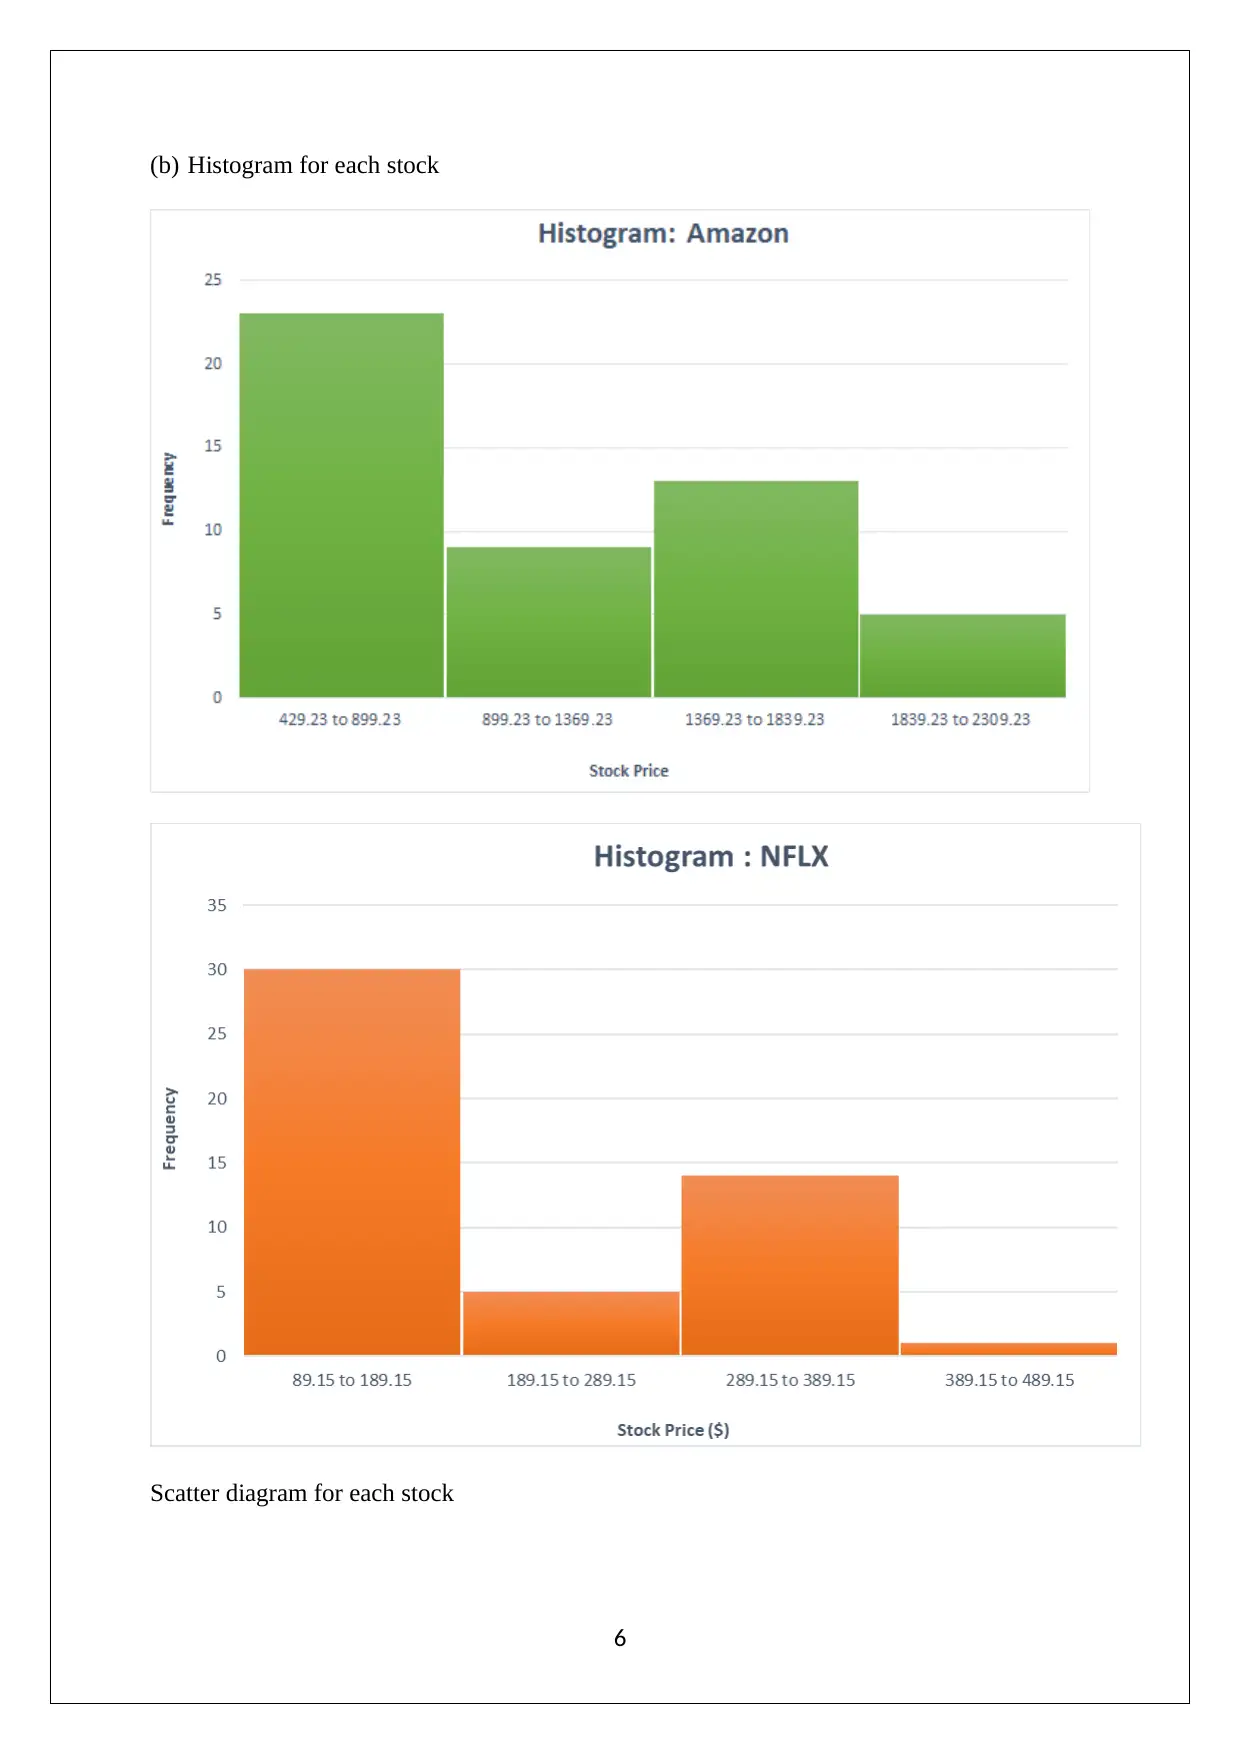
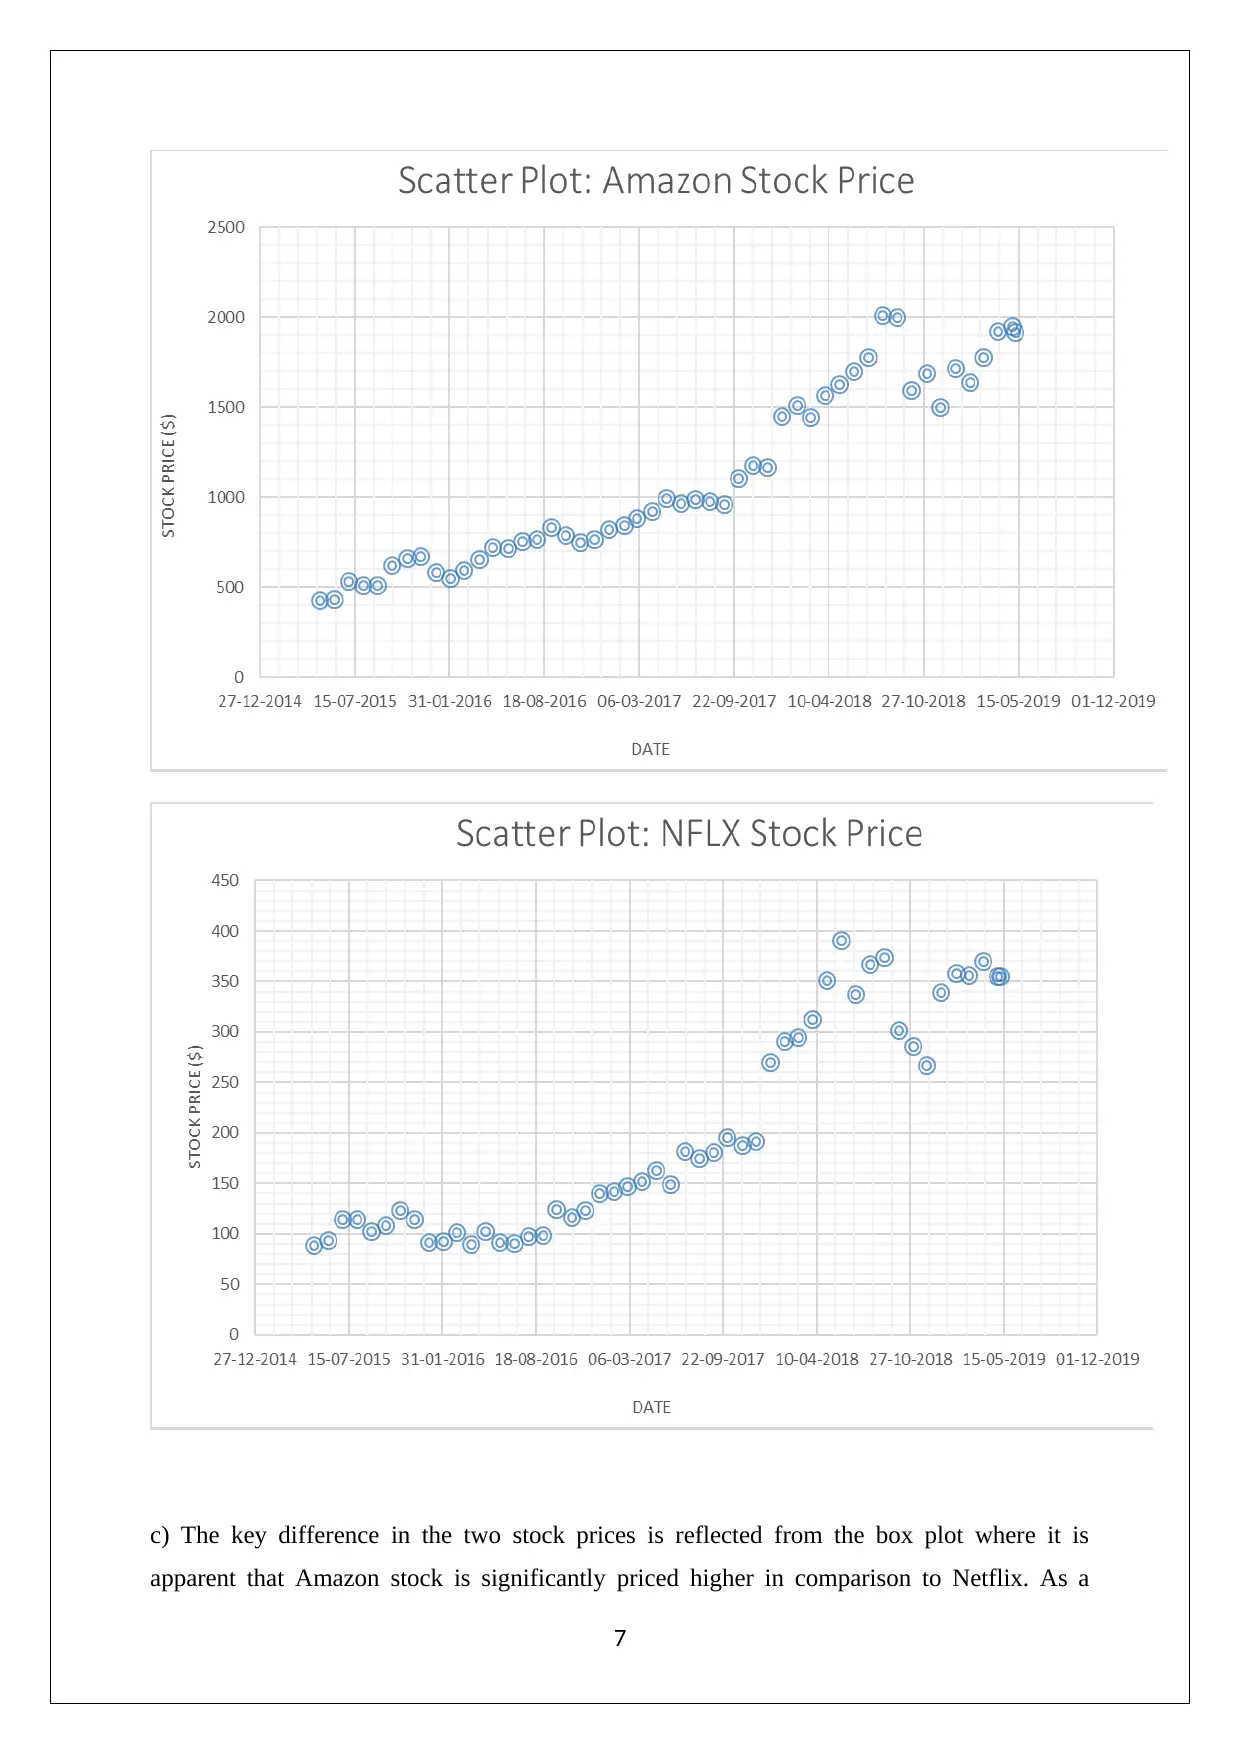
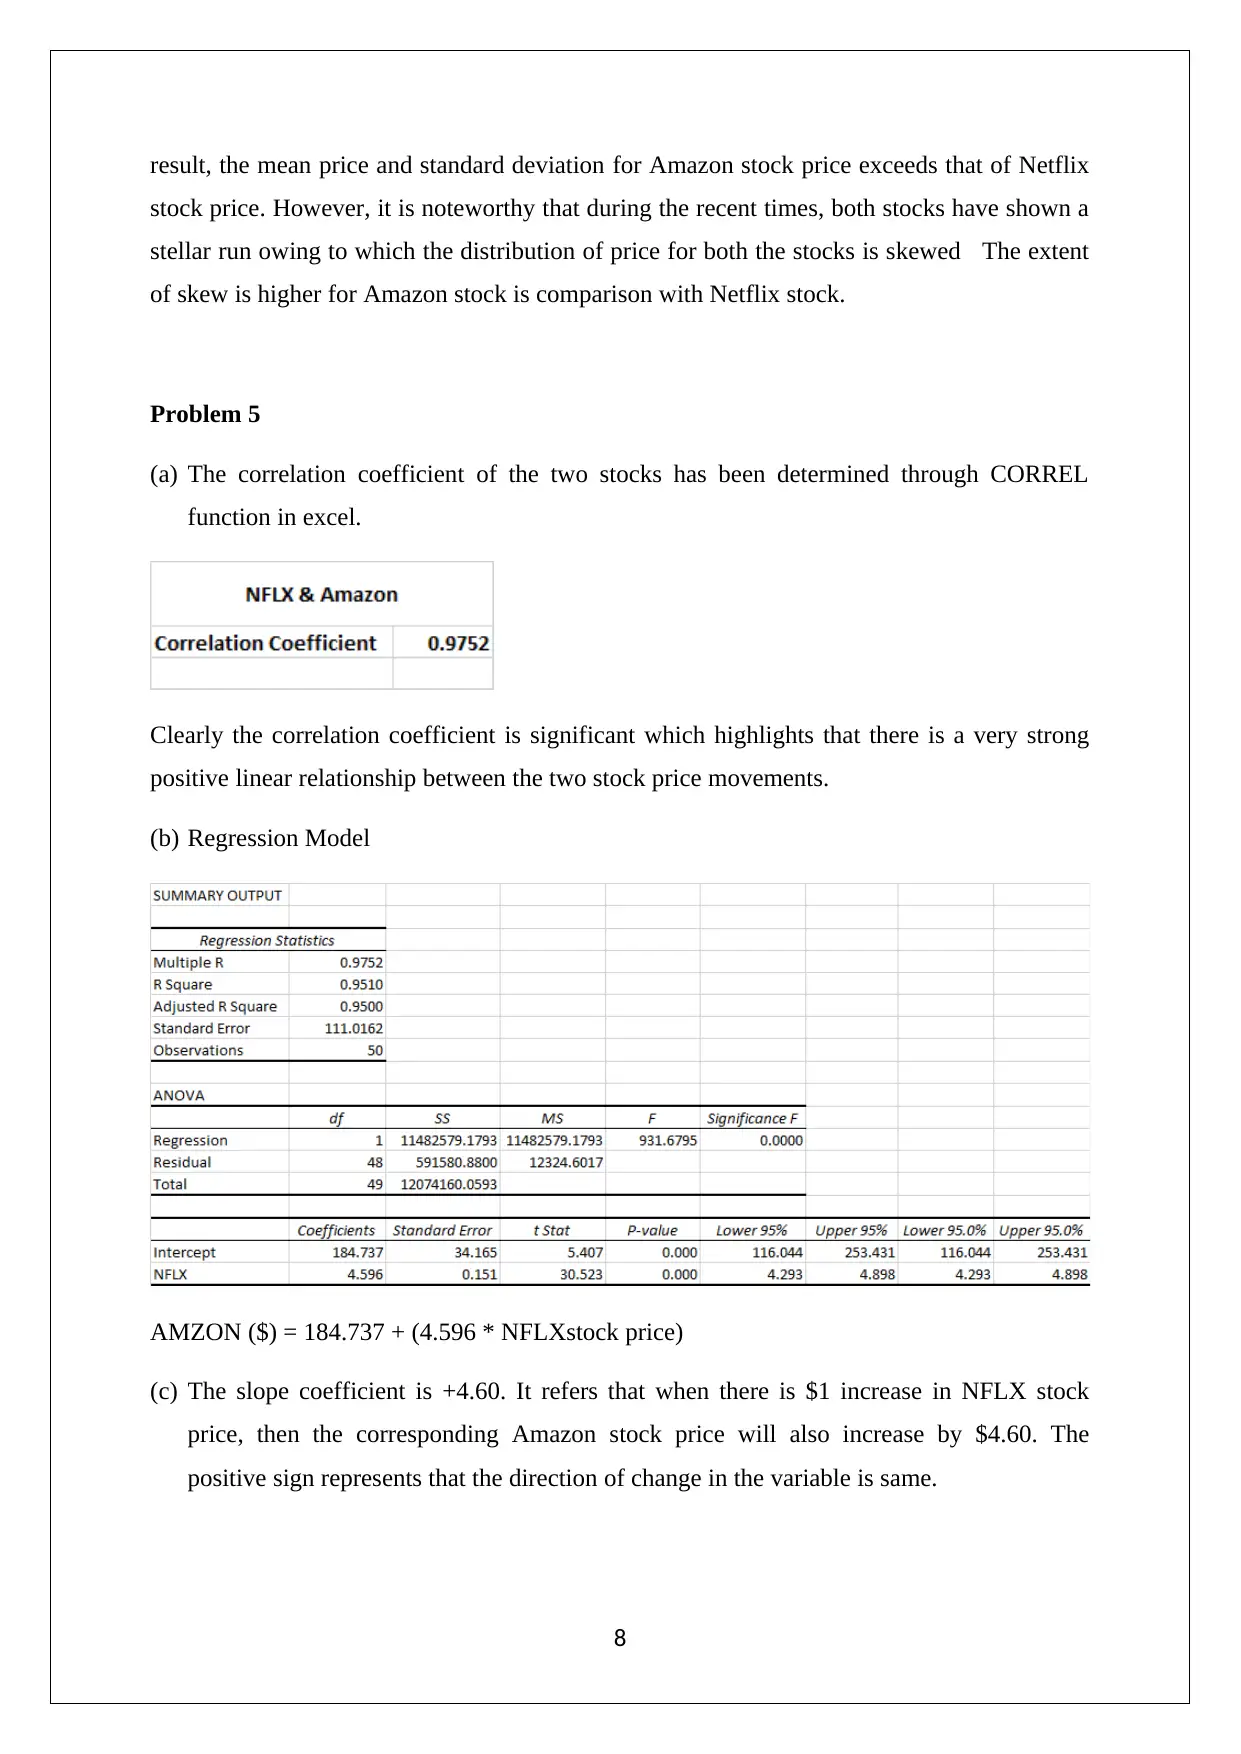
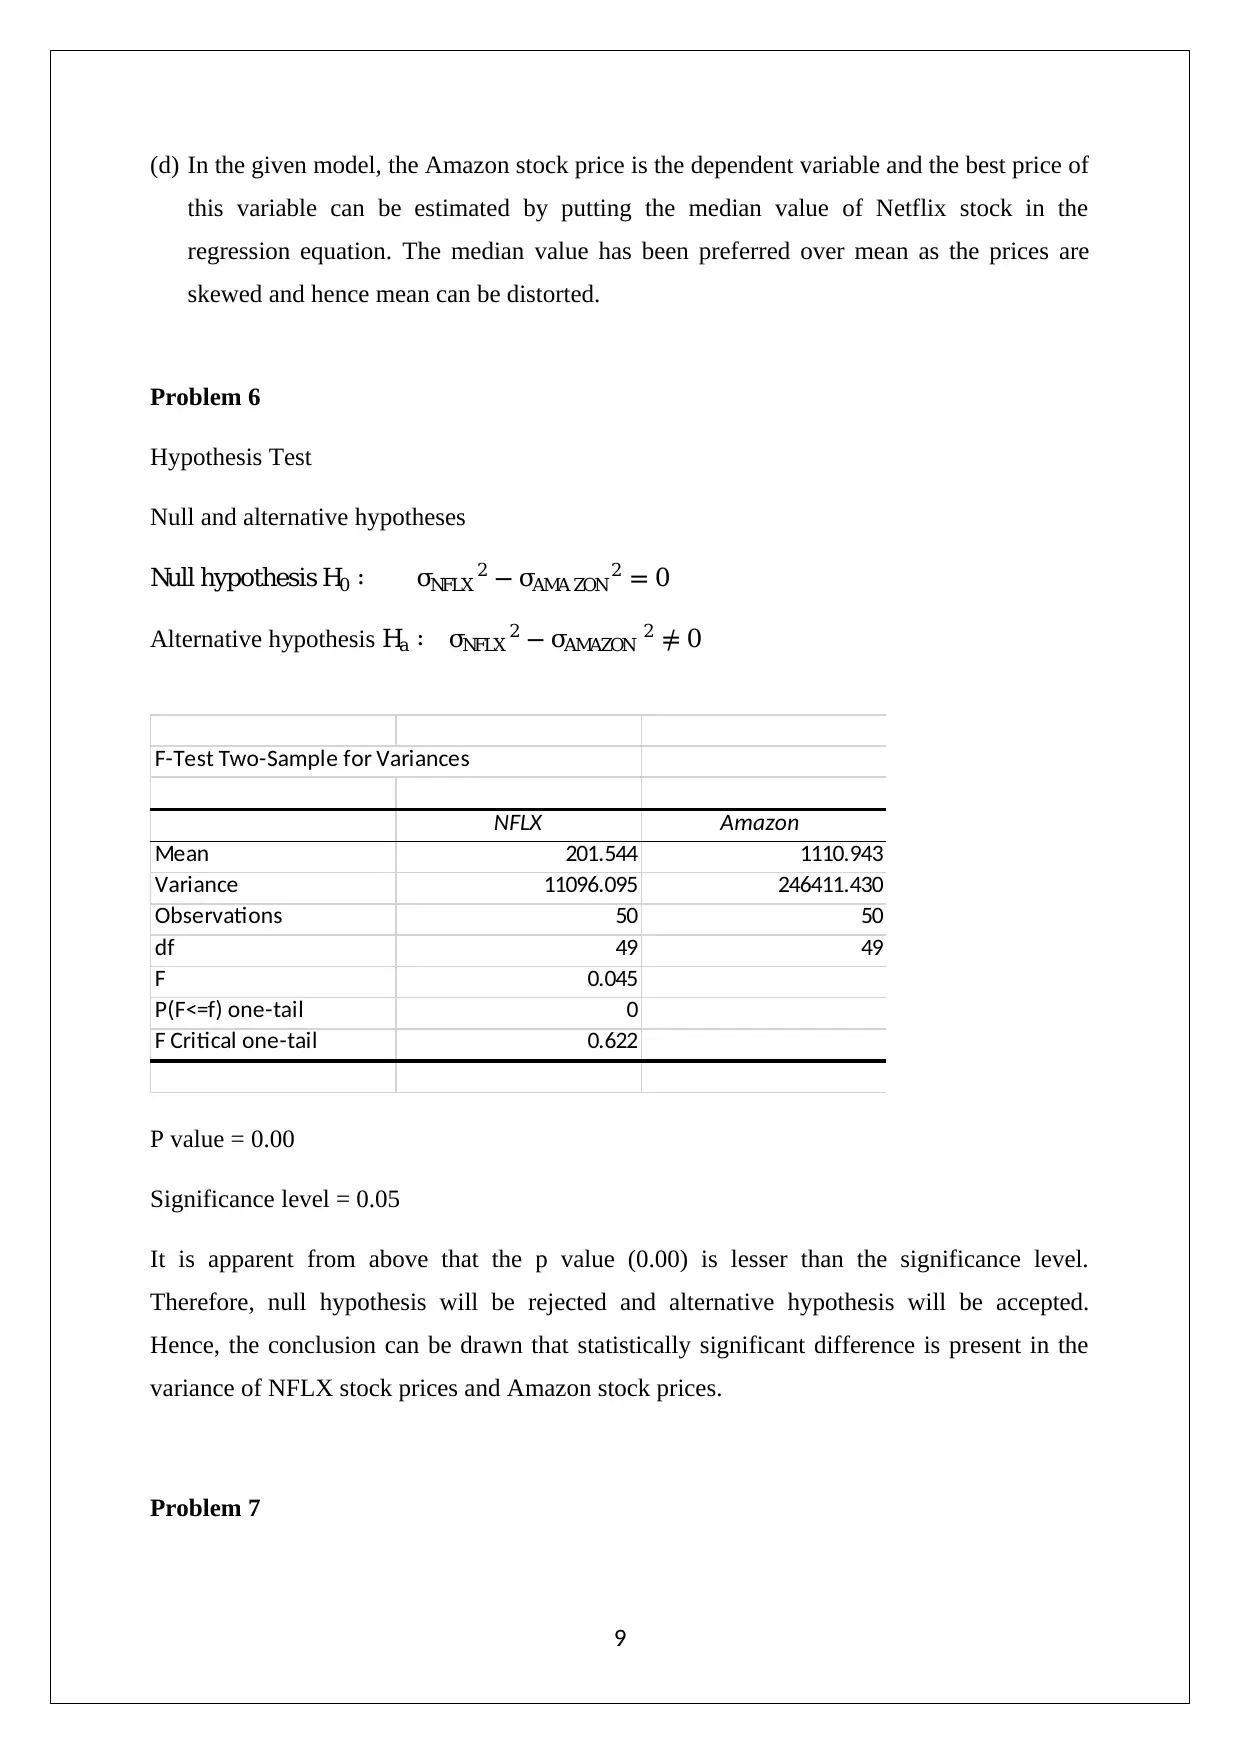
This data analysis project, completed for Pace University's Math 117 course in Spring 2019, explores several key statistical concepts and their practical applications. The project begins with an analysis of binomial distributions, including the calculation of probabilities and an examination of convergence. It then moves on to normal distributions, creating density probability plots. The core of the project focuses on a comparative analysis of two stocks, Netflix (NFLX) and Amazon, utilizing statistical tools like box plots, histograms, and scatter diagrams. The project uses regression analysis to model the relationship between the two stocks' prices, and performs hypothesis testing to compare the variance of stock prices. Furthermore, the project investigates the normality of stock returns using the Jarque-Bera test and concludes with a regression model to predict future stock prices. The analysis is conducted using Excel and statistical functions to provide a comprehensive view of data analysis techniques in a real-world context.

1 out of 11
Related Documents


Your All-in-One AI-Powered Toolkit for Academic Success.
+13062052269
info@desklib.com
Available 24*7 on WhatsApp / Email
![[object Object]](/_next/static/media/star-bottom.7253800d.svg)
Copyright © 2020–2026 A2Z Services. All Rights Reserved. Developed and managed by ZUCOL.