Financial Analysis and Performance of Pacific Energy Limited Project
VerifiedAdded on 2020/05/16
|27
|6078
|33
Project
AI Summary
This project report provides a comprehensive financial analysis of Pacific Energy Limited (PEA), an Australian company in the utility industry. The report begins with a company description, detailing its operations, ownership structure, and governance. It then delves into performance ratios such as ROA, ROE, and debt ratios, evaluating PEA's financial health. The analysis includes an examination of stock price changes, significant factors influencing the stock, and calculations of CAPM and beta values to assess investment risk and return. Furthermore, the report covers WACC calculations, gearing ratios, and the company's dividend policy. Finally, the report offers recommendations based on the analysis and concludes with an overview of PEA's financial performance and strategic positioning. The report utilizes data from the company's annual reports and other financial sources to provide a detailed and insightful evaluation of PEA's financial standing and investment potential.
Running Head: Finance For Business
1
Project Report: Finance for business
1
Project Report: Finance for business
Paraphrase This Document
Need a fresh take? Get an instant paraphrase of this document with our AI Paraphraser
Finance For Business
2
Contents
Introduction.......................................................................................................................3
1. Company description...............................................................................................3
2. Ownership governance structure.............................................................................3
3. Performance ratios...................................................................................................4
4. Changes in stock price.............................................................................................6
5. Significant factors....................................................................................................7
6. Calculation of CAPM and beta values.....................................................................8
7. WACC calculations.................................................................................................8
8. Debt ratios................................................................................................................9
9. Dividend policy......................................................................................................10
10. Recommendation and Conclusion.........................................................................10
References.......................................................................................................................11
Appendix.........................................................................................................................13
Finance For Business
3
Introduction:
Financial management is a stream of management which makes it easy for the
company to analyze, evaluate and determine the required changes for the betterment of the
organization. The financial management assist the company to choose the best project and
make better decision about the operations and the activities of the company. On the other
hand, financial evaluation techniques also assist the stakeholder of the company to make
better choices about the position of the company. Financial evaluation helps the company to
manage and evaluate the better companies for the purpose of investment and it also helps
them to evaluate that what is the exact performance of the company and in the industry.
Financial evaluation involves various techniques such as IRR, NPV, Ratio analysis, vertical
analysis, WACC, required rate of return, cost of debt etc.
1. Company description:
Pacific Energy Limited is an Australian company. This company is operating its
business into Australian utility industry in which it develops, builds, manages and operates
electricity generation facilities in the Australian market. On the date of 11 Sept, 2017, this
company has operated and owned 21 diesel, gas, power stations and duel filled power
minerals along with the total power generation capacity which is approximately about 272
MW. Headquarter of the company is Landsdale, Australia. Currently, the company is
operating very well in the industry and the projects of the company are also attractive.
2. Ownership governance structure:
Further, the governance structure of the company has also been investigated and it has
been found that what the main people of the company and who are chief shareholders of the
company are (Brealey, Myers and Marcus, 2007). This study explains about the board of
members and the people who have more than 20% stake in the stock of the company.
Following is the detail about me:
Substantial stakeholders:
Substantial stakeholders are those person who has their stock in an entity and invests
the most in the company, through the annual report of the company, it has been found that the
Sept Pty Ltd <Hall Family Fund A/C> is the main stakeholders of the company and it has
around 47.73% stock in the company. Further, it expresses that the other stakeholder of the
⊘ This is a preview!⊘
Do you want full access?
Subscribe today to unlock all pages.
Trusted by 1+ million students worldwide
Finance For Business
4
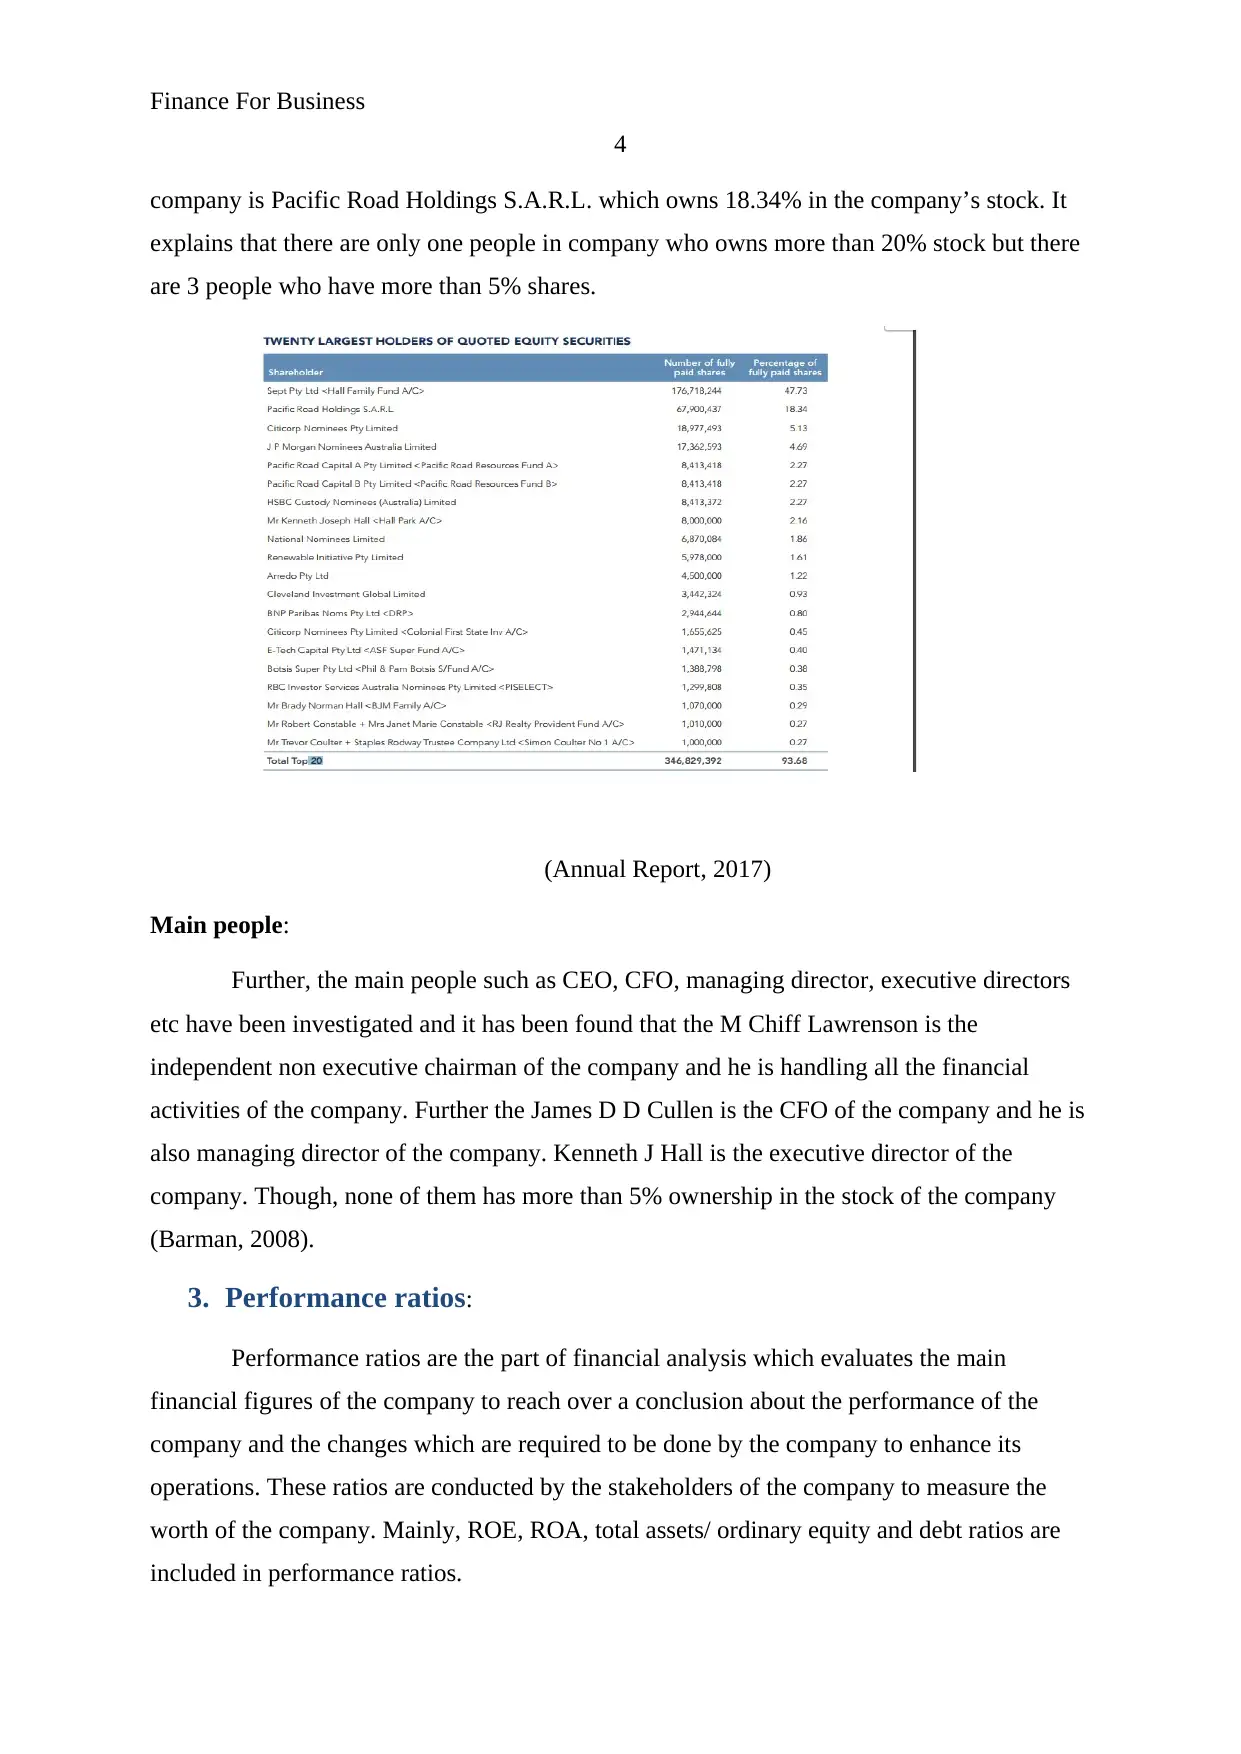
company is Pacific Road Holdings S.A.R.L. which owns 18.34% in the company’s stock. It
explains that there are only one people in company who owns more than 20% stock but there
are 3 people who have more than 5% shares.
(Annual Report, 2017)
Main people:
Further, the main people such as CEO, CFO, managing director, executive directors
etc have been investigated and it has been found that the M Chiff Lawrenson is the
independent non executive chairman of the company and he is handling all the financial
activities of the company. Further the James D D Cullen is the CFO of the company and he is
also managing director of the company. Kenneth J Hall is the executive director of the
company. Though, none of them has more than 5% ownership in the stock of the company
(Barman, 2008).
3. Performance ratios:
Performance ratios are the part of financial analysis which evaluates the main
financial figures of the company to reach over a conclusion about the performance of the
company and the changes which are required to be done by the company to enhance its
operations. These ratios are conducted by the stakeholders of the company to measure the
worth of the company. Mainly, ROE, ROA, total assets/ ordinary equity and debt ratios are
included in performance ratios.
4
company is Pacific Road Holdings S.A.R.L. which owns 18.34% in the company’s stock. It
explains that there are only one people in company who owns more than 20% stock but there
are 3 people who have more than 5% shares.
(Annual Report, 2017)
Main people:
Further, the main people such as CEO, CFO, managing director, executive directors
etc have been investigated and it has been found that the M Chiff Lawrenson is the
independent non executive chairman of the company and he is handling all the financial
activities of the company. Further the James D D Cullen is the CFO of the company and he is
also managing director of the company. Kenneth J Hall is the executive director of the
company. Though, none of them has more than 5% ownership in the stock of the company
(Barman, 2008).
3. Performance ratios:
Performance ratios are the part of financial analysis which evaluates the main
financial figures of the company to reach over a conclusion about the performance of the
company and the changes which are required to be done by the company to enhance its
operations. These ratios are conducted by the stakeholders of the company to measure the
worth of the company. Mainly, ROE, ROA, total assets/ ordinary equity and debt ratios are
included in performance ratios.
Paraphrase This Document
Need a fresh take? Get an instant paraphrase of this document with our AI Paraphraser
Finance For Business
5
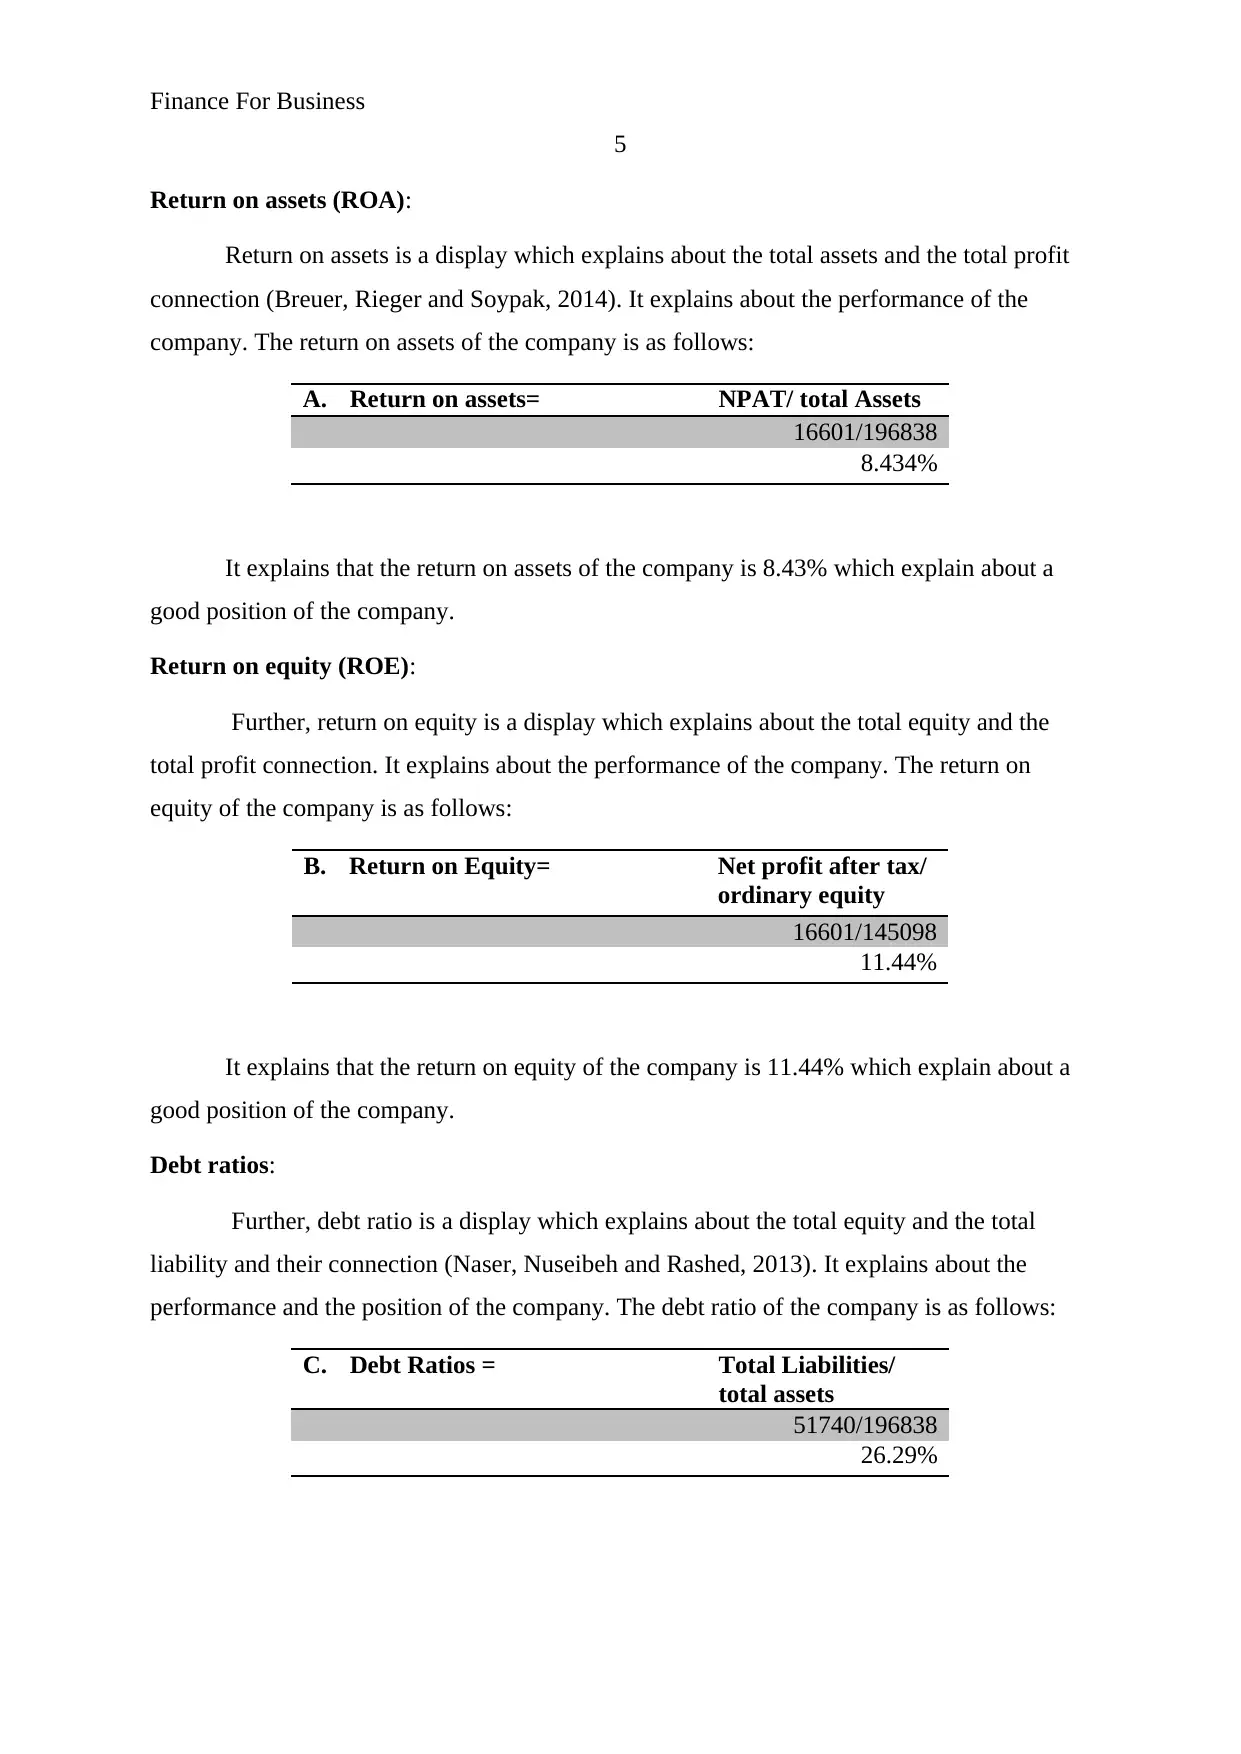
Return on assets (ROA):
Return on assets is a display which explains about the total assets and the total profit
connection (Breuer, Rieger and Soypak, 2014). It explains about the performance of the
company. The return on assets of the company is as follows:
A. Return on assets= NPAT/ total Assets
16601/196838
8.434%
It explains that the return on assets of the company is 8.43% which explain about a
good position of the company.
Return on equity (ROE):
Further, return on equity is a display which explains about the total equity and the
total profit connection. It explains about the performance of the company. The return on
equity of the company is as follows:
B. Return on Equity= Net profit after tax/
ordinary equity
16601/145098
11.44%
It explains that the return on equity of the company is 11.44% which explain about a
good position of the company.
Debt ratios:
Further, debt ratio is a display which explains about the total equity and the total
liability and their connection (Naser, Nuseibeh and Rashed, 2013). It explains about the
performance and the position of the company. The debt ratio of the company is as follows:
C. Debt Ratios = Total Liabilities/
total assets
51740/196838
26.29%
5
Return on assets (ROA):
Return on assets is a display which explains about the total assets and the total profit
connection (Breuer, Rieger and Soypak, 2014). It explains about the performance of the
company. The return on assets of the company is as follows:
A. Return on assets= NPAT/ total Assets
16601/196838
8.434%
It explains that the return on assets of the company is 8.43% which explain about a
good position of the company.
Return on equity (ROE):
Further, return on equity is a display which explains about the total equity and the
total profit connection. It explains about the performance of the company. The return on
equity of the company is as follows:
B. Return on Equity= Net profit after tax/
ordinary equity
16601/145098
11.44%
It explains that the return on equity of the company is 11.44% which explain about a
good position of the company.
Debt ratios:
Further, debt ratio is a display which explains about the total equity and the total
liability and their connection (Naser, Nuseibeh and Rashed, 2013). It explains about the
performance and the position of the company. The debt ratio of the company is as follows:
C. Debt Ratios = Total Liabilities/
total assets
51740/196838
26.29%
Finance For Business
6
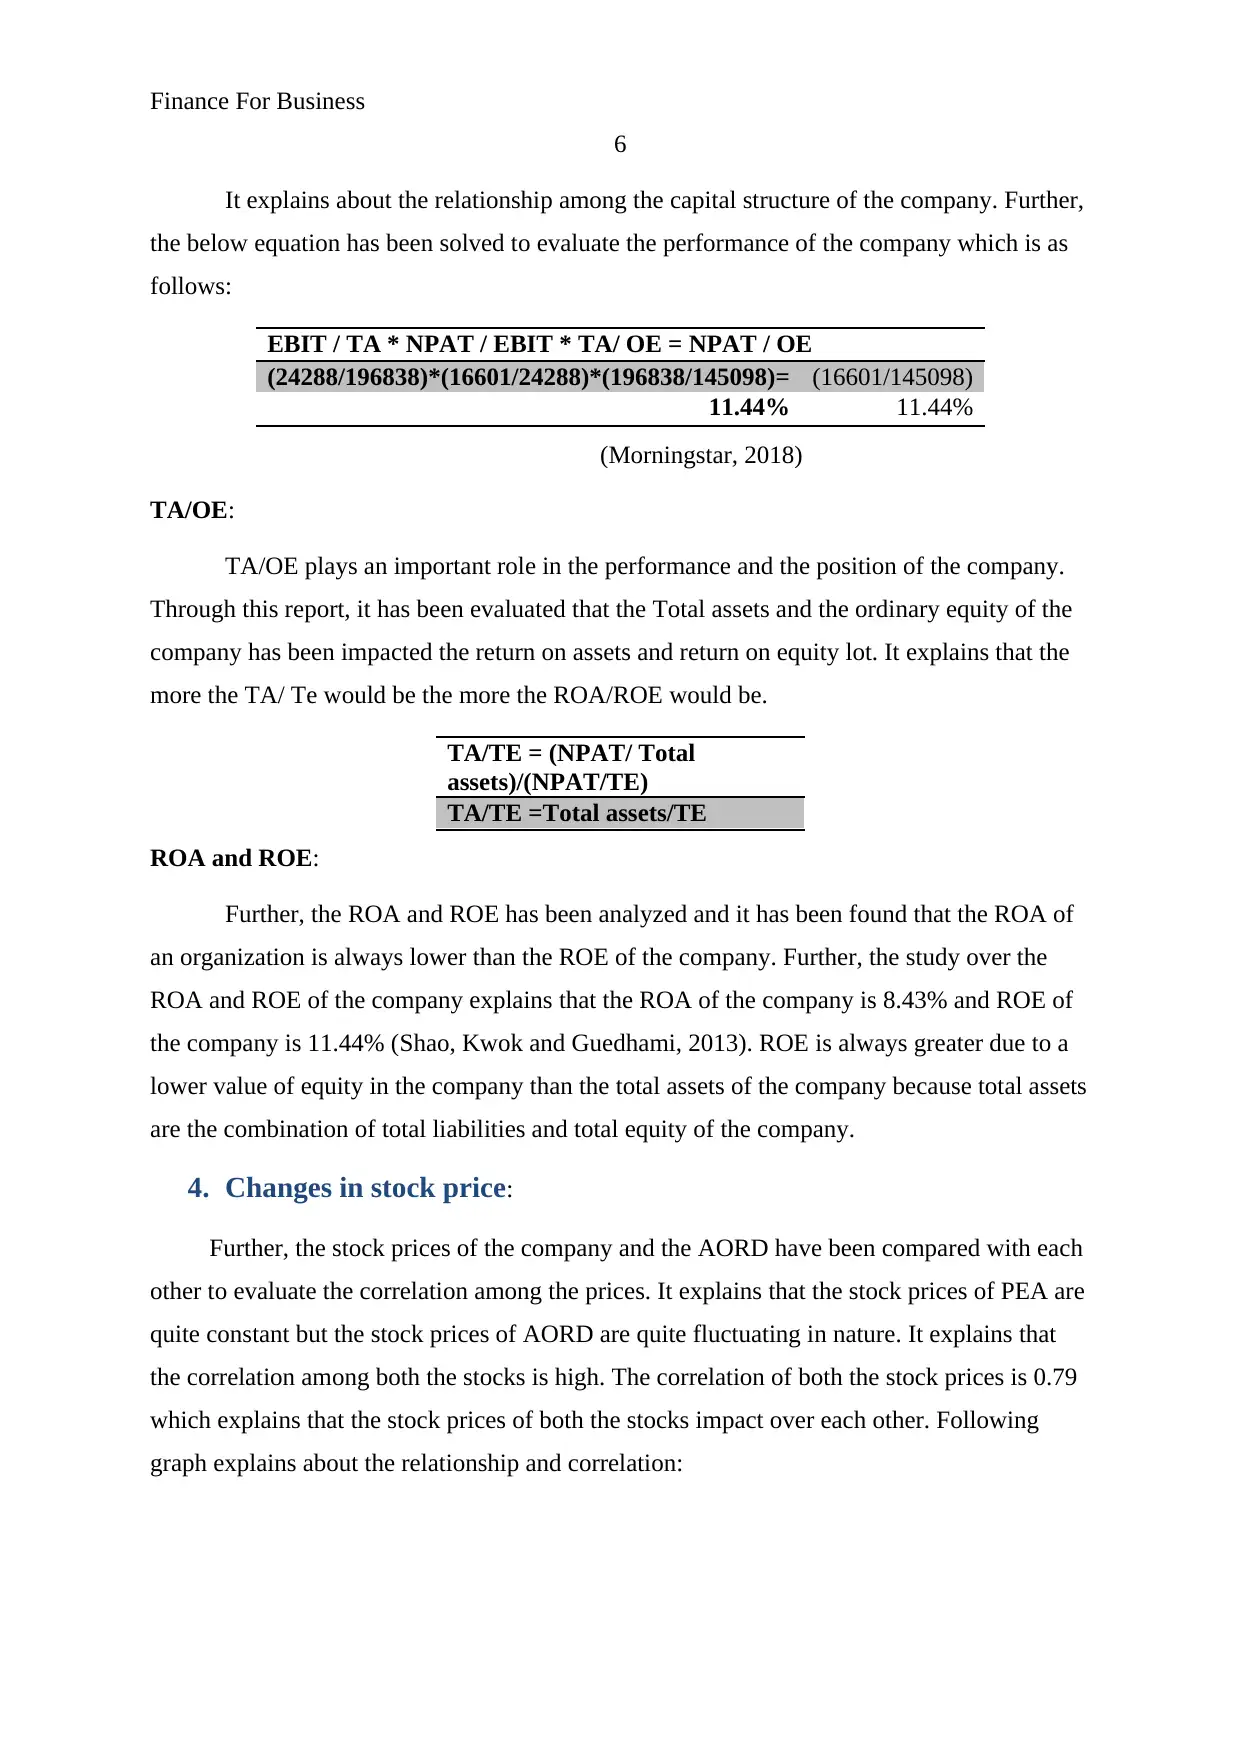
It explains about the relationship among the capital structure of the company. Further,
the below equation has been solved to evaluate the performance of the company which is as
follows:
EBIT / TA * NPAT / EBIT * TA/ OE = NPAT / OE
(24288/196838)*(16601/24288)*(196838/145098)= (16601/145098)
11.44% 11.44%
(Morningstar, 2018)
TA/OE:
TA/OE plays an important role in the performance and the position of the company.
Through this report, it has been evaluated that the Total assets and the ordinary equity of the
company has been impacted the return on assets and return on equity lot. It explains that the
more the TA/ Te would be the more the ROA/ROE would be.
TA/TE = (NPAT/ Total
assets)/(NPAT/TE)
TA/TE =Total assets/TE
ROA and ROE:
Further, the ROA and ROE has been analyzed and it has been found that the ROA of
an organization is always lower than the ROE of the company. Further, the study over the
ROA and ROE of the company explains that the ROA of the company is 8.43% and ROE of
the company is 11.44% (Shao, Kwok and Guedhami, 2013). ROE is always greater due to a
lower value of equity in the company than the total assets of the company because total assets
are the combination of total liabilities and total equity of the company.
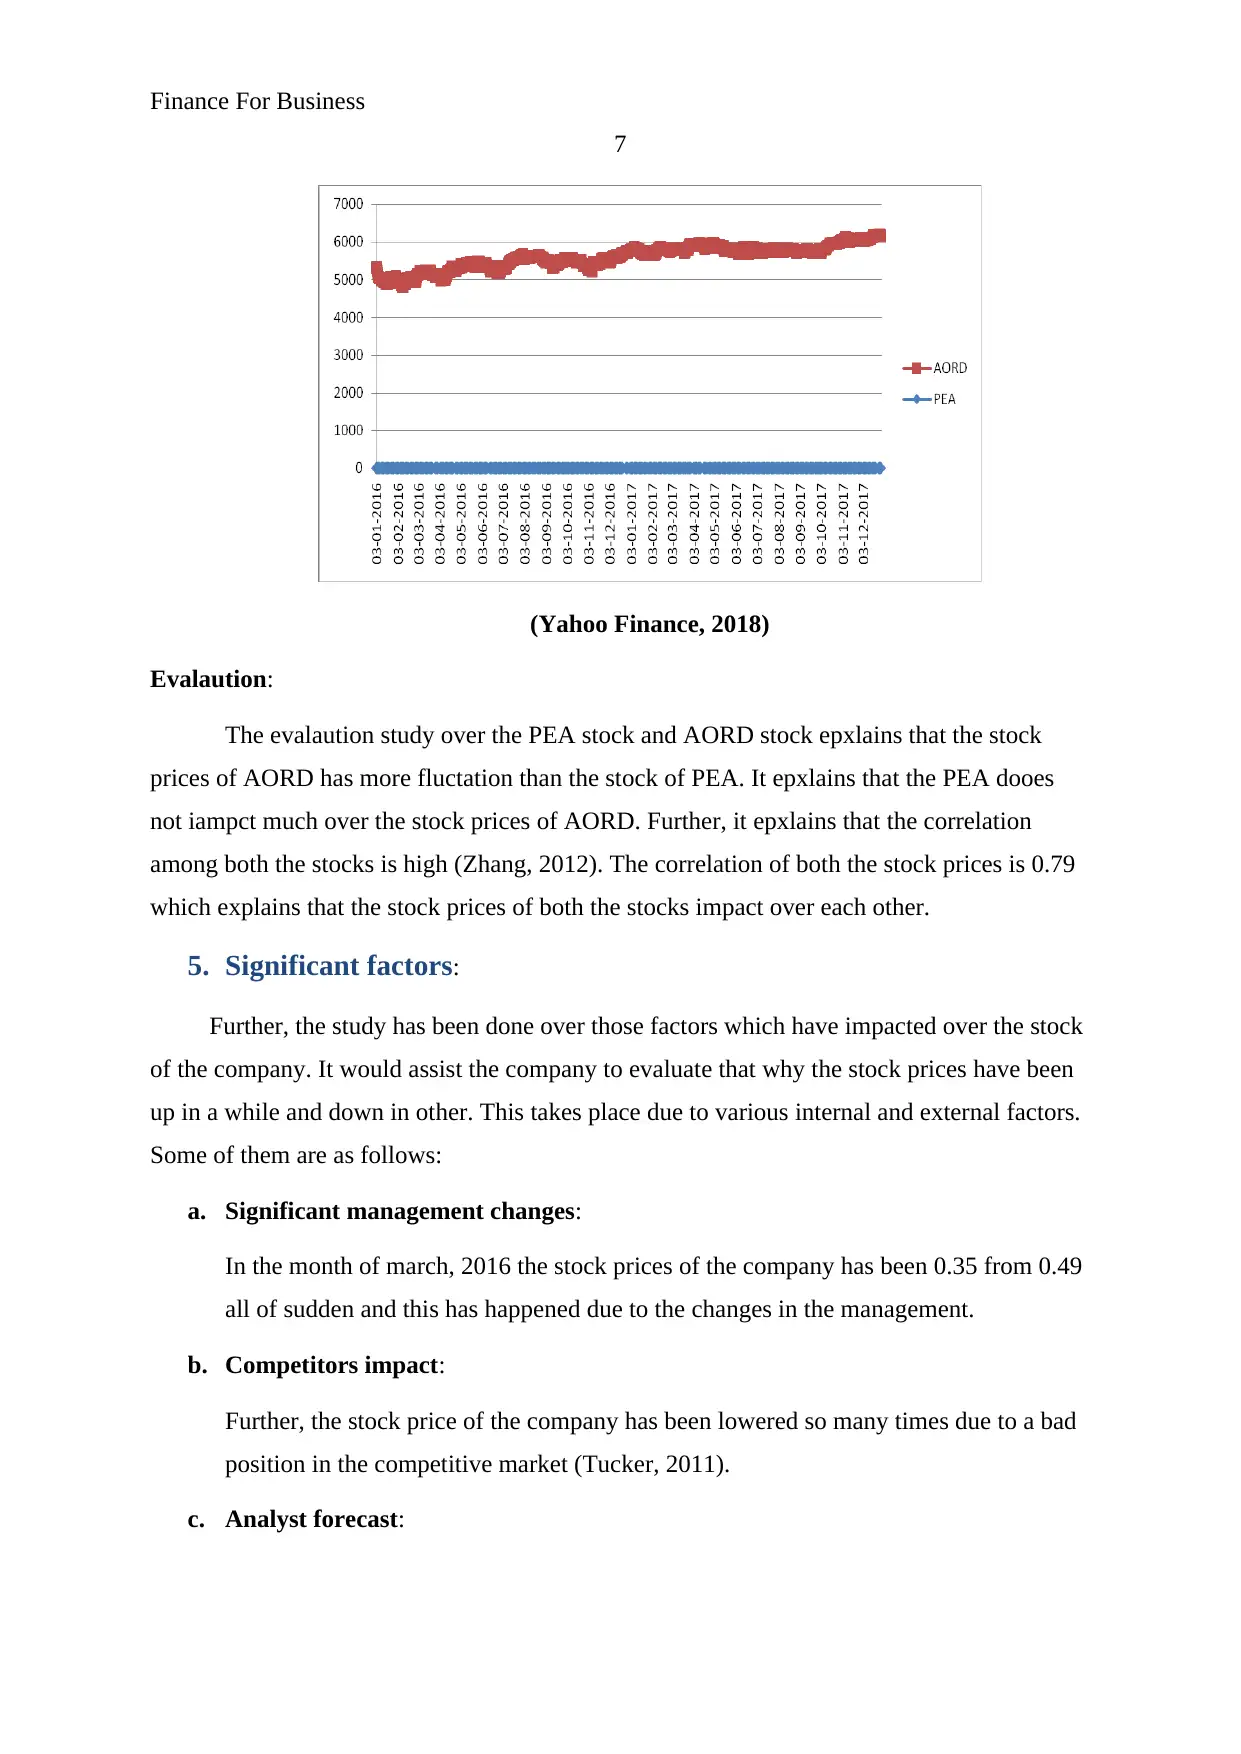
4. Changes in stock price:
Further, the stock prices of the company and the AORD have been compared with each
other to evaluate the correlation among the prices. It explains that the stock prices of PEA are
quite constant but the stock prices of AORD are quite fluctuating in nature. It explains that
the correlation among both the stocks is high. The correlation of both the stock prices is 0.79
which explains that the stock prices of both the stocks impact over each other. Following
graph explains about the relationship and correlation:
6
It explains about the relationship among the capital structure of the company. Further,
the below equation has been solved to evaluate the performance of the company which is as
follows:
EBIT / TA * NPAT / EBIT * TA/ OE = NPAT / OE
(24288/196838)*(16601/24288)*(196838/145098)= (16601/145098)
11.44% 11.44%
(Morningstar, 2018)
TA/OE:
TA/OE plays an important role in the performance and the position of the company.
Through this report, it has been evaluated that the Total assets and the ordinary equity of the
company has been impacted the return on assets and return on equity lot. It explains that the
more the TA/ Te would be the more the ROA/ROE would be.
TA/TE = (NPAT/ Total
assets)/(NPAT/TE)
TA/TE =Total assets/TE
ROA and ROE:
Further, the ROA and ROE has been analyzed and it has been found that the ROA of
an organization is always lower than the ROE of the company. Further, the study over the
ROA and ROE of the company explains that the ROA of the company is 8.43% and ROE of
the company is 11.44% (Shao, Kwok and Guedhami, 2013). ROE is always greater due to a
lower value of equity in the company than the total assets of the company because total assets
are the combination of total liabilities and total equity of the company.
4. Changes in stock price:
Further, the stock prices of the company and the AORD have been compared with each
other to evaluate the correlation among the prices. It explains that the stock prices of PEA are
quite constant but the stock prices of AORD are quite fluctuating in nature. It explains that
the correlation among both the stocks is high. The correlation of both the stock prices is 0.79
which explains that the stock prices of both the stocks impact over each other. Following
graph explains about the relationship and correlation:
⊘ This is a preview!⊘
Do you want full access?
Subscribe today to unlock all pages.
Trusted by 1+ million students worldwide
Finance For Business
7
(Yahoo Finance, 2018)
Evalaution:
The evalaution study over the PEA stock and AORD stock epxlains that the stock
prices of AORD has more fluctation than the stock of PEA. It epxlains that the PEA dooes
not iampct much over the stock prices of AORD. Further, it epxlains that the correlation
among both the stocks is high (Zhang, 2012). The correlation of both the stock prices is 0.79
which explains that the stock prices of both the stocks impact over each other.
5. Significant factors:
Further, the study has been done over those factors which have impacted over the stock
of the company. It would assist the company to evaluate that why the stock prices have been
up in a while and down in other. This takes place due to various internal and external factors.
Some of them are as follows:
a. Significant management changes:
In the month of march, 2016 the stock prices of the company has been 0.35 from 0.49
all of sudden and this has happened due to the changes in the management.
b. Competitors impact:
Further, the stock price of the company has been lowered so many times due to a bad
position in the competitive market (Tucker, 2011).
c. Analyst forecast:
Paraphrase This Document
Need a fresh take? Get an instant paraphrase of this document with our AI Paraphraser
Finance For Business
8
At the time of Oct, 2017, stock price of the company has been enhanced a lot and this
has taken place due to an announcement about the better position and performance of
entity.
d. Law suits:
Further, various law suits and their decision have also make an impacted over the
performance of the company.
e. Industry wide factors:
Lastly, it has been found that industry factors also make an impact over the stock
prices of the company.
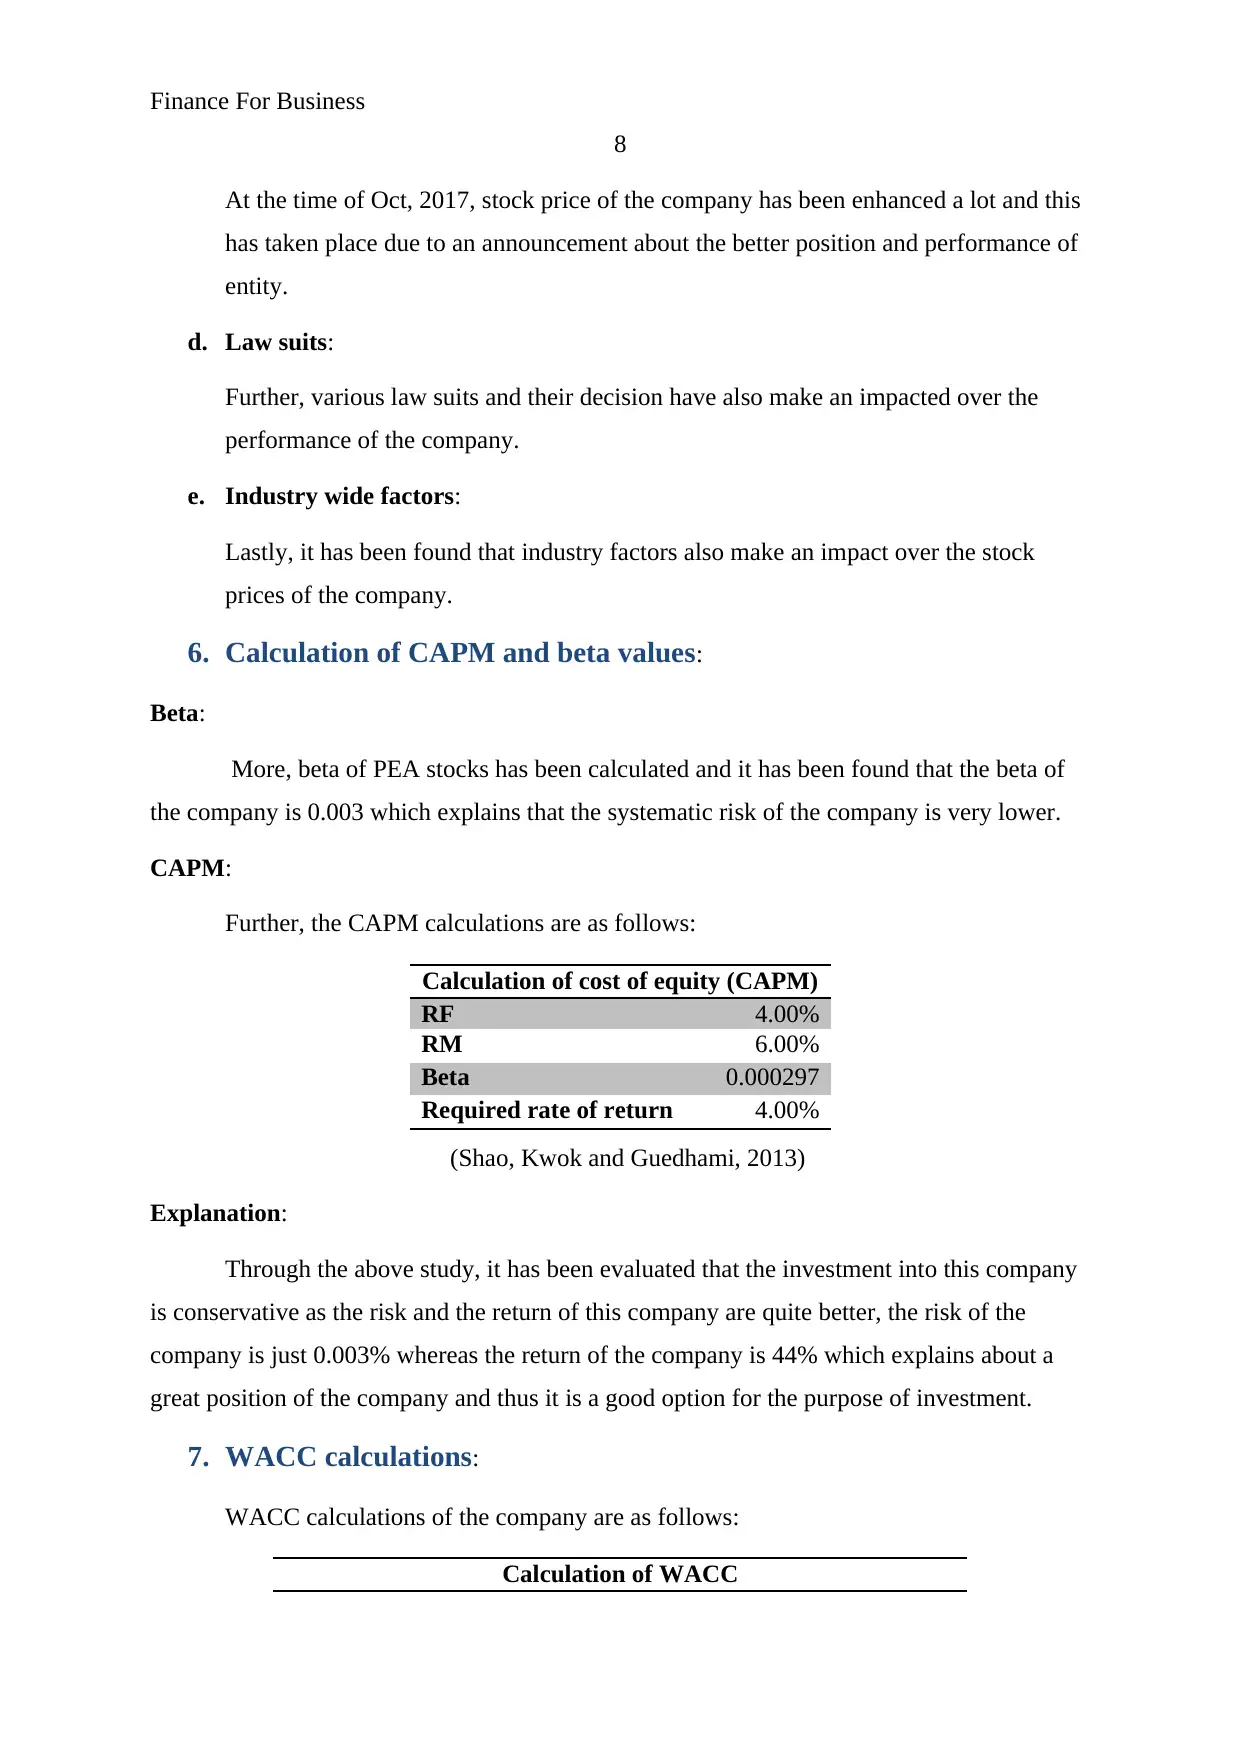
6. Calculation of CAPM and beta values:
Beta:
More, beta of PEA stocks has been calculated and it has been found that the beta of
the company is 0.003 which explains that the systematic risk of the company is very lower.
CAPM:
Further, the CAPM calculations are as follows:
Calculation of cost of equity (CAPM)
RF 4.00%
RM 6.00%
Beta 0.000297
Required rate of return 4.00%
(Shao, Kwok and Guedhami, 2013)
Explanation:
Through the above study, it has been evaluated that the investment into this company
is conservative as the risk and the return of this company are quite better, the risk of the
company is just 0.003% whereas the return of the company is 44% which explains about a
great position of the company and thus it is a good option for the purpose of investment.
7. WACC calculations:
WACC calculations of the company are as follows:
Calculation of WACC
8
At the time of Oct, 2017, stock price of the company has been enhanced a lot and this
has taken place due to an announcement about the better position and performance of
entity.
d. Law suits:
Further, various law suits and their decision have also make an impacted over the
performance of the company.
e. Industry wide factors:
Lastly, it has been found that industry factors also make an impact over the stock
prices of the company.
6. Calculation of CAPM and beta values:
Beta:
More, beta of PEA stocks has been calculated and it has been found that the beta of
the company is 0.003 which explains that the systematic risk of the company is very lower.
CAPM:
Further, the CAPM calculations are as follows:
Calculation of cost of equity (CAPM)
RF 4.00%
RM 6.00%
Beta 0.000297
Required rate of return 4.00%
(Shao, Kwok and Guedhami, 2013)
Explanation:
Through the above study, it has been evaluated that the investment into this company
is conservative as the risk and the return of this company are quite better, the risk of the
company is just 0.003% whereas the return of the company is 44% which explains about a
great position of the company and thus it is a good option for the purpose of investment.
7. WACC calculations:
WACC calculations of the company are as follows:
Calculation of WACC
Finance For Business
9
Price Cost Weight WACC
Debt 23,901 3.50% 0.17656 0.00618
Equity 1,11,472 4.00% 0.82344 0.03294
1,35,373 Kd 3.91%
Calculation of cost of debt
Outstanding debt 23,901
interest rate 5%
Tax rate 0.3
Kd 3.50%
Calculation of cost of equity
(CAPM)
RF 4.00%
RM 6.00%
Beta 0.03%
Required rate of return 4.00%
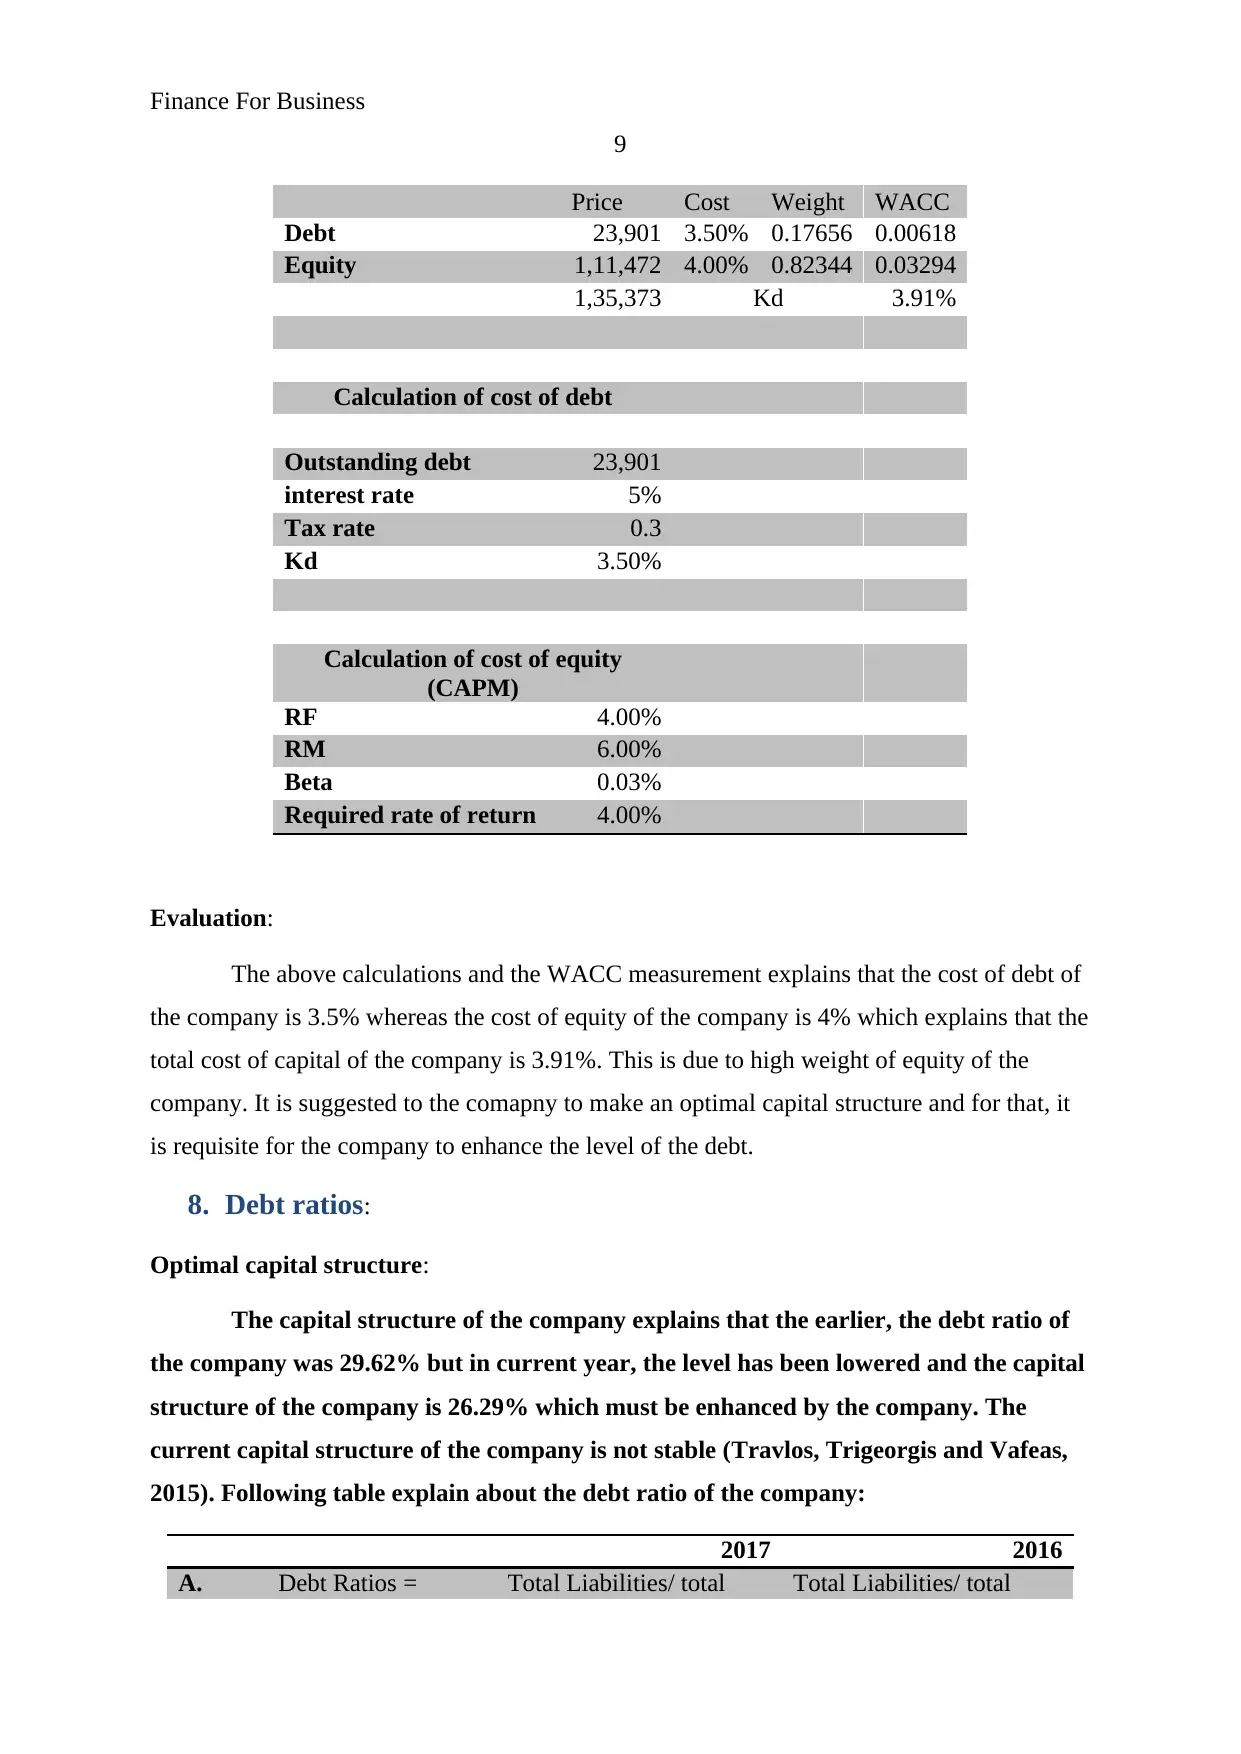
Evaluation:
The above calculations and the WACC measurement explains that the cost of debt of
the company is 3.5% whereas the cost of equity of the company is 4% which explains that the
total cost of capital of the company is 3.91%. This is due to high weight of equity of the
company. It is suggested to the comapny to make an optimal capital structure and for that, it
is requisite for the company to enhance the level of the debt.
8. Debt ratios:
Optimal capital structure:
The capital structure of the company explains that the earlier, the debt ratio of
the company was 29.62% but in current year, the level has been lowered and the capital
structure of the company is 26.29% which must be enhanced by the company. The
current capital structure of the company is not stable (Travlos, Trigeorgis and Vafeas,
2015). Following table explain about the debt ratio of the company:
2017 2016
A. Debt Ratios = Total Liabilities/ total Total Liabilities/ total
9
Price Cost Weight WACC
Debt 23,901 3.50% 0.17656 0.00618
Equity 1,11,472 4.00% 0.82344 0.03294
1,35,373 Kd 3.91%
Calculation of cost of debt
Outstanding debt 23,901
interest rate 5%
Tax rate 0.3
Kd 3.50%
Calculation of cost of equity
(CAPM)
RF 4.00%
RM 6.00%
Beta 0.03%
Required rate of return 4.00%
Evaluation:
The above calculations and the WACC measurement explains that the cost of debt of
the company is 3.5% whereas the cost of equity of the company is 4% which explains that the
total cost of capital of the company is 3.91%. This is due to high weight of equity of the
company. It is suggested to the comapny to make an optimal capital structure and for that, it
is requisite for the company to enhance the level of the debt.
8. Debt ratios:
Optimal capital structure:
The capital structure of the company explains that the earlier, the debt ratio of
the company was 29.62% but in current year, the level has been lowered and the capital
structure of the company is 26.29% which must be enhanced by the company. The
current capital structure of the company is not stable (Travlos, Trigeorgis and Vafeas,
2015). Following table explain about the debt ratio of the company:
2017 2016
A. Debt Ratios = Total Liabilities/ total Total Liabilities/ total
⊘ This is a preview!⊘
Do you want full access?
Subscribe today to unlock all pages.
Trusted by 1+ million students worldwide
Finance For Business
10
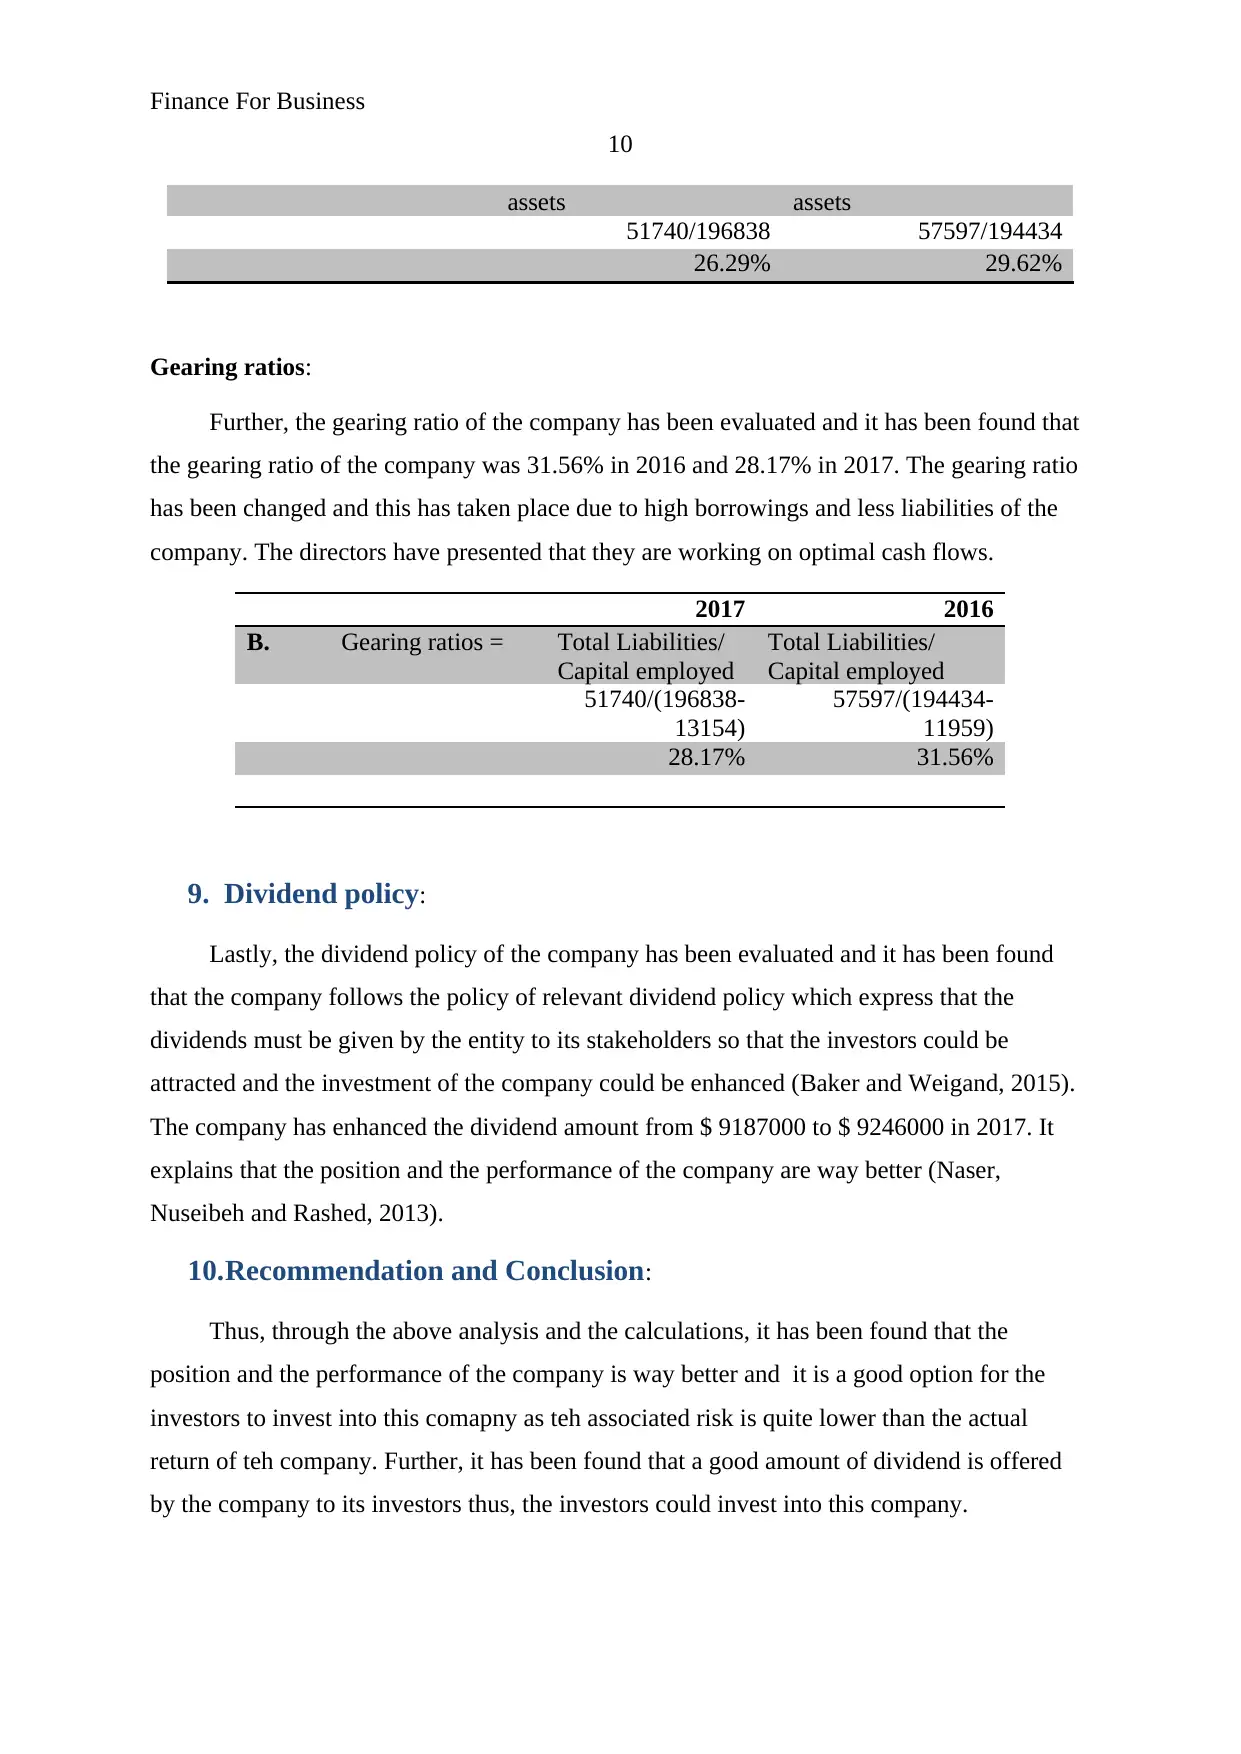
assets assets
51740/196838 57597/194434
26.29% 29.62%
Gearing ratios:
Further, the gearing ratio of the company has been evaluated and it has been found that
the gearing ratio of the company was 31.56% in 2016 and 28.17% in 2017. The gearing ratio
has been changed and this has taken place due to high borrowings and less liabilities of the
company. The directors have presented that they are working on optimal cash flows.
2017 2016
B. Gearing ratios = Total Liabilities/
Capital employed
Total Liabilities/
Capital employed
51740/(196838-
13154)
57597/(194434-
11959)
28.17% 31.56%
9. Dividend policy:
Lastly, the dividend policy of the company has been evaluated and it has been found
that the company follows the policy of relevant dividend policy which express that the
dividends must be given by the entity to its stakeholders so that the investors could be
attracted and the investment of the company could be enhanced (Baker and Weigand, 2015).
The company has enhanced the dividend amount from $ 9187000 to $ 9246000 in 2017. It
explains that the position and the performance of the company are way better (Naser,
Nuseibeh and Rashed, 2013).
10.Recommendation and Conclusion:
Thus, through the above analysis and the calculations, it has been found that the
position and the performance of the company is way better and it is a good option for the
investors to invest into this comapny as teh associated risk is quite lower than the actual
return of teh company. Further, it has been found that a good amount of dividend is offered
by the company to its investors thus, the investors could invest into this company.
10
assets assets
51740/196838 57597/194434
26.29% 29.62%
Gearing ratios:
Further, the gearing ratio of the company has been evaluated and it has been found that
the gearing ratio of the company was 31.56% in 2016 and 28.17% in 2017. The gearing ratio
has been changed and this has taken place due to high borrowings and less liabilities of the
company. The directors have presented that they are working on optimal cash flows.
2017 2016
B. Gearing ratios = Total Liabilities/
Capital employed
Total Liabilities/
Capital employed
51740/(196838-
13154)
57597/(194434-
11959)
28.17% 31.56%
9. Dividend policy:
Lastly, the dividend policy of the company has been evaluated and it has been found
that the company follows the policy of relevant dividend policy which express that the
dividends must be given by the entity to its stakeholders so that the investors could be
attracted and the investment of the company could be enhanced (Baker and Weigand, 2015).
The company has enhanced the dividend amount from $ 9187000 to $ 9246000 in 2017. It
explains that the position and the performance of the company are way better (Naser,
Nuseibeh and Rashed, 2013).
10.Recommendation and Conclusion:
Thus, through the above analysis and the calculations, it has been found that the
position and the performance of the company is way better and it is a good option for the
investors to invest into this comapny as teh associated risk is quite lower than the actual
return of teh company. Further, it has been found that a good amount of dividend is offered
by the company to its investors thus, the investors could invest into this company.
Paraphrase This Document
Need a fresh take? Get an instant paraphrase of this document with our AI Paraphraser
Finance For Business
11
References:
Baker, H.K. and Weigand, R., 2015. Corporate dividend policy revisited. Managerial
Finance, 41(2), pp.126-144.
Barman, G.P., 2008. An evaluation of how dividend policies impact on the share value of
selected companies.
Brealey, R., Myers, S.C. and Marcus, A.J., 2007. FundamentalsofCorporate Finance. Mc
Graw Hill, New York.
Breuer, W., Rieger, M.O. and Soypak, K.C., 2014. The behavioral foundations of corporate
dividend policy a cross-country analysis. Journal of Banking & Finance, 42, pp.247-265.
Naser, K., Nuseibeh, R. and Rashed, W., 2013. Managers' perception of dividend policy:
Evidence from companies listed on Abu Dhabi Securities Exchange. Issues in Business
Management and Economics, 1(1), pp.001-012.
Shao, L., Kwok, C.C. and Guedhami, O., 2013. DIVIDEND POLICY: BALANCING
SHAREHOLDERS'AND CREDITORS'INTERESTS. Journal of Financial Research, 36(1),
pp.43-66.
Travlos, N.G., Trigeorgis, L. and Vafeas, N., 2015. Shareholder wealth effects of dividend
policy changes in an emerging stock market: The case of Cyprus.
Tucker, J.W., 2011. Selection bias and econometric remedies in accounting and finance
research.
Zhang, D., 2012. Managerial dividend-paying incentives. Erasmus University Rotterdam.
Annual report. 2017. Pacific Energy Limited. viewed Jan 22, 2018,
http://www.pacificenergy.com.au/images/files/asx-announcements/2016/2PEAR2016Final.pd
f
Yahoo Finance. 2017. Pacific Energy Limited. viewed Jan 22, 2018,
https://au.finance.yahoo.com/quote/PEA.AX/history?
period1=1451586600&period2=1514745000&interval=1d&filter=history&frequency=1d
Finance For Business
12
Morningstar. 2017. Pacific Energy Limited. viewed Jan 22, 2018,
http://financials.morningstar.com/cash-flow/cf.html?t=PEA®ion=aus&culture=en-US
12
Morningstar. 2017. Pacific Energy Limited. viewed Jan 22, 2018,
http://financials.morningstar.com/cash-flow/cf.html?t=PEA®ion=aus&culture=en-US
⊘ This is a preview!⊘
Do you want full access?
Subscribe today to unlock all pages.
Trusted by 1+ million students worldwide
1 out of 27
Related Documents


Your All-in-One AI-Powered Toolkit for Academic Success.
+13062052269
info@desklib.com
Available 24*7 on WhatsApp / Email
![[object Object]](/_next/static/media/star-bottom.7253800d.svg)
Unlock your academic potential
Copyright © 2020–2026 A2Z Services. All Rights Reserved. Developed and managed by ZUCOL.