Financial Performance Analysis of PAF African Resources PLC (MBA710)
VerifiedAdded on 2022/09/02
|16
|3103
|21
Report
AI Summary
This report provides a comprehensive financial analysis of PAF African Resources PLC, examining its financial performance from an investor's perspective. It begins with an overview of the company's corporate governance status and identifies key challenges. The report then delves into the company's capital investments, detailing major projects like the Elikhulu Project and the Barberton mines sub-vertical shaft project, and their financial implications. It further explores the company's sources of finance, differentiating between debt and equity financing. A crucial part of the report involves a detailed evaluation of various financial ratios, including profitability, liquidity, efficiency, and solvency ratios, to assess the company's financial health. The analysis covers the years 2018 and 2019, highlighting trends and providing insights into the company's performance. Finally, the report assesses the company's share performance in the stock exchange, offering an investor's viewpoint based on the financial data and analysis presented.

Finance and strategic management
Paraphrase This Document
Need a fresh take? Get an instant paraphrase of this document with our AI Paraphraser
FINANCE 1
Contents
Introduction.................................................................................................................................................2
Corporate Governance status and challenges...............................................................................................2
Company capital investments......................................................................................................................4
Company’s Source of Finance.....................................................................................................................5
Financial Ratios...........................................................................................................................................6
Company’s Share Performance.................................................................................................................11
Conclusion.................................................................................................................................................12
References.................................................................................................................................................14
FINANCE 2
Introduction
Financial Analysis is the process of examining the financial statement of the firm. It is
essential for the firms to evaluate the financial performance of the organization to operate the
business. There are various techniques to analyze the financial situation of the company and
these are ratio analysis, horizontal analysis, common-size analysis, stock price analysis, and
many others. These tools and techniques of financial analysis help the company to analyze the
financial situation (Robinson, 2020). The main aim of this paper is to evaluate the financial
situation of the organization by analyze the financial statements. PAF African Resources Plc. has
been taken into consideration to examine the financial situation. PAF Africa Resources Plc is a
gold producer in mid-tier African-focused with the excess capability as it manufacture 170000oz
of gold pa. PAF Africa Resources operates a portfolio of high quality, low cost processes and
projects those are situated in South Africa (PAN African Resources, 2019a).
In the beginning of this report, the challenges will be discussed those are faced by the top
management. After that, capital investments will be identified those are invested by the company
for future operation. Later on, the source of finance of the firm will be examined to get the info
related to financial activities. The ratios will also evaluate to examine its financial status. At the
end, the share performance in the stock exchange will be evaluated as per the investor’s point of
view.
Corporate Governance status and challenges
The Board of directors: The Board of directors is the group that has more responsibilities to
deal and manage the operations. The boards of directors are the key elements of corporate
⊘ This is a preview!⊘
Do you want full access?
Subscribe today to unlock all pages.
Trusted by 1+ million students worldwide
FINANCE 3
governance as they have the responsibilities of the firm to operate smoothly by analyzing the
environmental impact on the business. There are six directors in the firm consisting directors,
chairman, the chief executive offers and the chairman that reduces the conflicts in delegated
authority. It has been seen that the chairman has the responsibility to give guidance of leadership
to board members. The Company financial directors and chief executive officers are supported
by the processes committee. And the non-executive directors have no right to participate in the
daily operation activities.
The composition of Board: PAF Africa Resources Plc has executive and non-executive
directors in the company those are treated equally. The board of directors of the firm has wide
range of information and experience in the field that helps to reduce exploits between members
and protect the rights of shareholders (PAN African Resources, 2019a).
Committees of the board: PAF Africa Resources Plc has 4 committees and these are social
committee, remuneration committee, ethics committee and audit committee. Each of the
committee helps the board of directors on the issues related to non-executive directors, corporate
governance those are independent. It has been seen that all the committee are satisfied and
perform their duties perfectly (PAN African Resources, 2019a).
Independence: The board of directors of PAF Africa Resources Plc has been designed as per the
criteria. The proper evaluation has been done while designing the duties to each board of
directors in terms of principle and character and their relationship. The board of the company
continuously assesses the directors in order to ensure their term that does not go above than 9
years. The firm implements two legislatures and these are the S.A legislature and UK
Paraphrase This Document
Need a fresh take? Get an instant paraphrase of this document with our AI Paraphraser
FINANCE 4
Legislature. The company is highly fulfilled with the independence of its non-executive
directors.
Challenges
Fluctuating economy
It is observed that stock price of the company is declining due to declining of economy.
Nowadays, COVID-19 is the major issue due to which the economy of nation has been affected.
Declining economy affects the business of the firm which directly affects the stock performance
of the company.
Operational Challenges
PAN Africa Resources faces the operational challenges during the underground
production. The production has been affected due to delay in generating high grade platform of
production. Delay in production affects its business.
Company capital investments
PAF Africa Resources Plc invests in three projects with the high amount and these are:
The Elikhulu Project: This is the current project of PAF Africa Resources Plc and it is also one
of the biggest projects of the firm. This project is accomplished by the last quarter of 2018 which
is its fiscal year, with the withdrawal of Gold within the similar period of time. This project
contains tower cranes, carbon tanks and other long-term items, and also other civil engineering
works are the type of expenditures in which the firm has to invest R175, 000,000. In the initial
FINANCE 5
stage, the company invests R174, 000,000,000 in the year 2017 (PAN African Resources,
2019d).
Barberton mines sub-vertical shaft project at Fairview: The Company enhance the
production capacity by mobilizing staff, shifting the working tools to productions site and mining
areas. With the assistance of DRA projects South Africa proprietary limited, the company raises
the construction site with sub vertical shaft of 42 level to 64 level. This project has been studied
by the DRA to ensure the commercial and technical requirement. It has been seen that the capital
expenditure of this project has been increases in 2 years with the amount of R105, 000,000. The
main purpose of this project is to get the return by enhancing the cash inflow with the 7000oz of
gold every year, and it is believed that it is increases to 10000oz per year (PAN African
Resources, 2019d).
The 2010 Pay Channel project: This is also one of the biggest projects of the firm. The 2010
Pay Channel project aim is to improve the production of gold at Evander with the reduced cost.
This project is completed in the first 3 months of the year 2018. The firm invests in this project
to enhance gold production. It is the best strategy to invest in the projects to grow the business at
the higher level (Griffin, & Mahajan, 2019).
Company’s Source of Finance
There are two main sources of funding the operational activities of the company and
these are liabilities and equities. Equity defines the share capital and retaining earning less the
treasury shares. Liabilities defines that the company borrows the amount on debt from the third
party. It has been seen that the company finance the operation activities with both ways such as
debt and equities.
⊘ This is a preview!⊘
Do you want full access?
Subscribe today to unlock all pages.
Trusted by 1+ million students worldwide
FINANCE 6
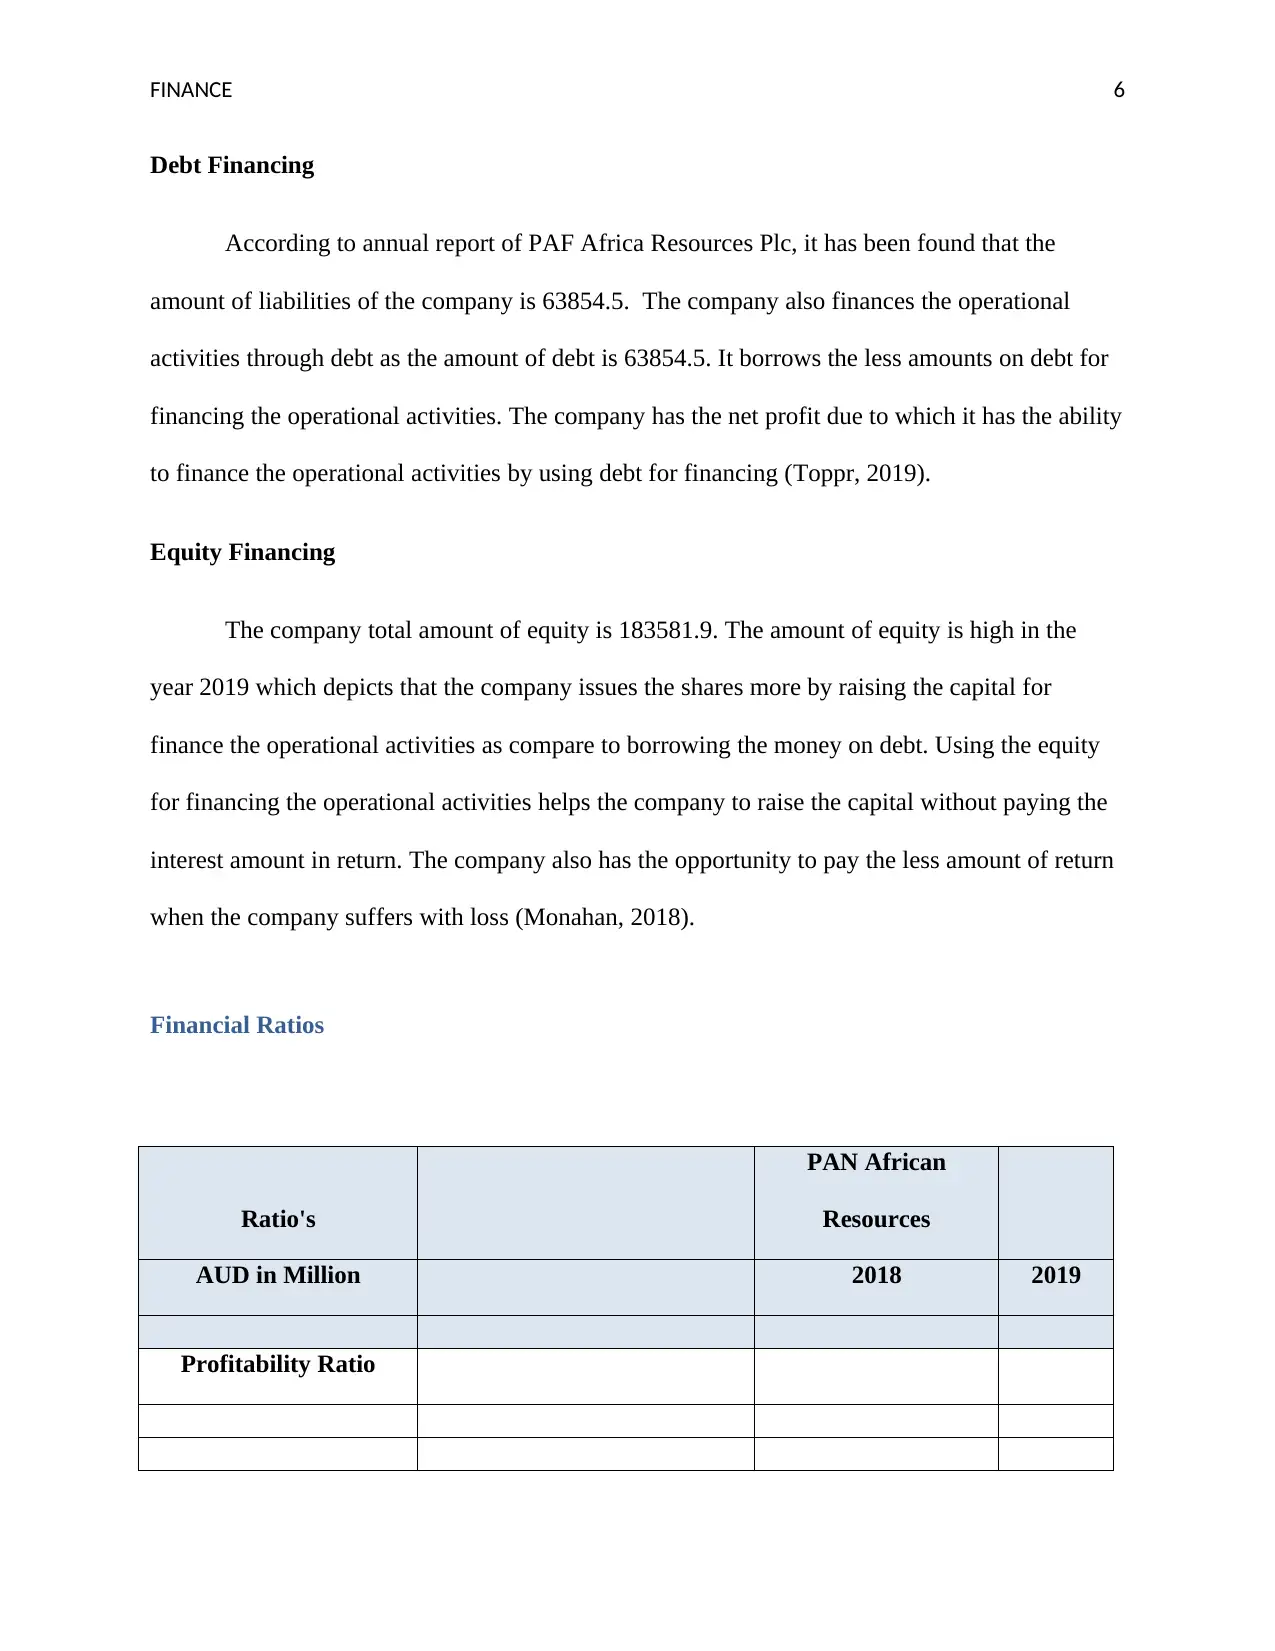
Debt Financing
According to annual report of PAF Africa Resources Plc, it has been found that the
amount of liabilities of the company is 63854.5. The company also finances the operational
activities through debt as the amount of debt is 63854.5. It borrows the less amounts on debt for
financing the operational activities. The company has the net profit due to which it has the ability
to finance the operational activities by using debt for financing (Toppr, 2019).
Equity Financing
The company total amount of equity is 183581.9. The amount of equity is high in the
year 2019 which depicts that the company issues the shares more by raising the capital for
finance the operational activities as compare to borrowing the money on debt. Using the equity
for financing the operational activities helps the company to raise the capital without paying the
interest amount in return. The company also has the opportunity to pay the less amount of return
when the company suffers with loss (Monahan, 2018).
Financial Ratios
Ratio's
PAN African
Resources
AUD in Million 2018 2019
Profitability Ratio
Paraphrase This Document
Need a fresh take? Get an instant paraphrase of this document with our AI Paraphraser
FINANCE 7
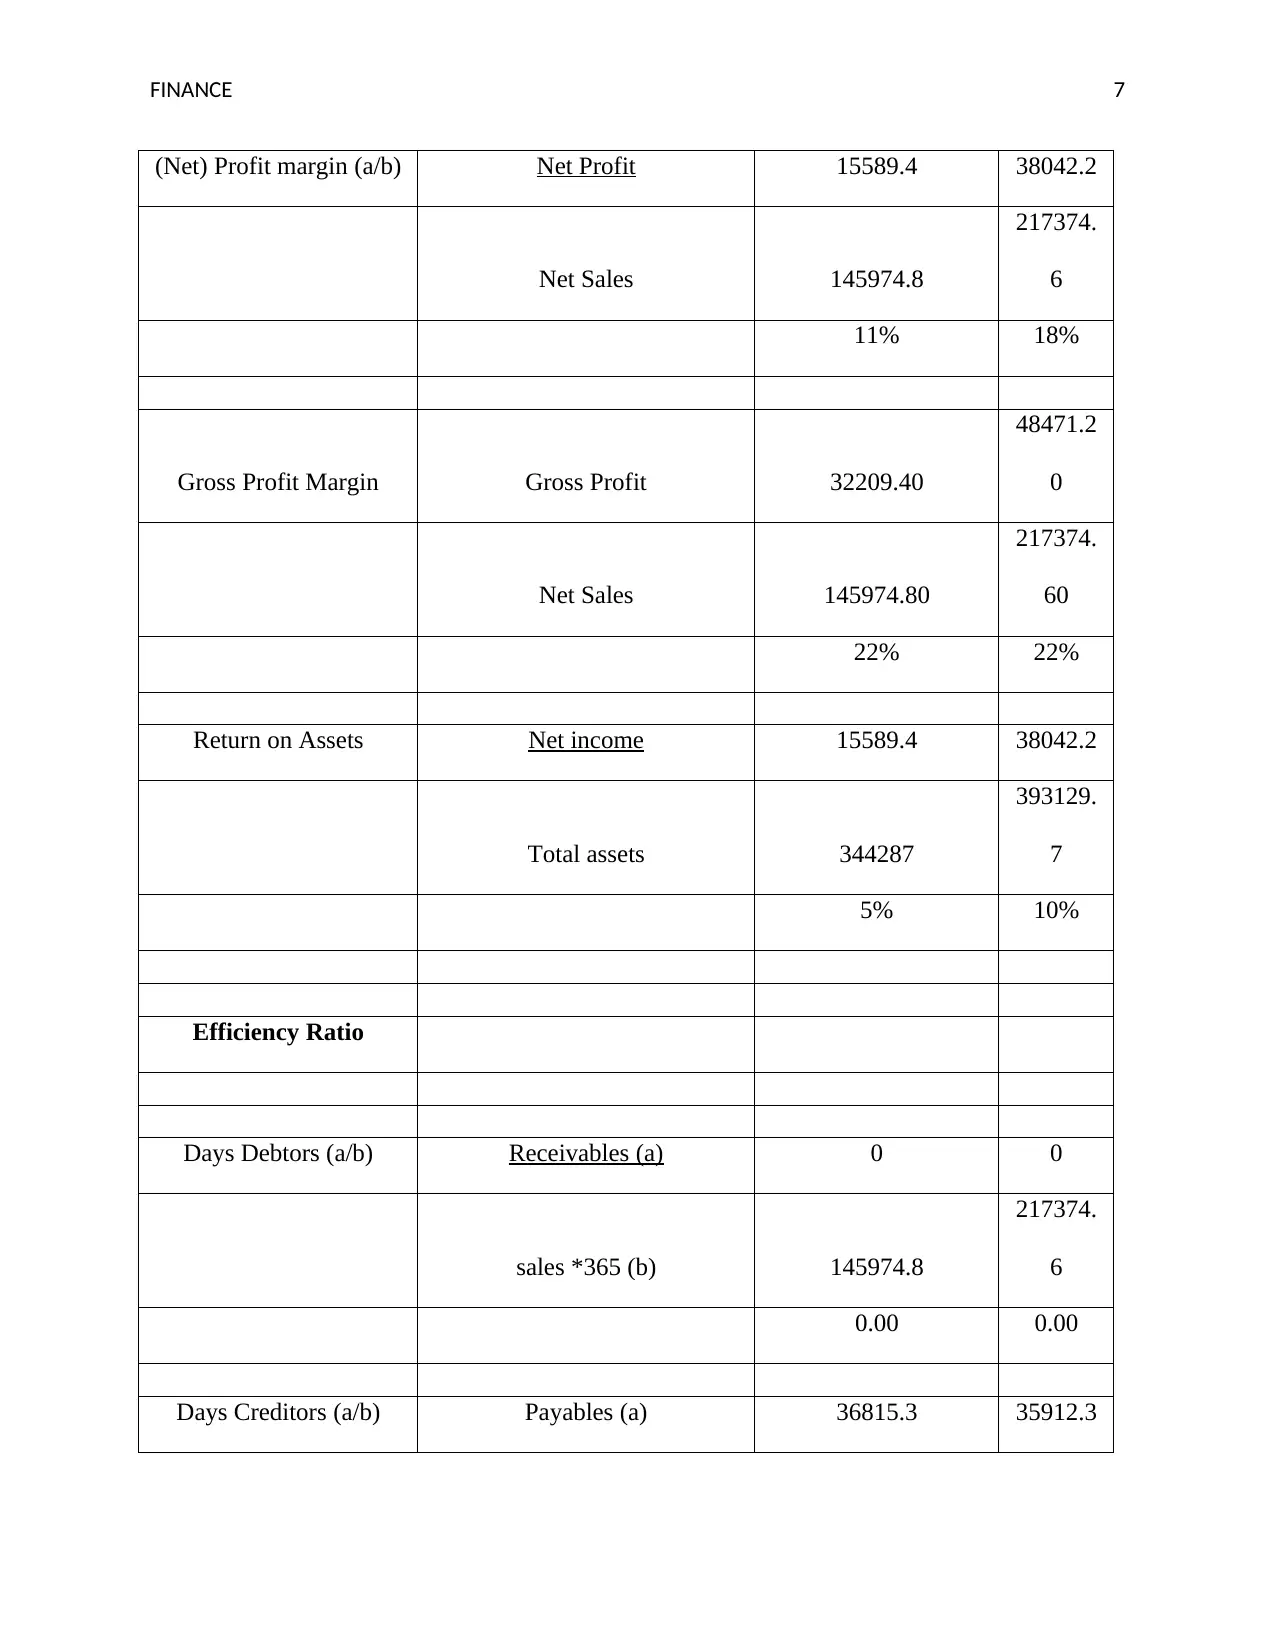
(Net) Profit margin (a/b) Net Profit 15589.4 38042.2
Net Sales 145974.8
217374.
6
11% 18%
Gross Profit Margin Gross Profit 32209.40
48471.2
0
Net Sales 145974.80
217374.
60
22% 22%
Return on Assets Net income 15589.4 38042.2
Total assets 344287
393129.
7
5% 10%
Efficiency Ratio
Days Debtors (a/b) Receivables (a) 0 0
sales *365 (b) 145974.8
217374.
6
0.00 0.00
Days Creditors (a/b) Payables (a) 36815.3 35912.3
FINANCE 8
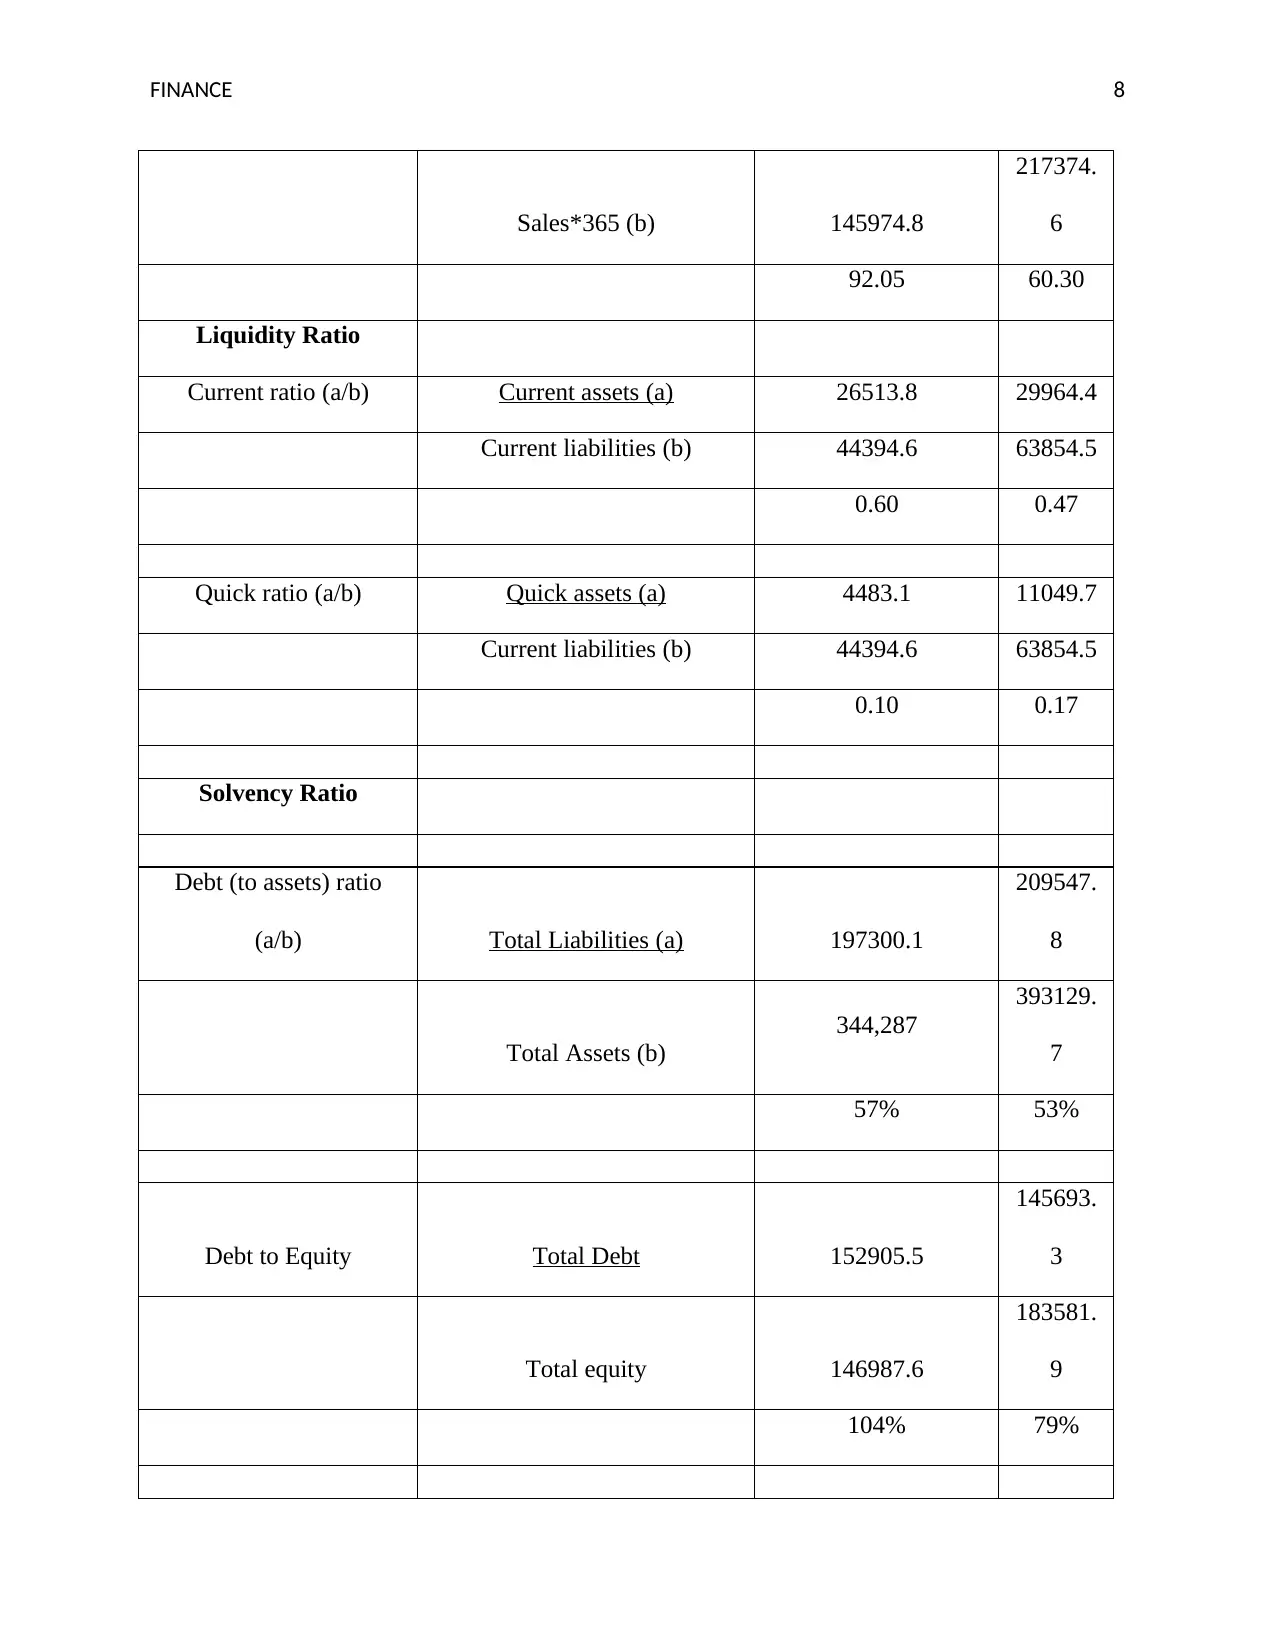
Sales*365 (b) 145974.8
217374.
6
92.05 60.30
Liquidity Ratio
Current ratio (a/b) Current assets (a) 26513.8 29964.4
Current liabilities (b) 44394.6 63854.5
0.60 0.47
Quick ratio (a/b) Quick assets (a) 4483.1 11049.7
Current liabilities (b) 44394.6 63854.5
0.10 0.17
Solvency Ratio
Debt (to assets) ratio
(a/b) Total Liabilities (a) 197300.1
209547.
8
Total Assets (b)
344,287
393129.
7
57% 53%
Debt to Equity Total Debt 152905.5
145693.
3
Total equity 146987.6
183581.
9
104% 79%
⊘ This is a preview!⊘
Do you want full access?
Subscribe today to unlock all pages.
Trusted by 1+ million students worldwide
FINANCE 9
Interest Coverage Ratio EBIT 14985.1 58408.3
Finance costs 4225.3 13041.8
3.55 4.48
Cash Flow Ratio
Operating Cash Flow
Margin
Cash Flow from operating
activities -13395.3 37706.7
Sales 145974.8
217374.
6
-0.09 0.17
Profitability Ratio
As per the above evaluation of financial ratio of the PAF Africa Resources Plc, it is
determined that the company net profit margin has been increases from the previous year such as
it is 11% in the year 2018 and 18% in the year 2019 (PAN African Resources, 2019c). The
increasing net profit margin states that the firm has the ability to create the income by trading the
products and services. The reason of increasing the percentage of net profit margin is it’s
increasing number of net profit with the total of net sales (Tian, & Yu, 2017).
Liquidity Ratio
Current Ratio defines the liquidity position of the organization. According to the current
ratio of PAF Africa Resources Plc, it has been evaluated that the sum of current assets has been
increases with the total of current obligations. But the current liabilities are high as compare to
Paraphrase This Document
Need a fresh take? Get an instant paraphrase of this document with our AI Paraphraser
FINANCE 10
the current assets which depicts that the firm is not able to pay its current obligations. The
current asset of the company is 26513.8 and 29964.4 in 2018 and 2019 respectively and the
amount of current liabilities is 44394.6 and 63854.5 in 2018 and 2019 which describes that the
firm does not have enough amounts of assets to pay the short term obligations. Quick assets are
also not high as compare to current obligations (PAN African Resources, 2019c).
Efficiency Ratio
Debt to equity ratio states the sources of finance of the company from which it finance its
operational activities. As per the debt to equity ratio of the firm, it is observed that the company
uses the debt more in 2018 as compare to equity to raise the capital. But in the year 2019, the
firm raises the capital by issuing the shares with the high amount. It is observed that the firm has
sum of total equity which is high as compare to total debt in the year 2019 such as amount of
debt is 145693.3 and the amount of total equity is 183581.9 which states it issues the shares to
increase the capital for operating the business smoothly (PAN African Resources, 2019c).
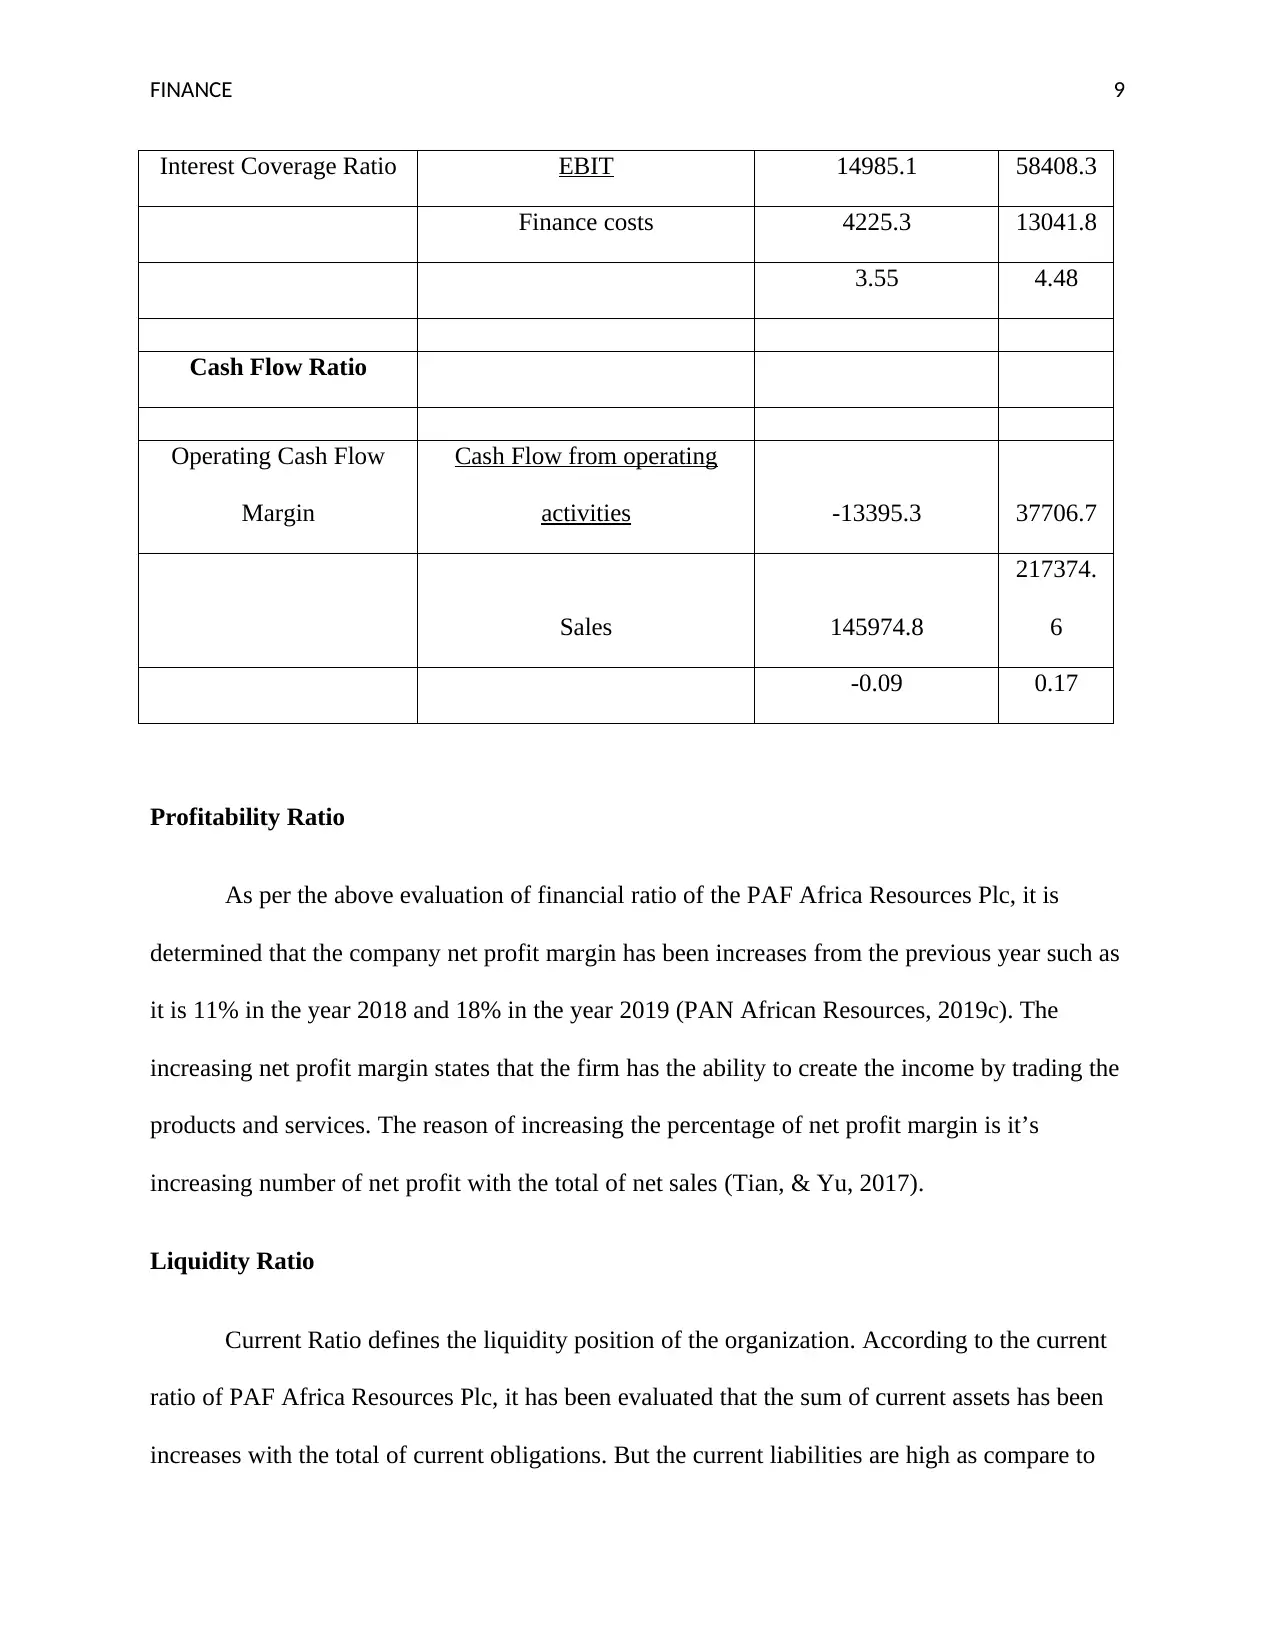
Interest Coverage Ratio of the firm depicts that the firm interest expenses is increases
from the previous year from 4225.3 to 13041.8 from 2018 to 2019 respectively. The interest
coverage ratio has been increases from 3.55 to 4.48 from 2018 and 2019 in a respective manner.
It represents that the firm pays the interest amount has been increases which directly affects its
net profit (PAN African Resources, 2019c).
Efficiency Ratio
Efficiency ratio states the firm’s ability to pay and collect the amount from debtors and
creditors. It has been seen that the company does not have any receivable amount that it has to
collects from debtors because it does not provide the services on credit to its customers. But it
the current assets which depicts that the firm is not able to pay its current obligations. The
current asset of the company is 26513.8 and 29964.4 in 2018 and 2019 respectively and the
amount of current liabilities is 44394.6 and 63854.5 in 2018 and 2019 which describes that the
firm does not have enough amounts of assets to pay the short term obligations. Quick assets are
also not high as compare to current obligations (PAN African Resources, 2019c).
Efficiency Ratio
Debt to equity ratio states the sources of finance of the company from which it finance its
operational activities. As per the debt to equity ratio of the firm, it is observed that the company
uses the debt more in 2018 as compare to equity to raise the capital. But in the year 2019, the
firm raises the capital by issuing the shares with the high amount. It is observed that the firm has
sum of total equity which is high as compare to total debt in the year 2019 such as amount of
debt is 145693.3 and the amount of total equity is 183581.9 which states it issues the shares to
increase the capital for operating the business smoothly (PAN African Resources, 2019c).
Interest Coverage Ratio of the firm depicts that the firm interest expenses is increases
from the previous year from 4225.3 to 13041.8 from 2018 to 2019 respectively. The interest
coverage ratio has been increases from 3.55 to 4.48 from 2018 and 2019 in a respective manner.
It represents that the firm pays the interest amount has been increases which directly affects its
net profit (PAN African Resources, 2019c).
Efficiency Ratio
Efficiency ratio states the firm’s ability to pay and collect the amount from debtors and
creditors. It has been seen that the company does not have any receivable amount that it has to
collects from debtors because it does not provide the services on credit to its customers. But it
FINANCE 11
borrows the money from creditors to finance the activities due to which it has to pay back all the
obligations (Williams, & Dobelman, 2017). It is suggested that the firms has to pay all the
obligations back to creditors and it pays the payable amount to its creditors in 92.05 and 60.30 in
2018 and 2019 respectively. It depicts that the firm pays the expenditure amount in fewer days as
compare to previous years. The decreasing days states that the company improves its efficiency
ratio to pay all the liabilities that helps to develop the strong relation with the shareholders.
Cash Flow Ratio
According to the evaluation of Cash Flow Ratio, it is evaluated that the cash from
operational activities has been increases from the last years. In the last year 2018, the firm suffers
with the operating loss due to large amount of cash outflow instead of cash inflows (Miao, Teoh,
& Zhu, 2016). The cash flow ratio of the company has been increases from negative ratio such as
-0.09 to 0.17 from the year 2018 to 2019 respectively (PAN African Resources, 2019c).
Company’s Share Performance
It has been evaluated that the current share price of PAF Africa Resources Plc is 9.90 in
the end of the March 2020. It has been seen that the share price of the firm has been increases
rapidly from the last year. From the past five years, the share price of the firm has been
fluctuated. The higher price of shares in the mid of 2016 and 2017 with the 24.37 of stock price
but after that the stock price has been decreases. The current stock price of the firm is 9.90 which
is less as compare to the other years. According to stock performance of the company, investors
have to take time to increases the stock price to gets the high return (Ahmed, & Safdar, 2018).
⊘ This is a preview!⊘
Do you want full access?
Subscribe today to unlock all pages.
Trusted by 1+ million students worldwide
1 out of 16
Related Documents


Your All-in-One AI-Powered Toolkit for Academic Success.
+13062052269
info@desklib.com
Available 24*7 on WhatsApp / Email
![[object Object]](/_next/static/media/star-bottom.7253800d.svg)
Unlock your academic potential
Copyright © 2020–2026 A2Z Services. All Rights Reserved. Developed and managed by ZUCOL.