Determinants of Cost of Equity: Evidence from Pakistan Stock Exchange
VerifiedAdded on 2022/10/15
|16
|7786
|18
Report
AI Summary
This research paper examines the determinants of the cost of equity in Pakistan, utilizing a dataset of 263 firms listed on the Pakistan Stock Exchange. The study employs the Capital Asset Pricing Model (CAPM) to calculate the cost of equity, considering the signaling effect of information on market performance. Correlation and regression analyses are conducted to assess the impact of various factors, including net earnings, retention of funds, times interest earned, gearing, fixed asset backing, long-term debt, tax, and market capitalization. The results highlight a significant impact of market capitalization on the cost of equity, while other factors show no significant effect. The study also identifies a sector-specific range for the cost of equity, indicating the volatility of Pakistani financial markets in line with signaling theory. The paper contributes to the existing literature by applying Western-identified determinants in an emerging market context and aligns with the Pecking Order Proposition. It explores the relationship between wealth maximization and the cost of capital, providing valuable insights for corporate finance managers in Pakistan's industrial sectors.
Abasyn Journal of Social Sciences – Volume 9 – Issue 2
527
The Determinants of the Cost of Equity: Evidence from Pakistan
Muhammad Akhtar
Assistant Professor, Riphah International University, Islamabad.
Dr. Ahmad Raza Bilal
Assistant Professor, Superior University Lahore, Pakistan
Dr. Muhammad Naveed
Assistant Professor, Riphah International University, Islamabad.
Abstract
This research investigates the determinants of cost of equity using a data set of
263 firms listed on Pakistan stock exchange. Keeping in view the signaling effect
of information on the performance of capital markets in Pakistan, we used
Capital Asset Pricing Model (CAPM) to calculate the cost of equity. Correlation
and regression analysis were run to test the main effect of net earnings,
retention of fund, time interest earned, gearing, fixed asset backing, long term
debt, tax, market capitalization on cost of equity. The results’ robustness is
evidenced that market capitalization has significant impact on cost of equity. We
also show that net earnings growth, retention of funds, times interest earned,
gearing, fixed asset backing, long term debt and tax have no impact on cost of
equity. Finally, we find a sector-specific range of cost of equity that falls
between 11.54 to 16.78 percent. This indicates that financial markets in
Pakistan are more volatile with respect to any information in line with the
signaling theory.
Keywords: Determinants of Cost of Equity, Capital Asset Pricing Model,
Pakistan
The purpose of this study is to bridge the gap between theory and
practice by analyzing the determinants of cost of equity. Although many
studies have been undertaken on the determinants of capital structure,
however insufficient attention has been paid to the determinants of cost
of equity in emerging market. The cost of capital is an important issue in
corporate finance, still very less is known about it in emerging markets
(Barry, Peavy & Rodriguez, 1998). Majority of the studies on cost of
equity suggest different determinants for cost of equity: Informational
quality (Lambert, Leuz & Verrecchia, 2007), earning restatement (Hribar
& Jenkins, 2004), disclosure level (Espinosa & Trombetta, 2007),
Information Asymmetry (Lambert, Leuz & Verrecchia, 2012),
Ownership (Core, Hail & Verdi, 2015), Voluntary disclosure (Clinch &
Verrecchia, 2015), informed trading (Brennan, Huh & Subrahmanyam,
2015) and corporate social responsibility (Xu, Liu & Huang, 2015). All
of these studies deal with developing economies and emerging
economies but none of these studies has shaded lights in Pakistan
perspective. A vast number of literatures suggest that due macro
economic factors the determinants of cost of equity may vary from
Paraphrase This Document
Need a fresh take? Get an instant paraphrase of this document with our AI Paraphraser
Abasyn Journal of Social Sciences – Volume 9 – Issue 2
528
country to country and culture to culture. Therefore the current study is
an attempt to fill this gap aligned with the Pecking order Proposition.
Out of many objectives of corporate finance managers one is the
maximization of the shareholders’ wealth. The conventional measure of
maximize of the shareholders wealth by increasing net income of the
business is not a viable approach. The study of suggests that there is
linear association between wealth maximization and cost of capital
(Bhatnagar, Kumari & Sharma, 2015). However, the said objective could
be achieved by lowering the cost of capital. We conducted this study in
different industrial sectors of Pakistan, Thus Pakistani industry provided
a natural laboratory for verifying the impact of different variables
identified as determinants of firms’ cost of equity. Several studies
suggest several determinants of cost equity. In particular we examine
how net earnings growth, retention of funds, times interest earned,
gearing, fixed asset backing, long term debt, tax, and market
capitalization may be helpful in determining the cost of equity.
Earning is a determinant of cost of equity (Fama & French,
1998). Growth in earnings stimulates the expectations of the shareholders
which increase cost of equity
(Bilal, Khan and Akoorie, 2016). Times interest earned is another
determinant of equity. Greater interest coverage ratio reduces financial
risk and cost of equity as well (Horne & Wachowicz, 1998). Debt
financing will increase the financial risk and ultimately increases the
expected return of the equity holder (Change & Rhee, 1990). Short term
financing is on higher side as compared to long term financing in
emerging markets (Booth, Aivazian, Demirguc-Kunt & Maksmivoc,
2001). The investor requires compensation for risk and if risk
diversification is not possible the cost of equity will increase (Clarkson,
Guedes & Thompson, 1996). The study contributes to literature by
examining the determinants identified in the west and applying them in
the developing market like Pakistan.
Related Literature and Hypothesis
The cost of capital is a blend of equity, preferred stock and debt
which constitutes capital structure. Cost of capital has been productive
and significant area of investigation in the field of finance (Da, Guo &
Jagannathan, 2009). Two basic components which constitute cost of
equity are dividend yield and capital gains; dividend yield may be
regarded more determinable than capital gains (Pointon & Omran, 2004).
Pecking order theory reveals that initially firm uses internally generated
funds if not possible then, debt is used which leads to high leverage
(Drobetz & Fix, 2003). Capital structure cause major impact on cost of
equity cost (Modigliani & Miller, 1958). Static Trade off Theory
emphasis that, firm sets specific targets for debt to value the firm
(Mayers & Majluf, 1984). Signaling Theory by Ross (1977) shows that
debt gives signals in the market about positive inflows.
Abasyn Journal of Social Sciences – Volume 9 – Issue 2
529
Net Earnings’ Growth and Cost of Equity
Net earnings’ growth and cost of equity have strong correlation.
According to Bazley and Hancock (2004), Equity investor’s assume all
risks and is ultimately entitled for the rewards. In the same vein, growth
in earnings will lead to high cost of equity (Fama & French, 1998).
Earnings’ has vital importance for the shareholders (Gibson, 1998).
Public disclosure regarding earnings has association with the cost of the
capital (botosan, plumlee & Xie, 2004). Country level disclosure has an
impact on realized returns and cost of capital (Core, Hail & Verdi, 2015).
It is further argued that increase in profits will increase the market price
of the shares which will result in capital gain and hence will increase the
cost of equity (Gibson, 1998). Companies with high growth opportunities
have generally high price earnings ratio and companies with low growth
opportunities have low price earnings ratio (Gibson, 1998). Based on the
argument our first hypothesis can be stated as follows:
H 1: Net earnings’ growth and cost of equity are positively correlated.
Retention of Funds and Cost of Equity
The debate about the preferred mode of financing needs a special
consideration with respect to Pakistan. The overall trend in the selection
of modes of financing moves in the following way that retained earnings
is preferred source of financing over the equity. If debt financing and
equity financing are compared debt finance is also preferred over the
equity. The better disclosure information to the users of financial
statements has association with stock prices which effects cost of capital
(Gelb & Zarowin, 2002). The specific reason is being aligned with the
pecking order proposition that the equity cost will be reduced as internal
funds should avoid issue costs (Krishnan & Mayer, 1996; Mayers, 1984).
Therefore the study hypothesizes that:
H 2: Retention of funds has negative impact on cost of equity.
Times Interest Earned and Cost of Equity
The ability of the firm to carry debt can be viewed by
considering the interest earned and fixed charges coverage (Gibson,
1998). Gibson further argues that if the time interest earned is
inadequate, firms will not be able to meet their interest obligations.
Failure to meet interest obligation can results in legal action and
bankruptcy (Brigham & Ehrhardt, 2002). Greater interest coverage
reduces financial risk. Investors demand high return for the high risk.
Therefore growth in earnings leads to greater interest coverage ratio
which lowers the risk and ultimately negatively impact cost of equity.
The higher ratio shows, that company can cover its interest payments and
the capacity to take new debts (Horne & Wachowicz, 1998). Based on
this view, the study hypothesizes that:
H 3: Times interest earned has negatively impact on cost of equity.
⊘ This is a preview!⊘
Do you want full access?
Subscribe today to unlock all pages.
Trusted by 1+ million students worldwide
Abasyn Journal of Social Sciences – Volume 9 – Issue 2
530
Gearing and Cost of Equity
The use of fixed operating costs by the firm is called financial
leverage or gearing (Horne & Wachowicz, 1998). Gearing presents the
ratio of total liabilities to equity also known as capital structure ratio. The
capital structure depicts the long term solvency of the firms (Khan &
Jain, 1993). There is a strong link between gearing and cost of equity
(Change & Rhee, 1990). High dividend payout ratio leads towards
higher debt financing (Change & Rhee, 1990). Debt financing will
increase the financial risk and will increase the expected return of the
equity holder. They will demand higher return for assuming high risk and
therefore cost of equity will increase. In developing countries use of
short term financing is on higher side than the long term financing
(Booth, Aivazian, Demirguc-Kunt & Maksmivoc, 2001). This leads us to
formulate the hypothesis that:
H 4: Gearing has positive impact on cost of equity.
Fixed Assets Backing and Cost of Equity
Fixed Assets backing allows the firms to raise debts at cheaper
rates (Rafiq, Iqbal, & Atiq, 2008). They further argued that companies
can pledge their assets which are fully depreciated but still have market
value. Total assets have a negative relation to the cost of equity. The
cost of equity will reduce due to increase in fixed assets. As asset
backing may make the business more secure and hence reduce the cost of
capital. In the same vein, investor requires compensation for the higher
risk if the risk cannot be diversified away due to which cost of equity
will increase (Clarkson, Guedes & Thompson, 1996). Fixed asset
backing makes the business less risky and hence the expected rate of
return of shareholder decreases. The higher ratio of tangible assets allows
the companies to borrow more at relatively cheaper rates (Rafiq, Iqbal, &
Atiq, 2008). Firm with large amount of fixed assets can borrow at lower
rates as compare to others because of fixed assets backing (Shah &
Hijazi, 2004). They further documents that fixed asset backing make
business secure and hence reduce the cost of equity. Therefore the
hypothesize that:
H 5: Fixed asset backing has negative impact on cost of equity.
Long Term Debt and Cost of Equity
The use of long term debt significantly impact earnings (Gibson,
1998). Gibson further argues that financial leverage is successful if firms
earn more than it pays on borrowed funds. When the capital structure of
any firm is low geared the preference shareholders and debenture holders
enjoy greater degree of security (Nizam, 1999). He further documents
that burden of interest payable impacts on equity earnings. Even there is
positive effect of disclosure policy on cost of debt (Nikolaev & Vanlent,
Paraphrase This Document
Need a fresh take? Get an instant paraphrase of this document with our AI Paraphraser
Abasyn Journal of Social Sciences – Volume 9 – Issue 2
531
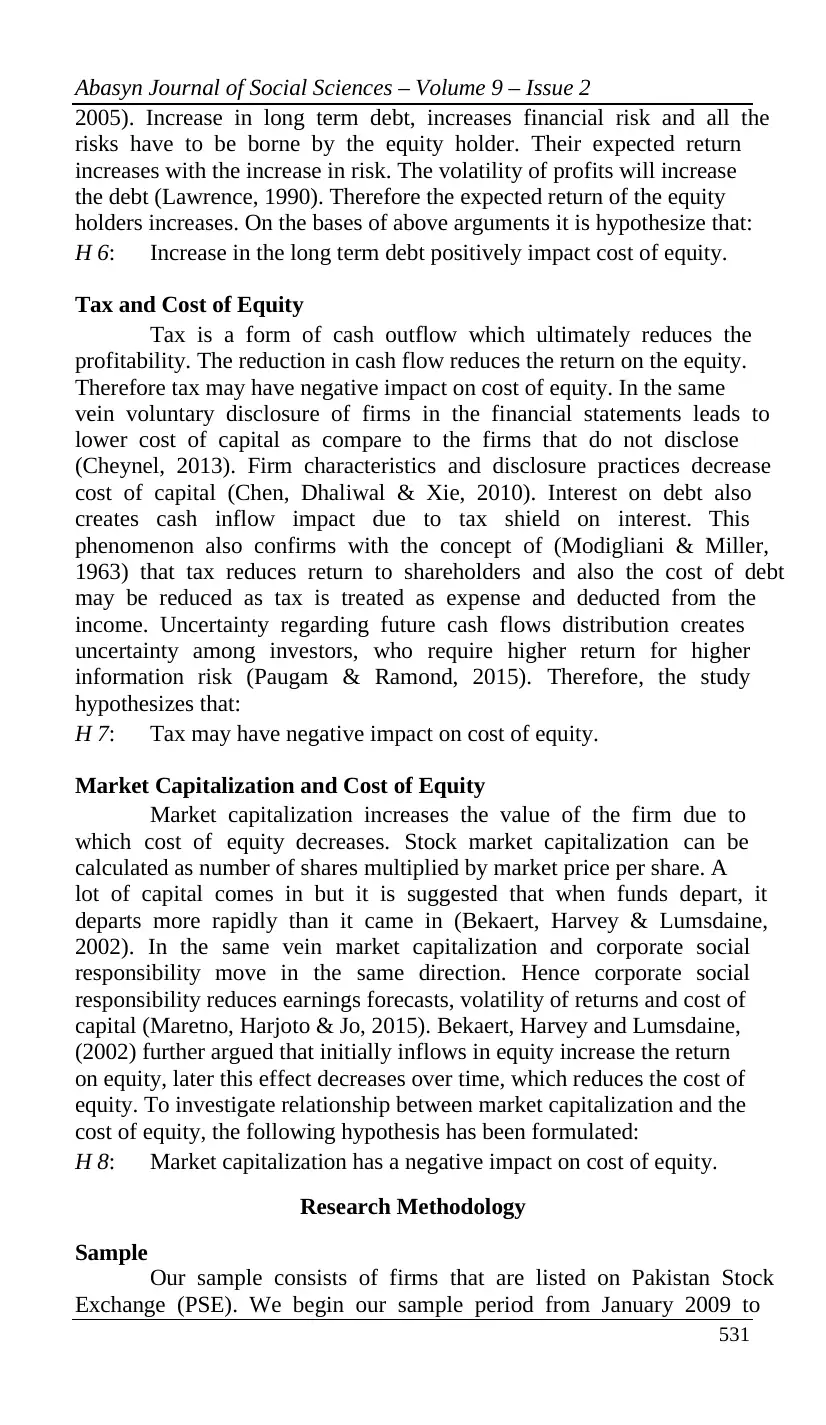
2005). Increase in long term debt, increases financial risk and all the
risks have to be borne by the equity holder. Their expected return
increases with the increase in risk. The volatility of profits will increase
the debt (Lawrence, 1990). Therefore the expected return of the equity
holders increases. On the bases of above arguments it is hypothesize that:
H 6: Increase in the long term debt positively impact cost of equity.
Tax and Cost of Equity
Tax is a form of cash outflow which ultimately reduces the
profitability. The reduction in cash flow reduces the return on the equity.
Therefore tax may have negative impact on cost of equity. In the same
vein voluntary disclosure of firms in the financial statements leads to
lower cost of capital as compare to the firms that do not disclose
(Cheynel, 2013). Firm characteristics and disclosure practices decrease
cost of capital (Chen, Dhaliwal & Xie, 2010). Interest on debt also
creates cash inflow impact due to tax shield on interest. This
phenomenon also confirms with the concept of (Modigliani & Miller,
1963) that tax reduces return to shareholders and also the cost of debt
may be reduced as tax is treated as expense and deducted from the
income. Uncertainty regarding future cash flows distribution creates
uncertainty among investors, who require higher return for higher
information risk (Paugam & Ramond, 2015). Therefore, the study
hypothesizes that:
H 7: Tax may have negative impact on cost of equity.
Market Capitalization and Cost of Equity
Market capitalization increases the value of the firm due to
which cost of equity decreases. Stock market capitalization can be
calculated as number of shares multiplied by market price per share. A
lot of capital comes in but it is suggested that when funds depart, it
departs more rapidly than it came in (Bekaert, Harvey & Lumsdaine,
2002). In the same vein market capitalization and corporate social
responsibility move in the same direction. Hence corporate social
responsibility reduces earnings forecasts, volatility of returns and cost of
capital (Maretno, Harjoto & Jo, 2015). Bekaert, Harvey and Lumsdaine,
(2002) further argued that initially inflows in equity increase the return
on equity, later this effect decreases over time, which reduces the cost of
equity. To investigate relationship between market capitalization and the
cost of equity, the following hypothesis has been formulated:
H 8: Market capitalization has a negative impact on cost of equity.
Research Methodology
Sample
Our sample consists of firms that are listed on Pakistan Stock
Exchange (PSE). We begin our sample period from January 2009 to
531
2005). Increase in long term debt, increases financial risk and all the
risks have to be borne by the equity holder. Their expected return
increases with the increase in risk. The volatility of profits will increase
the debt (Lawrence, 1990). Therefore the expected return of the equity
holders increases. On the bases of above arguments it is hypothesize that:
H 6: Increase in the long term debt positively impact cost of equity.
Tax and Cost of Equity
Tax is a form of cash outflow which ultimately reduces the
profitability. The reduction in cash flow reduces the return on the equity.
Therefore tax may have negative impact on cost of equity. In the same
vein voluntary disclosure of firms in the financial statements leads to
lower cost of capital as compare to the firms that do not disclose
(Cheynel, 2013). Firm characteristics and disclosure practices decrease
cost of capital (Chen, Dhaliwal & Xie, 2010). Interest on debt also
creates cash inflow impact due to tax shield on interest. This
phenomenon also confirms with the concept of (Modigliani & Miller,
1963) that tax reduces return to shareholders and also the cost of debt
may be reduced as tax is treated as expense and deducted from the
income. Uncertainty regarding future cash flows distribution creates
uncertainty among investors, who require higher return for higher
information risk (Paugam & Ramond, 2015). Therefore, the study
hypothesizes that:
H 7: Tax may have negative impact on cost of equity.
Market Capitalization and Cost of Equity
Market capitalization increases the value of the firm due to
which cost of equity decreases. Stock market capitalization can be
calculated as number of shares multiplied by market price per share. A
lot of capital comes in but it is suggested that when funds depart, it
departs more rapidly than it came in (Bekaert, Harvey & Lumsdaine,
2002). In the same vein market capitalization and corporate social
responsibility move in the same direction. Hence corporate social
responsibility reduces earnings forecasts, volatility of returns and cost of
capital (Maretno, Harjoto & Jo, 2015). Bekaert, Harvey and Lumsdaine,
(2002) further argued that initially inflows in equity increase the return
on equity, later this effect decreases over time, which reduces the cost of
equity. To investigate relationship between market capitalization and the
cost of equity, the following hypothesis has been formulated:
H 8: Market capitalization has a negative impact on cost of equity.
Research Methodology
Sample
Our sample consists of firms that are listed on Pakistan Stock
Exchange (PSE). We begin our sample period from January 2009 to
Abasyn Journal of Social Sciences – Volume 9 – Issue 2
532
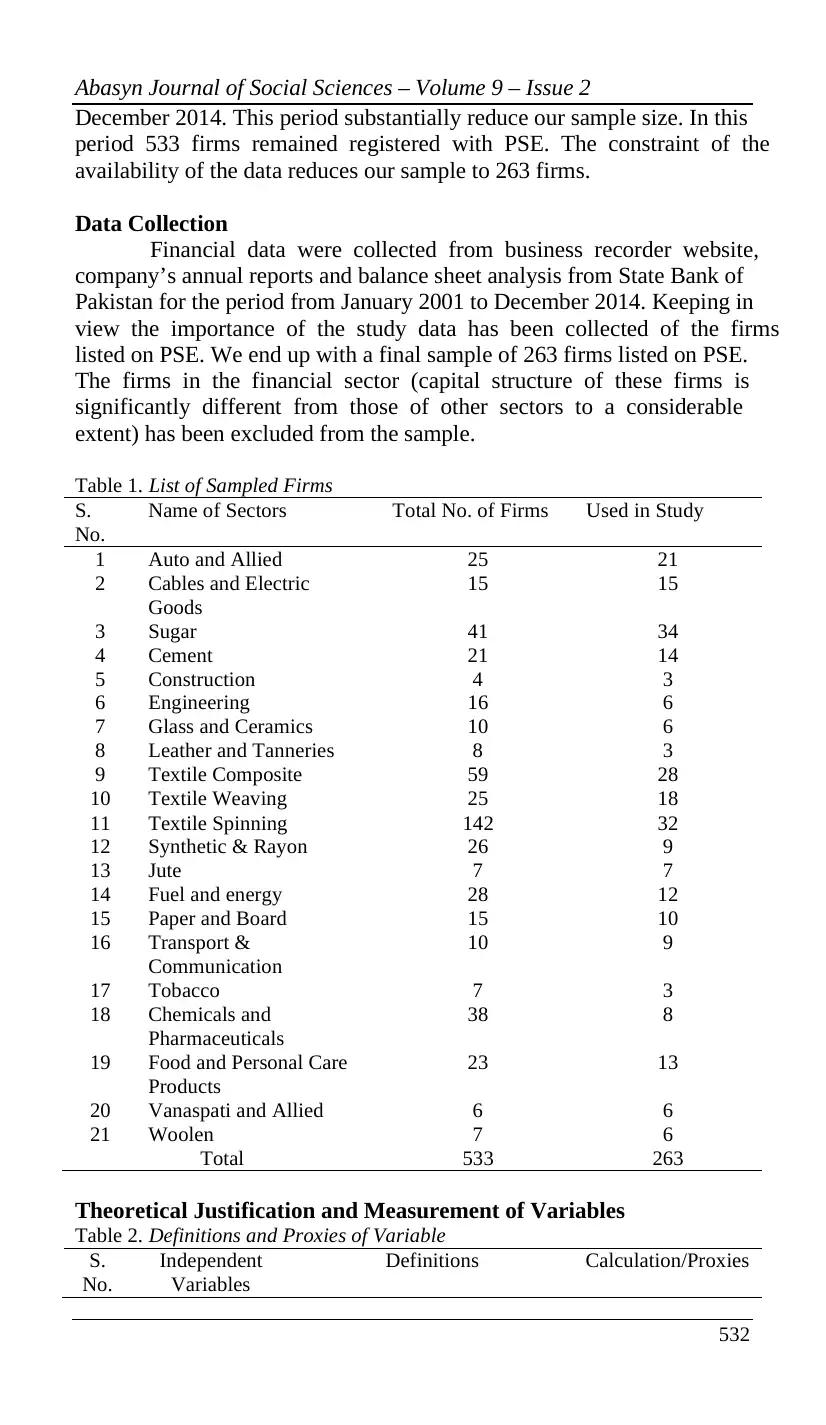
December 2014. This period substantially reduce our sample size. In this
period 533 firms remained registered with PSE. The constraint of the
availability of the data reduces our sample to 263 firms.
Data Collection
Financial data were collected from business recorder website,
company’s annual reports and balance sheet analysis from State Bank of
Pakistan for the period from January 2001 to December 2014. Keeping in
view the importance of the study data has been collected of the firms
listed on PSE. We end up with a final sample of 263 firms listed on PSE.
The firms in the financial sector (capital structure of these firms is
significantly different from those of other sectors to a considerable
extent) has been excluded from the sample.
Table 1. List of Sampled Firms
S.
No.
Name of Sectors Total No. of Firms Used in Study
1 Auto and Allied 25 21
2 Cables and Electric
Goods
15 15
3 Sugar 41 34
4 Cement 21 14
5 Construction 4 3
6 Engineering 16 6
7 Glass and Ceramics 10 6
8 Leather and Tanneries 8 3
9 Textile Composite 59 28
10 Textile Weaving 25 18
11 Textile Spinning 142 32
12 Synthetic & Rayon 26 9
13 Jute 7 7
14 Fuel and energy 28 12
15 Paper and Board 15 10
16 Transport &
Communication
10 9
17 Tobacco 7 3
18 Chemicals and
Pharmaceuticals
38 8
19 Food and Personal Care
Products
23 13
20 Vanaspati and Allied 6 6
21 Woolen 7 6
Total 533 263
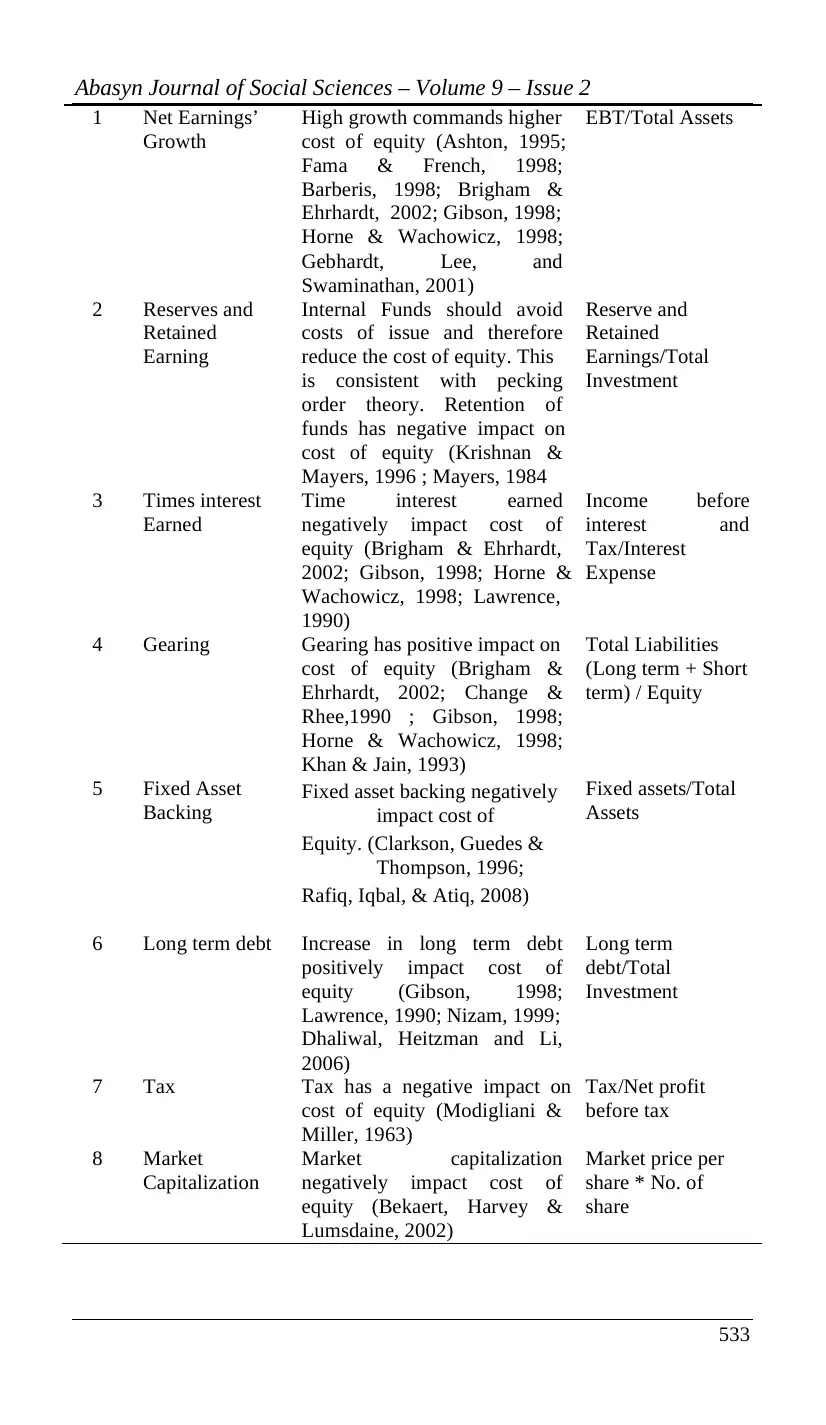
Theoretical Justification and Measurement of Variables
Table 2. Definitions and Proxies of Variable
S.
No.
Independent
Variables
Definitions Calculation/Proxies
532
December 2014. This period substantially reduce our sample size. In this
period 533 firms remained registered with PSE. The constraint of the
availability of the data reduces our sample to 263 firms.
Data Collection
Financial data were collected from business recorder website,
company’s annual reports and balance sheet analysis from State Bank of
Pakistan for the period from January 2001 to December 2014. Keeping in
view the importance of the study data has been collected of the firms
listed on PSE. We end up with a final sample of 263 firms listed on PSE.
The firms in the financial sector (capital structure of these firms is
significantly different from those of other sectors to a considerable
extent) has been excluded from the sample.
Table 1. List of Sampled Firms
S.
No.
Name of Sectors Total No. of Firms Used in Study
1 Auto and Allied 25 21
2 Cables and Electric
Goods
15 15
3 Sugar 41 34
4 Cement 21 14
5 Construction 4 3
6 Engineering 16 6
7 Glass and Ceramics 10 6
8 Leather and Tanneries 8 3
9 Textile Composite 59 28
10 Textile Weaving 25 18
11 Textile Spinning 142 32
12 Synthetic & Rayon 26 9
13 Jute 7 7
14 Fuel and energy 28 12
15 Paper and Board 15 10
16 Transport &
Communication
10 9
17 Tobacco 7 3
18 Chemicals and
Pharmaceuticals
38 8
19 Food and Personal Care
Products
23 13
20 Vanaspati and Allied 6 6
21 Woolen 7 6
Total 533 263
Theoretical Justification and Measurement of Variables
Table 2. Definitions and Proxies of Variable
S.
No.
Independent
Variables
Definitions Calculation/Proxies
⊘ This is a preview!⊘
Do you want full access?
Subscribe today to unlock all pages.
Trusted by 1+ million students worldwide
Abasyn Journal of Social Sciences – Volume 9 – Issue 2
533
1 Net Earnings’
Growth
High growth commands higher
cost of equity (Ashton, 1995;
Fama & French, 1998;
Barberis, 1998; Brigham &
Ehrhardt, 2002; Gibson, 1998;
Horne & Wachowicz, 1998;
Gebhardt, Lee, and
Swaminathan, 2001)
EBT/Total Assets
2 Reserves and
Retained
Earning
Internal Funds should avoid
costs of issue and therefore
reduce the cost of equity. This
is consistent with pecking
order theory. Retention of
funds has negative impact on
cost of equity (Krishnan &
Mayers, 1996 ; Mayers, 1984
Reserve and
Retained
Earnings/Total
Investment
3 Times interest
Earned
Time interest earned
negatively impact cost of
equity (Brigham & Ehrhardt,
2002; Gibson, 1998; Horne &
Wachowicz, 1998; Lawrence,
1990)
Income before
interest and
Tax/Interest
Expense
4 Gearing Gearing has positive impact on
cost of equity (Brigham &
Ehrhardt, 2002; Change &
Rhee,1990 ; Gibson, 1998;
Horne & Wachowicz, 1998;
Khan & Jain, 1993)
Total Liabilities
(Long term + Short
term) / Equity
5 Fixed Asset
Backing Fixed asset backing negatively
impact cost of
Equity. (Clarkson, Guedes &
Thompson, 1996;
Rafiq, Iqbal, & Atiq, 2008)
Fixed assets/Total
Assets
6 Long term debt Increase in long term debt
positively impact cost of
equity (Gibson, 1998;
Lawrence, 1990; Nizam, 1999;
Dhaliwal, Heitzman and Li,
2006)
Long term
debt/Total
Investment
7 Tax Tax has a negative impact on
cost of equity (Modigliani &
Miller, 1963)
Tax/Net profit
before tax
8 Market
Capitalization
Market capitalization
negatively impact cost of
equity (Bekaert, Harvey &
Lumsdaine, 2002)
Market price per
share * No. of
share
Paraphrase This Document
Need a fresh take? Get an instant paraphrase of this document with our AI Paraphraser
Abasyn Journal of Social Sciences – Volume 9 – Issue 2
534
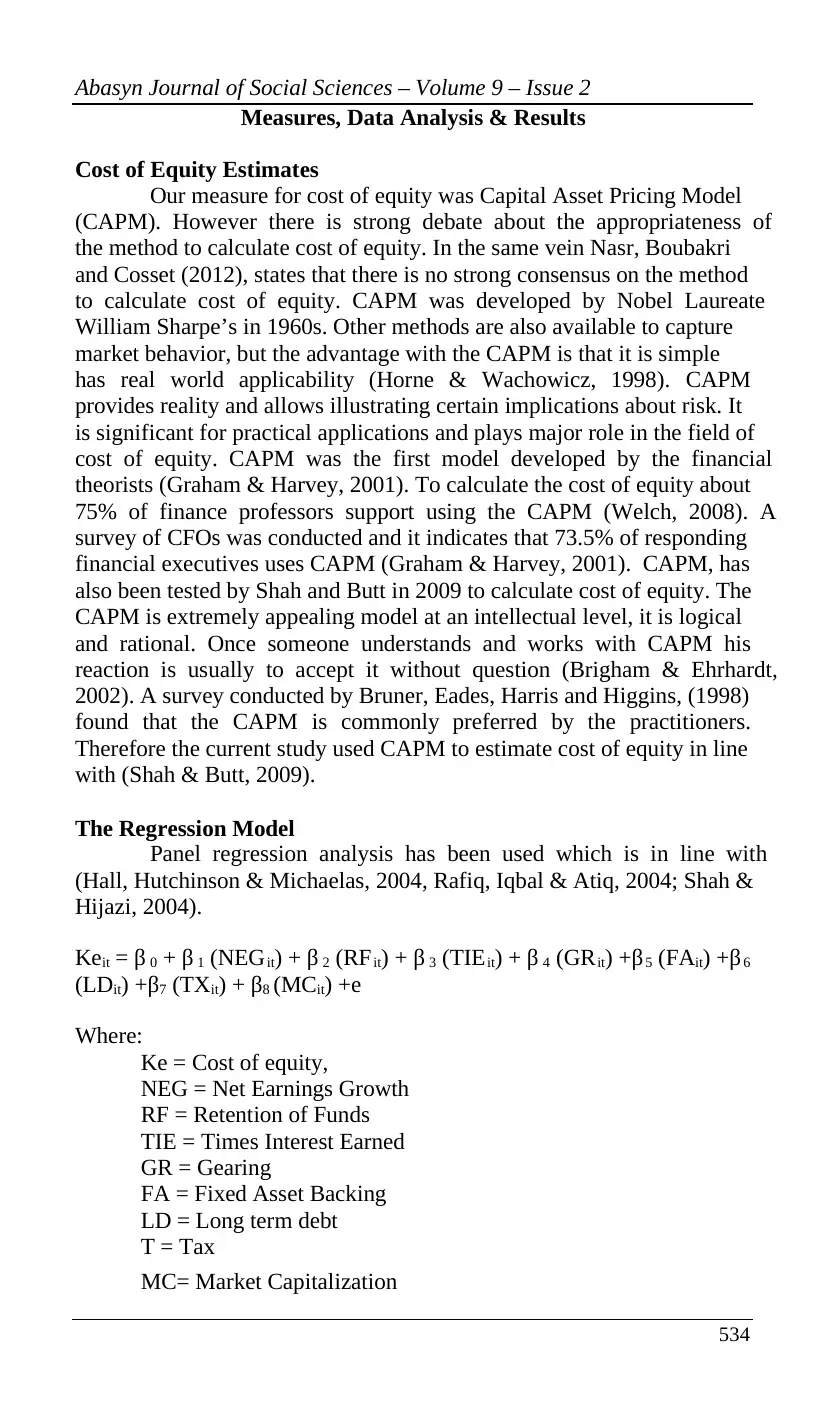
Measures, Data Analysis & Results
Cost of Equity Estimates
Our measure for cost of equity was Capital Asset Pricing Model
(CAPM). However there is strong debate about the appropriateness of
the method to calculate cost of equity. In the same vein Nasr, Boubakri
and Cosset (2012), states that there is no strong consensus on the method
to calculate cost of equity. CAPM was developed by Nobel Laureate
William Sharpe’s in 1960s. Other methods are also available to capture
market behavior, but the advantage with the CAPM is that it is simple
has real world applicability (Horne & Wachowicz, 1998). CAPM
provides reality and allows illustrating certain implications about risk. It
is significant for practical applications and plays major role in the field of
cost of equity. CAPM was the first model developed by the financial
theorists (Graham & Harvey, 2001). To calculate the cost of equity about
75% of finance professors support using the CAPM (Welch, 2008). A
survey of CFOs was conducted and it indicates that 73.5% of responding
financial executives uses CAPM (Graham & Harvey, 2001). CAPM, has
also been tested by Shah and Butt in 2009 to calculate cost of equity. The
CAPM is extremely appealing model at an intellectual level, it is logical
and rational. Once someone understands and works with CAPM his
reaction is usually to accept it without question (Brigham & Ehrhardt,
2002). A survey conducted by Bruner, Eades, Harris and Higgins, (1998)
found that the CAPM is commonly preferred by the practitioners.
Therefore the current study used CAPM to estimate cost of equity in line
with (Shah & Butt, 2009).
The Regression Model
Panel regression analysis has been used which is in line with
(Hall, Hutchinson & Michaelas, 2004, Rafiq, Iqbal & Atiq, 2004; Shah &
Hijazi, 2004).
Keit = β 0 + β 1 (NEGit) + β 2 (RFit) + β 3 (TIEit) + β 4 (GRit) +β5 (FAit) +β6
(LDit) +β7 (TXit) + β8 (MCit) +e
Where:
Ke = Cost of equity,
NEG = Net Earnings Growth
RF = Retention of Funds
TIE = Times Interest Earned
GR = Gearing
FA = Fixed Asset Backing
LD = Long term debt
T = Tax
MC= Market Capitalization
534
Measures, Data Analysis & Results
Cost of Equity Estimates
Our measure for cost of equity was Capital Asset Pricing Model
(CAPM). However there is strong debate about the appropriateness of
the method to calculate cost of equity. In the same vein Nasr, Boubakri
and Cosset (2012), states that there is no strong consensus on the method
to calculate cost of equity. CAPM was developed by Nobel Laureate
William Sharpe’s in 1960s. Other methods are also available to capture
market behavior, but the advantage with the CAPM is that it is simple
has real world applicability (Horne & Wachowicz, 1998). CAPM
provides reality and allows illustrating certain implications about risk. It
is significant for practical applications and plays major role in the field of
cost of equity. CAPM was the first model developed by the financial
theorists (Graham & Harvey, 2001). To calculate the cost of equity about
75% of finance professors support using the CAPM (Welch, 2008). A
survey of CFOs was conducted and it indicates that 73.5% of responding
financial executives uses CAPM (Graham & Harvey, 2001). CAPM, has
also been tested by Shah and Butt in 2009 to calculate cost of equity. The
CAPM is extremely appealing model at an intellectual level, it is logical
and rational. Once someone understands and works with CAPM his
reaction is usually to accept it without question (Brigham & Ehrhardt,
2002). A survey conducted by Bruner, Eades, Harris and Higgins, (1998)
found that the CAPM is commonly preferred by the practitioners.
Therefore the current study used CAPM to estimate cost of equity in line
with (Shah & Butt, 2009).
The Regression Model
Panel regression analysis has been used which is in line with
(Hall, Hutchinson & Michaelas, 2004, Rafiq, Iqbal & Atiq, 2004; Shah &
Hijazi, 2004).
Keit = β 0 + β 1 (NEGit) + β 2 (RFit) + β 3 (TIEit) + β 4 (GRit) +β5 (FAit) +β6
(LDit) +β7 (TXit) + β8 (MCit) +e
Where:
Ke = Cost of equity,
NEG = Net Earnings Growth
RF = Retention of Funds
TIE = Times Interest Earned
GR = Gearing
FA = Fixed Asset Backing
LD = Long term debt
T = Tax
MC= Market Capitalization
Abasyn Journal of Social Sciences – Volume 9 – Issue 2
535
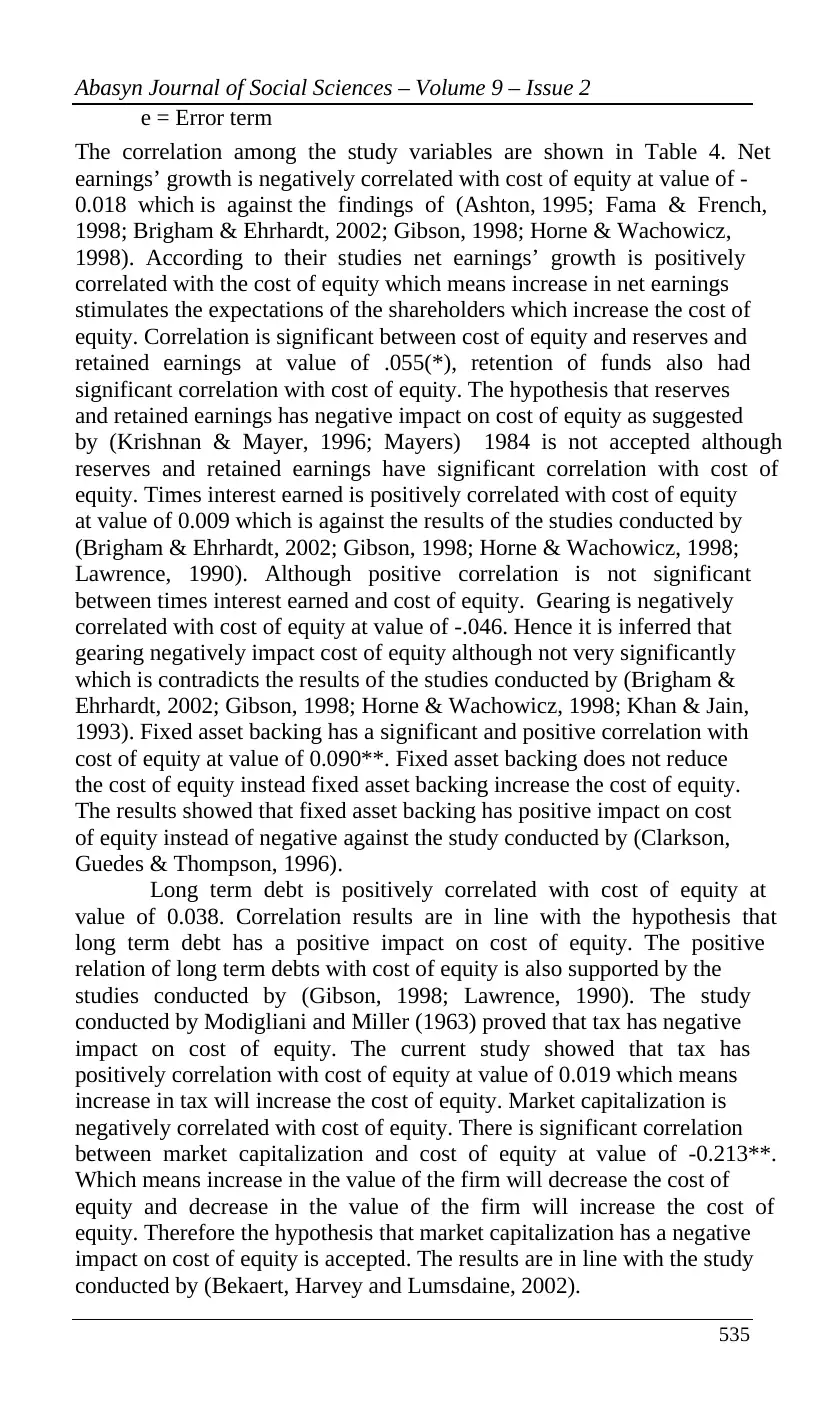
e = Error term
The correlation among the study variables are shown in Table 4. Net
earnings’ growth is negatively correlated with cost of equity at value of -
0.018 which is against the findings of (Ashton, 1995; Fama & French,
1998; Brigham & Ehrhardt, 2002; Gibson, 1998; Horne & Wachowicz,
1998). According to their studies net earnings’ growth is positively
correlated with the cost of equity which means increase in net earnings
stimulates the expectations of the shareholders which increase the cost of
equity. Correlation is significant between cost of equity and reserves and
retained earnings at value of .055(*), retention of funds also had
significant correlation with cost of equity. The hypothesis that reserves
and retained earnings has negative impact on cost of equity as suggested
by (Krishnan & Mayer, 1996; Mayers) 1984 is not accepted although
reserves and retained earnings have significant correlation with cost of
equity. Times interest earned is positively correlated with cost of equity
at value of 0.009 which is against the results of the studies conducted by
(Brigham & Ehrhardt, 2002; Gibson, 1998; Horne & Wachowicz, 1998;
Lawrence, 1990). Although positive correlation is not significant
between times interest earned and cost of equity. Gearing is negatively
correlated with cost of equity at value of -.046. Hence it is inferred that
gearing negatively impact cost of equity although not very significantly
which is contradicts the results of the studies conducted by (Brigham &
Ehrhardt, 2002; Gibson, 1998; Horne & Wachowicz, 1998; Khan & Jain,
1993). Fixed asset backing has a significant and positive correlation with
cost of equity at value of 0.090**. Fixed asset backing does not reduce
the cost of equity instead fixed asset backing increase the cost of equity.
The results showed that fixed asset backing has positive impact on cost
of equity instead of negative against the study conducted by (Clarkson,
Guedes & Thompson, 1996).
Long term debt is positively correlated with cost of equity at
value of 0.038. Correlation results are in line with the hypothesis that
long term debt has a positive impact on cost of equity. The positive
relation of long term debts with cost of equity is also supported by the
studies conducted by (Gibson, 1998; Lawrence, 1990). The study
conducted by Modigliani and Miller (1963) proved that tax has negative
impact on cost of equity. The current study showed that tax has
positively correlation with cost of equity at value of 0.019 which means
increase in tax will increase the cost of equity. Market capitalization is
negatively correlated with cost of equity. There is significant correlation
between market capitalization and cost of equity at value of -0.213**.
Which means increase in the value of the firm will decrease the cost of
equity and decrease in the value of the firm will increase the cost of
equity. Therefore the hypothesis that market capitalization has a negative
impact on cost of equity is accepted. The results are in line with the study
conducted by (Bekaert, Harvey and Lumsdaine, 2002).
535
e = Error term
The correlation among the study variables are shown in Table 4. Net
earnings’ growth is negatively correlated with cost of equity at value of -
0.018 which is against the findings of (Ashton, 1995; Fama & French,
1998; Brigham & Ehrhardt, 2002; Gibson, 1998; Horne & Wachowicz,
1998). According to their studies net earnings’ growth is positively
correlated with the cost of equity which means increase in net earnings
stimulates the expectations of the shareholders which increase the cost of
equity. Correlation is significant between cost of equity and reserves and
retained earnings at value of .055(*), retention of funds also had
significant correlation with cost of equity. The hypothesis that reserves
and retained earnings has negative impact on cost of equity as suggested
by (Krishnan & Mayer, 1996; Mayers) 1984 is not accepted although
reserves and retained earnings have significant correlation with cost of
equity. Times interest earned is positively correlated with cost of equity
at value of 0.009 which is against the results of the studies conducted by
(Brigham & Ehrhardt, 2002; Gibson, 1998; Horne & Wachowicz, 1998;
Lawrence, 1990). Although positive correlation is not significant
between times interest earned and cost of equity. Gearing is negatively
correlated with cost of equity at value of -.046. Hence it is inferred that
gearing negatively impact cost of equity although not very significantly
which is contradicts the results of the studies conducted by (Brigham &
Ehrhardt, 2002; Gibson, 1998; Horne & Wachowicz, 1998; Khan & Jain,
1993). Fixed asset backing has a significant and positive correlation with
cost of equity at value of 0.090**. Fixed asset backing does not reduce
the cost of equity instead fixed asset backing increase the cost of equity.
The results showed that fixed asset backing has positive impact on cost
of equity instead of negative against the study conducted by (Clarkson,
Guedes & Thompson, 1996).
Long term debt is positively correlated with cost of equity at
value of 0.038. Correlation results are in line with the hypothesis that
long term debt has a positive impact on cost of equity. The positive
relation of long term debts with cost of equity is also supported by the
studies conducted by (Gibson, 1998; Lawrence, 1990). The study
conducted by Modigliani and Miller (1963) proved that tax has negative
impact on cost of equity. The current study showed that tax has
positively correlation with cost of equity at value of 0.019 which means
increase in tax will increase the cost of equity. Market capitalization is
negatively correlated with cost of equity. There is significant correlation
between market capitalization and cost of equity at value of -0.213**.
Which means increase in the value of the firm will decrease the cost of
equity and decrease in the value of the firm will increase the cost of
equity. Therefore the hypothesis that market capitalization has a negative
impact on cost of equity is accepted. The results are in line with the study
conducted by (Bekaert, Harvey and Lumsdaine, 2002).
⊘ This is a preview!⊘
Do you want full access?
Subscribe today to unlock all pages.
Trusted by 1+ million students worldwide
Abasyn Journal of Social Sciences – Volume 9 – Issue 2
536
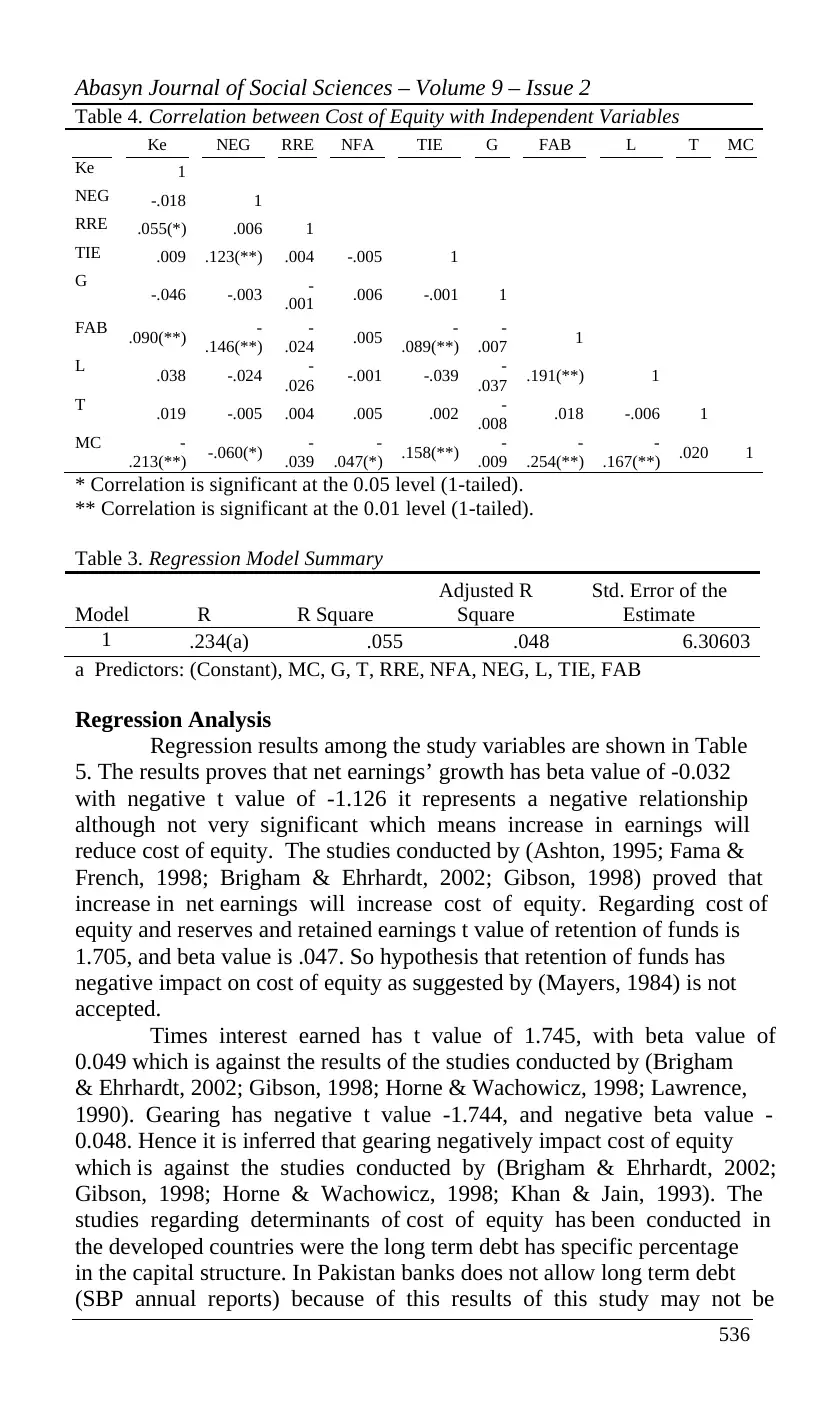
Table 4. Correlation between Cost of Equity with Independent Variables
Ke NEG RRE NFA TIE G FAB L T MC
Ke 1
NEG -.018 1
RRE .055(*) .006 1
TIE .009 .123(**) .004 -.005 1
G -.046 -.003 -
.001 .006 -.001 1
FAB .090(**) -
.146(**)
-
.024 .005 -
.089(**)
-
.007 1
L .038 -.024 -
.026 -.001 -.039 -
.037 .191(**) 1
T .019 -.005 .004 .005 .002 -
.008 .018 -.006 1
MC -
.213(**) -.060(*) -
.039
-
.047(*) .158(**) -
.009
-
.254(**)
-
.167(**) .020 1
* Correlation is significant at the 0.05 level (1-tailed).
** Correlation is significant at the 0.01 level (1-tailed).
Table 3. Regression Model Summary
Model R R Square
Adjusted R
Square
Std. Error of the
Estimate
1 .234(a) .055 .048 6.30603
a Predictors: (Constant), MC, G, T, RRE, NFA, NEG, L, TIE, FAB
Regression Analysis
Regression results among the study variables are shown in Table
5. The results proves that net earnings’ growth has beta value of -0.032
with negative t value of -1.126 it represents a negative relationship
although not very significant which means increase in earnings will
reduce cost of equity. The studies conducted by (Ashton, 1995; Fama &
French, 1998; Brigham & Ehrhardt, 2002; Gibson, 1998) proved that
increase in net earnings will increase cost of equity. Regarding cost of
equity and reserves and retained earnings t value of retention of funds is
1.705, and beta value is .047. So hypothesis that retention of funds has
negative impact on cost of equity as suggested by (Mayers, 1984) is not
accepted.
Times interest earned has t value of 1.745, with beta value of
0.049 which is against the results of the studies conducted by (Brigham
& Ehrhardt, 2002; Gibson, 1998; Horne & Wachowicz, 1998; Lawrence,
1990). Gearing has negative t value -1.744, and negative beta value -
0.048. Hence it is inferred that gearing negatively impact cost of equity
which is against the studies conducted by (Brigham & Ehrhardt, 2002;
Gibson, 1998; Horne & Wachowicz, 1998; Khan & Jain, 1993). The
studies regarding determinants of cost of equity has been conducted in
the developed countries were the long term debt has specific percentage
in the capital structure. In Pakistan banks does not allow long term debt
(SBP annual reports) because of this results of this study may not be
536
Table 4. Correlation between Cost of Equity with Independent Variables
Ke NEG RRE NFA TIE G FAB L T MC
Ke 1
NEG -.018 1
RRE .055(*) .006 1
TIE .009 .123(**) .004 -.005 1
G -.046 -.003 -
.001 .006 -.001 1
FAB .090(**) -
.146(**)
-
.024 .005 -
.089(**)
-
.007 1
L .038 -.024 -
.026 -.001 -.039 -
.037 .191(**) 1
T .019 -.005 .004 .005 .002 -
.008 .018 -.006 1
MC -
.213(**) -.060(*) -
.039
-
.047(*) .158(**) -
.009
-
.254(**)
-
.167(**) .020 1
* Correlation is significant at the 0.05 level (1-tailed).
** Correlation is significant at the 0.01 level (1-tailed).
Table 3. Regression Model Summary
Model R R Square
Adjusted R
Square
Std. Error of the
Estimate
1 .234(a) .055 .048 6.30603
a Predictors: (Constant), MC, G, T, RRE, NFA, NEG, L, TIE, FAB
Regression Analysis
Regression results among the study variables are shown in Table
5. The results proves that net earnings’ growth has beta value of -0.032
with negative t value of -1.126 it represents a negative relationship
although not very significant which means increase in earnings will
reduce cost of equity. The studies conducted by (Ashton, 1995; Fama &
French, 1998; Brigham & Ehrhardt, 2002; Gibson, 1998) proved that
increase in net earnings will increase cost of equity. Regarding cost of
equity and reserves and retained earnings t value of retention of funds is
1.705, and beta value is .047. So hypothesis that retention of funds has
negative impact on cost of equity as suggested by (Mayers, 1984) is not
accepted.
Times interest earned has t value of 1.745, with beta value of
0.049 which is against the results of the studies conducted by (Brigham
& Ehrhardt, 2002; Gibson, 1998; Horne & Wachowicz, 1998; Lawrence,
1990). Gearing has negative t value -1.744, and negative beta value -
0.048. Hence it is inferred that gearing negatively impact cost of equity
which is against the studies conducted by (Brigham & Ehrhardt, 2002;
Gibson, 1998; Horne & Wachowicz, 1998; Khan & Jain, 1993). The
studies regarding determinants of cost of equity has been conducted in
the developed countries were the long term debt has specific percentage
in the capital structure. In Pakistan banks does not allow long term debt
(SBP annual reports) because of this results of this study may not be
Paraphrase This Document
Need a fresh take? Get an instant paraphrase of this document with our AI Paraphraser
Abasyn Journal of Social Sciences – Volume 9 – Issue 2
537
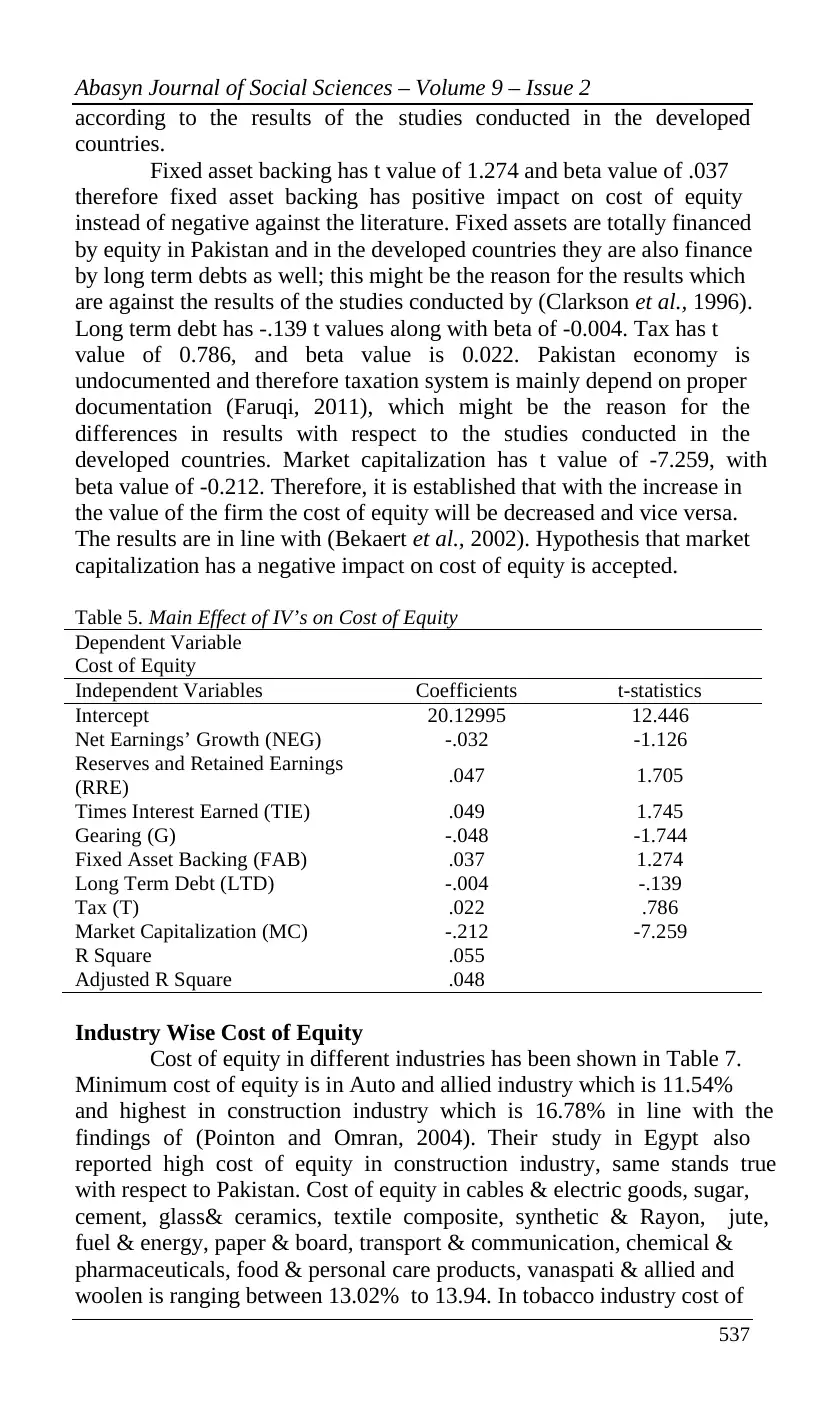
according to the results of the studies conducted in the developed
countries.
Fixed asset backing has t value of 1.274 and beta value of .037
therefore fixed asset backing has positive impact on cost of equity
instead of negative against the literature. Fixed assets are totally financed
by equity in Pakistan and in the developed countries they are also finance
by long term debts as well; this might be the reason for the results which
are against the results of the studies conducted by (Clarkson et al., 1996).
Long term debt has -.139 t values along with beta of -0.004. Tax has t
value of 0.786, and beta value is 0.022. Pakistan economy is
undocumented and therefore taxation system is mainly depend on proper
documentation (Faruqi, 2011), which might be the reason for the
differences in results with respect to the studies conducted in the
developed countries. Market capitalization has t value of -7.259, with
beta value of -0.212. Therefore, it is established that with the increase in
the value of the firm the cost of equity will be decreased and vice versa.
The results are in line with (Bekaert et al., 2002). Hypothesis that market
capitalization has a negative impact on cost of equity is accepted.
Table 5. Main Effect of IV’s on Cost of Equity
Dependent Variable
Cost of Equity
Independent Variables Coefficients t-statistics
Intercept 20.12995 12.446
Net Earnings’ Growth (NEG) -.032 -1.126
Reserves and Retained Earnings
(RRE) .047 1.705
Times Interest Earned (TIE) .049 1.745
Gearing (G) -.048 -1.744
Fixed Asset Backing (FAB) .037 1.274
Long Term Debt (LTD) -.004 -.139
Tax (T) .022 .786
Market Capitalization (MC) -.212 -7.259
R Square .055
Adjusted R Square .048
Industry Wise Cost of Equity
Cost of equity in different industries has been shown in Table 7.
Minimum cost of equity is in Auto and allied industry which is 11.54%
and highest in construction industry which is 16.78% in line with the
findings of (Pointon and Omran, 2004). Their study in Egypt also
reported high cost of equity in construction industry, same stands true
with respect to Pakistan. Cost of equity in cables & electric goods, sugar,
cement, glass& ceramics, textile composite, synthetic & Rayon, jute,
fuel & energy, paper & board, transport & communication, chemical &
pharmaceuticals, food & personal care products, vanaspati & allied and
woolen is ranging between 13.02% to 13.94. In tobacco industry cost of
537
according to the results of the studies conducted in the developed
countries.
Fixed asset backing has t value of 1.274 and beta value of .037
therefore fixed asset backing has positive impact on cost of equity
instead of negative against the literature. Fixed assets are totally financed
by equity in Pakistan and in the developed countries they are also finance
by long term debts as well; this might be the reason for the results which
are against the results of the studies conducted by (Clarkson et al., 1996).
Long term debt has -.139 t values along with beta of -0.004. Tax has t
value of 0.786, and beta value is 0.022. Pakistan economy is
undocumented and therefore taxation system is mainly depend on proper
documentation (Faruqi, 2011), which might be the reason for the
differences in results with respect to the studies conducted in the
developed countries. Market capitalization has t value of -7.259, with
beta value of -0.212. Therefore, it is established that with the increase in
the value of the firm the cost of equity will be decreased and vice versa.
The results are in line with (Bekaert et al., 2002). Hypothesis that market
capitalization has a negative impact on cost of equity is accepted.
Table 5. Main Effect of IV’s on Cost of Equity
Dependent Variable
Cost of Equity
Independent Variables Coefficients t-statistics
Intercept 20.12995 12.446
Net Earnings’ Growth (NEG) -.032 -1.126
Reserves and Retained Earnings
(RRE) .047 1.705
Times Interest Earned (TIE) .049 1.745
Gearing (G) -.048 -1.744
Fixed Asset Backing (FAB) .037 1.274
Long Term Debt (LTD) -.004 -.139
Tax (T) .022 .786
Market Capitalization (MC) -.212 -7.259
R Square .055
Adjusted R Square .048
Industry Wise Cost of Equity
Cost of equity in different industries has been shown in Table 7.
Minimum cost of equity is in Auto and allied industry which is 11.54%
and highest in construction industry which is 16.78% in line with the
findings of (Pointon and Omran, 2004). Their study in Egypt also
reported high cost of equity in construction industry, same stands true
with respect to Pakistan. Cost of equity in cables & electric goods, sugar,
cement, glass& ceramics, textile composite, synthetic & Rayon, jute,
fuel & energy, paper & board, transport & communication, chemical &
pharmaceuticals, food & personal care products, vanaspati & allied and
woolen is ranging between 13.02% to 13.94. In tobacco industry cost of
Abasyn Journal of Social Sciences – Volume 9 – Issue 2
538
equity is 12.06527 percent. Cost of equity is 15.28% in Leather, 14% in
tanneries, 14.21% in textile spinning and textile weaving. The average
cost of equity for all the industries in Pakistan is around 13.65 percent
which is in line with the finding of (Estrada, 2000) in emerging markets.
Conclusion
We find strong evidence that market capitalization has
significant impact on cost of equity. The results of the study were
counter to expectation and proves that net earnings growth, retention of
funds, times interest earned, gearing, fixed asset backing, long term debt
and tax have no impact on cost of equity. This may be because of the
corporate sector in Pakistan has been dominated by the family owned
businesses with non professional board of directors selected on the bases
of links (Shah & Butt, 2009). Secondly at present our empirical and
theoretical understanding of the cost of equity is still early with respect to
Pakistan. We caveat our results to some extent but current study still
provides solution for the deficiency in the existing literature by studying
the determinants of cost of equity in Pakistan.
Contribution of the Study
Our study contributes to economic growth measurement by
providing real results of cost of equity in different sectors of Pakistan.
No-doubt net income takes into account the cost of debt, which is
presented in income statement as interest expense, but does not
represents the cost of equity, therefore firms making a net profit can be
still unprofitable in an economic sense if the profit is less than their cost
of equity (Brigham & Houston, 2004). Current study provides first-hand
information to domestic and foreign investors regarding cost of doing
business in different industrial sectors of Pakistan. Global observation
reveals the fact that expected return by the equity holders is different
from industry due to the availability of investing opportunities. Finally
social and cultural aspects may be viewed as the determinants of cost of
equity.
Future Directions
Factors affecting cost of equity is very important area of research
as after determining the factors that effects cost of equity these factors
may be controlled to minimize the cost of equity that may contribute
towards maximization of shareholder wealth. So in the future research
may be conducted on how determinants of capital structure may differ
from sector to sector or industry to industry in Pakistan. This is because
literature suggests that determinants of cost of equity may vary from
industry to industry.
⊘ This is a preview!⊘
Do you want full access?
Subscribe today to unlock all pages.
Trusted by 1+ million students worldwide
1 out of 16
Your All-in-One AI-Powered Toolkit for Academic Success.
+13062052269
info@desklib.com
Available 24*7 on WhatsApp / Email
![[object Object]](/_next/static/media/star-bottom.7253800d.svg)
Unlock your academic potential
Copyright © 2020–2026 A2Z Services. All Rights Reserved. Developed and managed by ZUCOL.