Financial Analysis of Pan African Resources PLC (UU-MBA710)
VerifiedAdded on 2023/04/22
|19
|4403
|276
Report
AI Summary
This report provides a comprehensive financial analysis of Pan African Resources PLC, examining its performance from 2016 to 2018. The analysis includes an overview of the company's corporate governance status, highlighting key policies and challenges. It delves into the company's capital investments, detailing projects like the Elikhulu and Barberton Mines. The report assesses the sources of finance employed by the company, focusing on debt and equity. A detailed financial performance analysis is conducted using profitability ratios, including Return on Capital Employed and Net Profit Margin. Finally, the report evaluates the company's share price performance over a five-year period, offering insights from an investor's perspective. The report also highlights strategic pillars and business risks. The analysis is based on the provided annual reports and financial data, offering a well-rounded view of the company's financial health and strategic development. This report provides valuable information for investors and students interested in financial analysis of mining companies.
Running head: FINANCE AND STRATEGIC DEVELOPMENT
Finance
Name of the Student:
Name of the University:
Author’s Note:
Finance
Name of the Student:
Name of the University:
Author’s Note:
Paraphrase This Document
Need a fresh take? Get an instant paraphrase of this document with our AI Paraphraser
1FINANCE AND STRATEGIC DEVELOPMENT
Executive Summary
The aim of the assignment is to conduct a financial analysis on the Pan African Resources Plc.
Company covering the operational and financial performance of the company in the year 2016-
2018. The corporate governance status and challenges faced by the Pan African Resources Plc.
Company and the relevant analysis of the company in the form of financial performance of the
company was taken into for the company.
2FINANCE AND STRATEGIC DEVELOPMENT
Table of Contents
Introduction......................................................................................................................................3
Discussion........................................................................................................................................4
Corporate Governance Status and Challenges.............................................................................4
Capital Investment.......................................................................................................................7
Sources of Finance.......................................................................................................................8
Financial Performance.................................................................................................................9
Share Price Performance............................................................................................................11
Conclusion.....................................................................................................................................12
Recommendations..........................................................................................................................13
References......................................................................................................................................15
Appendix........................................................................................................................................18
⊘ This is a preview!⊘
Do you want full access?
Subscribe today to unlock all pages.
Trusted by 1+ million students worldwide
3FINANCE AND STRATEGIC DEVELOPMENT
Introduction
Pan African Resources is a Mid-Tier gold producing company focused in the Africa
having a production capacity of about 170,000 Oz amount of gold produced annually by the
company. The company is listed in the London and Johannesburg and is having majority of its
operation in the Southern African. The strategy applied by the company for conducting the
operations of the company is mining and exploring high yielding ore, which are relatively
cheaper to produce and gives high yield return to the company. The company presents its
corporate governance report, which covers the policies and the regulations of the company
(Neingo & Tholana, 2016). The financial performance of the company was analysed by
conducting ratio analysis for the company in the trend period 2017-18 and the financial analysis
of the company was done thereby analysing the financial performance of the company. The
important ratio’s that were analysed in the report were the profitability ratio, liquidity ratio,
activity ratio and gearing ratio for the company. The share price movement of the company was
also analysed for the five-year trend period were monthly data of the share price of the company
was taken down and the relevant analysis in the context of movement of the share price was
analysed (Krzemień et al. 2016). The company has planned various strategic reforms and ideas
that enables the company in better planning and managing the resources of the company.
Profitability and return generated ion the capital employed are some of the crucial aspects that
should be taken into analysis for the long-term growth of the company. The share price
performance for the company was assessed for the trend period of five year where monthly data
of the Pan African Resources Plc was taken into account for the analysis of the movement in the
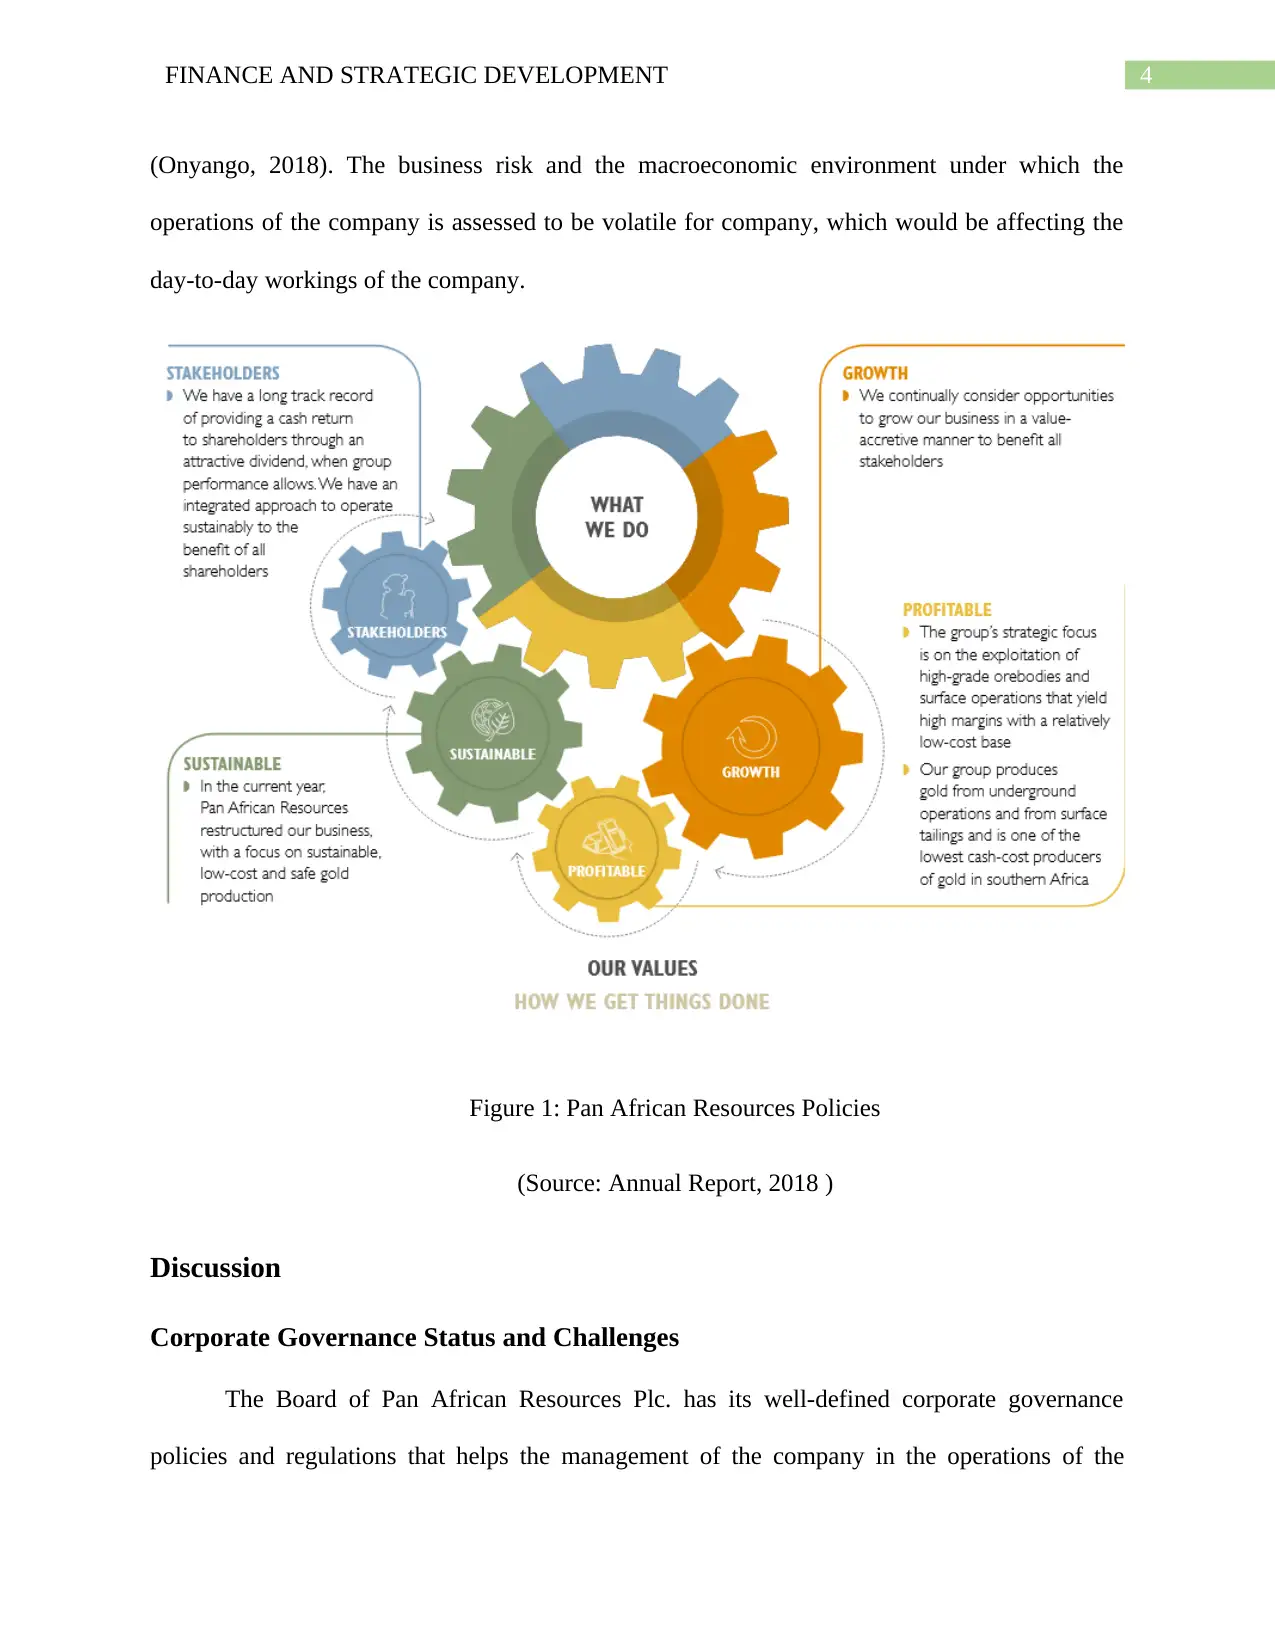
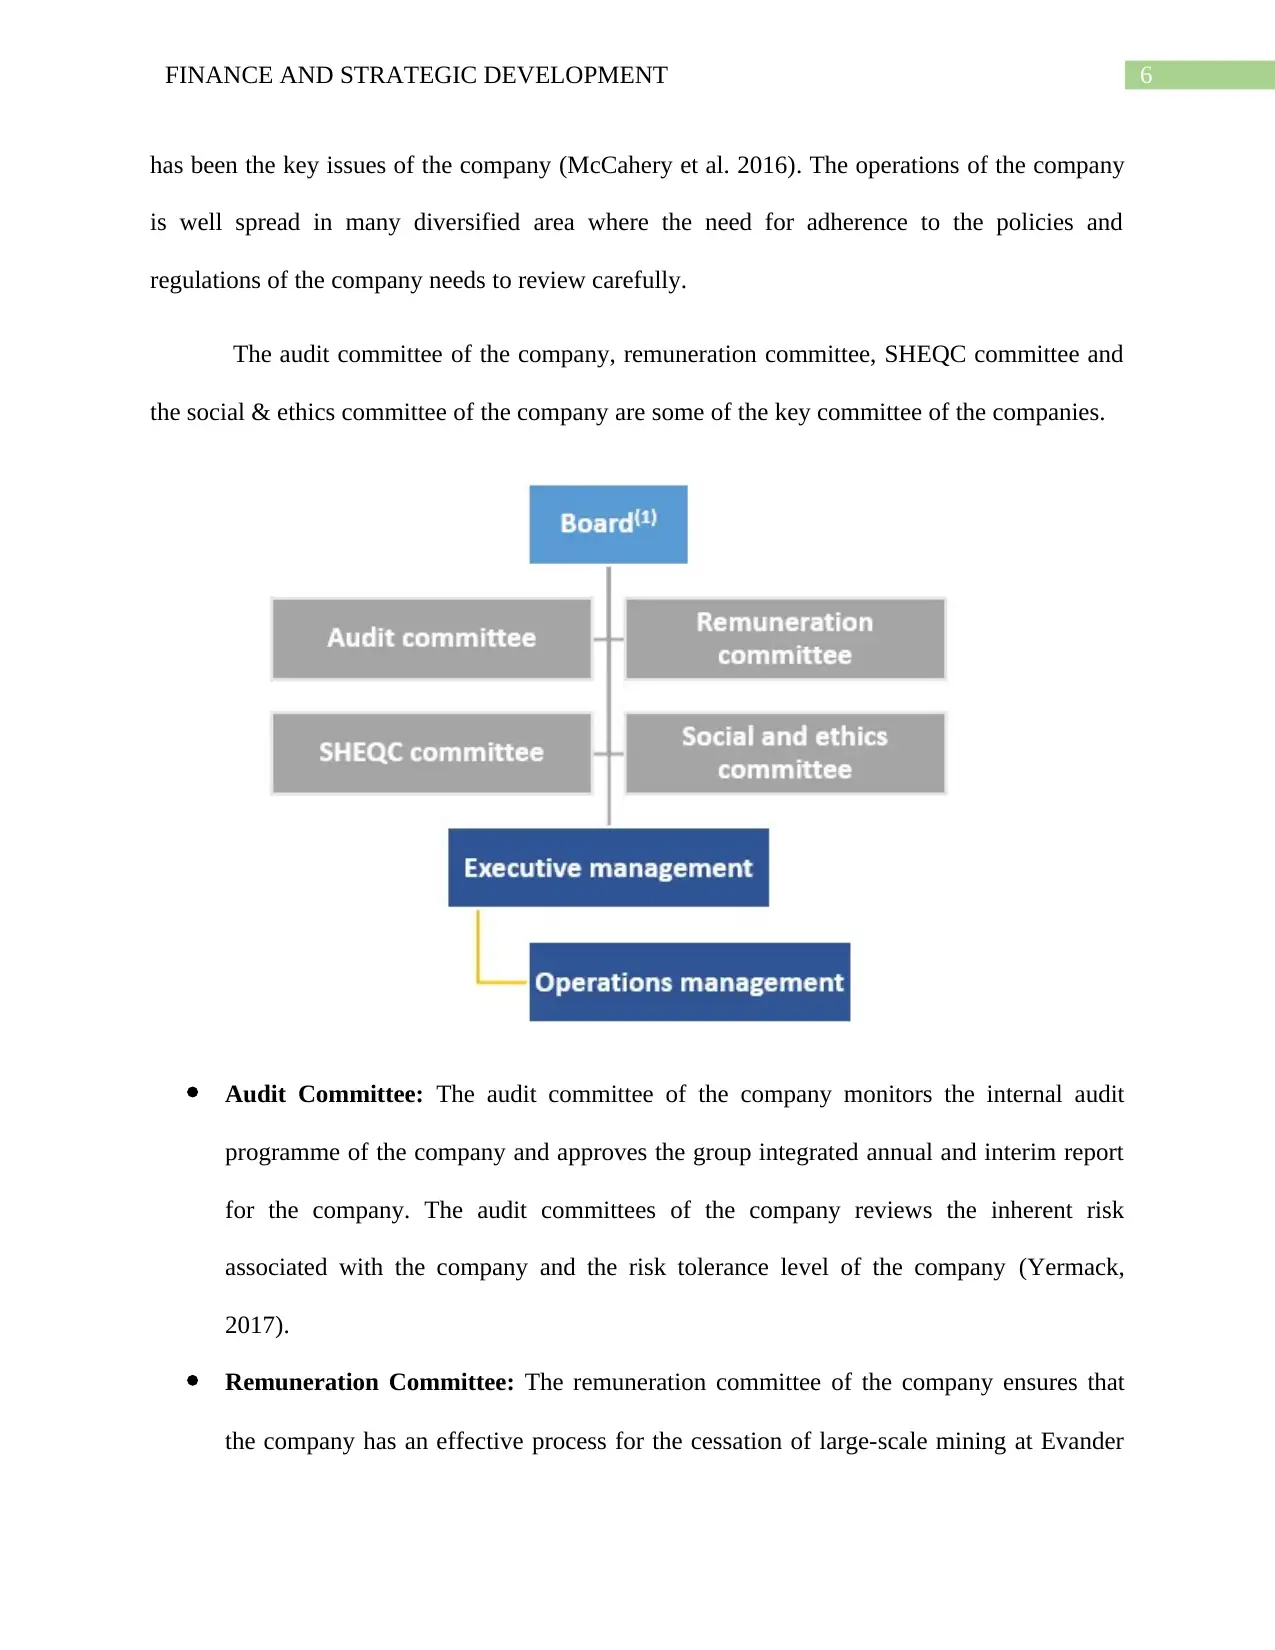
share price of the company. The four strategic pillars identified on which the operations of the
company is based is the growth, profitability, sustainability and stakeholders of the company
Introduction
Pan African Resources is a Mid-Tier gold producing company focused in the Africa
having a production capacity of about 170,000 Oz amount of gold produced annually by the
company. The company is listed in the London and Johannesburg and is having majority of its
operation in the Southern African. The strategy applied by the company for conducting the
operations of the company is mining and exploring high yielding ore, which are relatively
cheaper to produce and gives high yield return to the company. The company presents its
corporate governance report, which covers the policies and the regulations of the company
(Neingo & Tholana, 2016). The financial performance of the company was analysed by
conducting ratio analysis for the company in the trend period 2017-18 and the financial analysis
of the company was done thereby analysing the financial performance of the company. The
important ratio’s that were analysed in the report were the profitability ratio, liquidity ratio,
activity ratio and gearing ratio for the company. The share price movement of the company was
also analysed for the five-year trend period were monthly data of the share price of the company
was taken down and the relevant analysis in the context of movement of the share price was
analysed (Krzemień et al. 2016). The company has planned various strategic reforms and ideas
that enables the company in better planning and managing the resources of the company.
Profitability and return generated ion the capital employed are some of the crucial aspects that
should be taken into analysis for the long-term growth of the company. The share price
performance for the company was assessed for the trend period of five year where monthly data
of the Pan African Resources Plc was taken into account for the analysis of the movement in the
share price of the company. The four strategic pillars identified on which the operations of the
company is based is the growth, profitability, sustainability and stakeholders of the company
Paraphrase This Document
Need a fresh take? Get an instant paraphrase of this document with our AI Paraphraser
4FINANCE AND STRATEGIC DEVELOPMENT
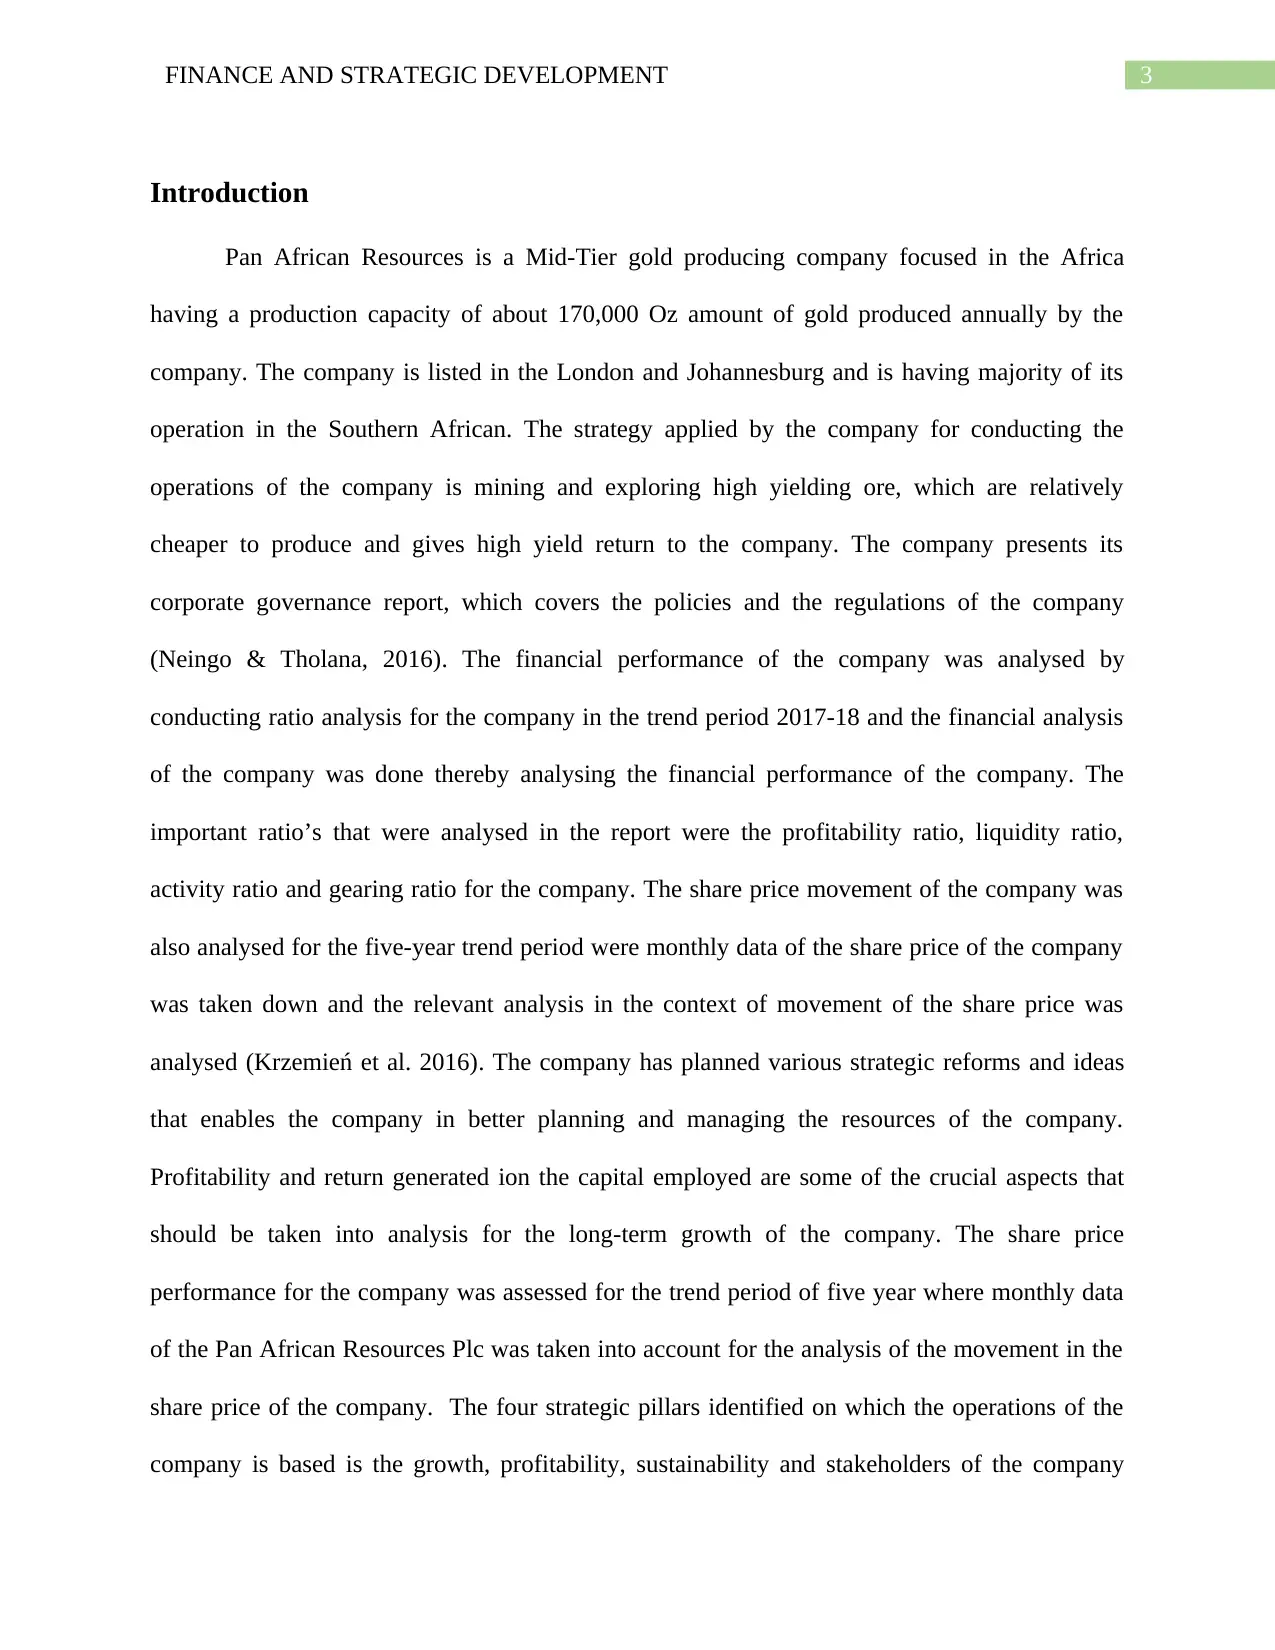
(Onyango, 2018). The business risk and the macroeconomic environment under which the
operations of the company is assessed to be volatile for company, which would be affecting the
day-to-day workings of the company.
Figure 1: Pan African Resources Policies
(Source: Annual Report, 2018 )
Discussion
Corporate Governance Status and Challenges
The Board of Pan African Resources Plc. has its well-defined corporate governance
policies and regulations that helps the management of the company in the operations of the
5FINANCE AND STRATEGIC DEVELOPMENT
company and guiding the company in the day-to-day workings of the company. The principles of
the corporate governance encompasses all the principles of responsibility of the management of
the company. The policies of the corporate governance of the company helps the company in
guiding the company in well ethical lines and operations of the company (Annual Report, 2018).
The corporate governance policies defined by the Pan African Resources Plc. is such that
will help the stakeholders of the company in getting confidence over the management of the
company and provide better transparency in the decision process of the company (Doni,
Gasperini & Pavone, 2016). The board of the company meets quarterly for assessing the various
policies and regulations of the company band for reviewing the performance of the company
(Corporate Governance (AIM – Rule 26) | Pan African Resources, 2018). The board of the
company looks after the corporate governance structure of the company and is having four sub
committees. The responsibilities of the chairman and the chief executive officer of the company
is well defined in the corporate governance policy of the company. The board of the company is
responsible and accountable for the measurement of the performance and the affairs of the
company (Dimopoulos & Wagner, 2016). The activities of the board of the company is well
defined in the annual report of the company where the focus area of the company is the strategy
and operational execution, risk management, governance and stakeholder’s engagement of the
company (Tricker, 2015).
The board member of the Pan African Resources Company faces certain challenges in the
field of changing political environment and the economic environment under which the
operations of the company operates. The labour relations and agreement expired in the current
financial year for which the company now need to review the same and review the policies. The
rising production cost in South Africa and the operational management issues in the company
⊘ This is a preview!⊘
Do you want full access?
Subscribe today to unlock all pages.
Trusted by 1+ million students worldwide
6FINANCE AND STRATEGIC DEVELOPMENT
has been the key issues of the company (McCahery et al. 2016). The operations of the company
is well spread in many diversified area where the need for adherence to the policies and
regulations of the company needs to review carefully.
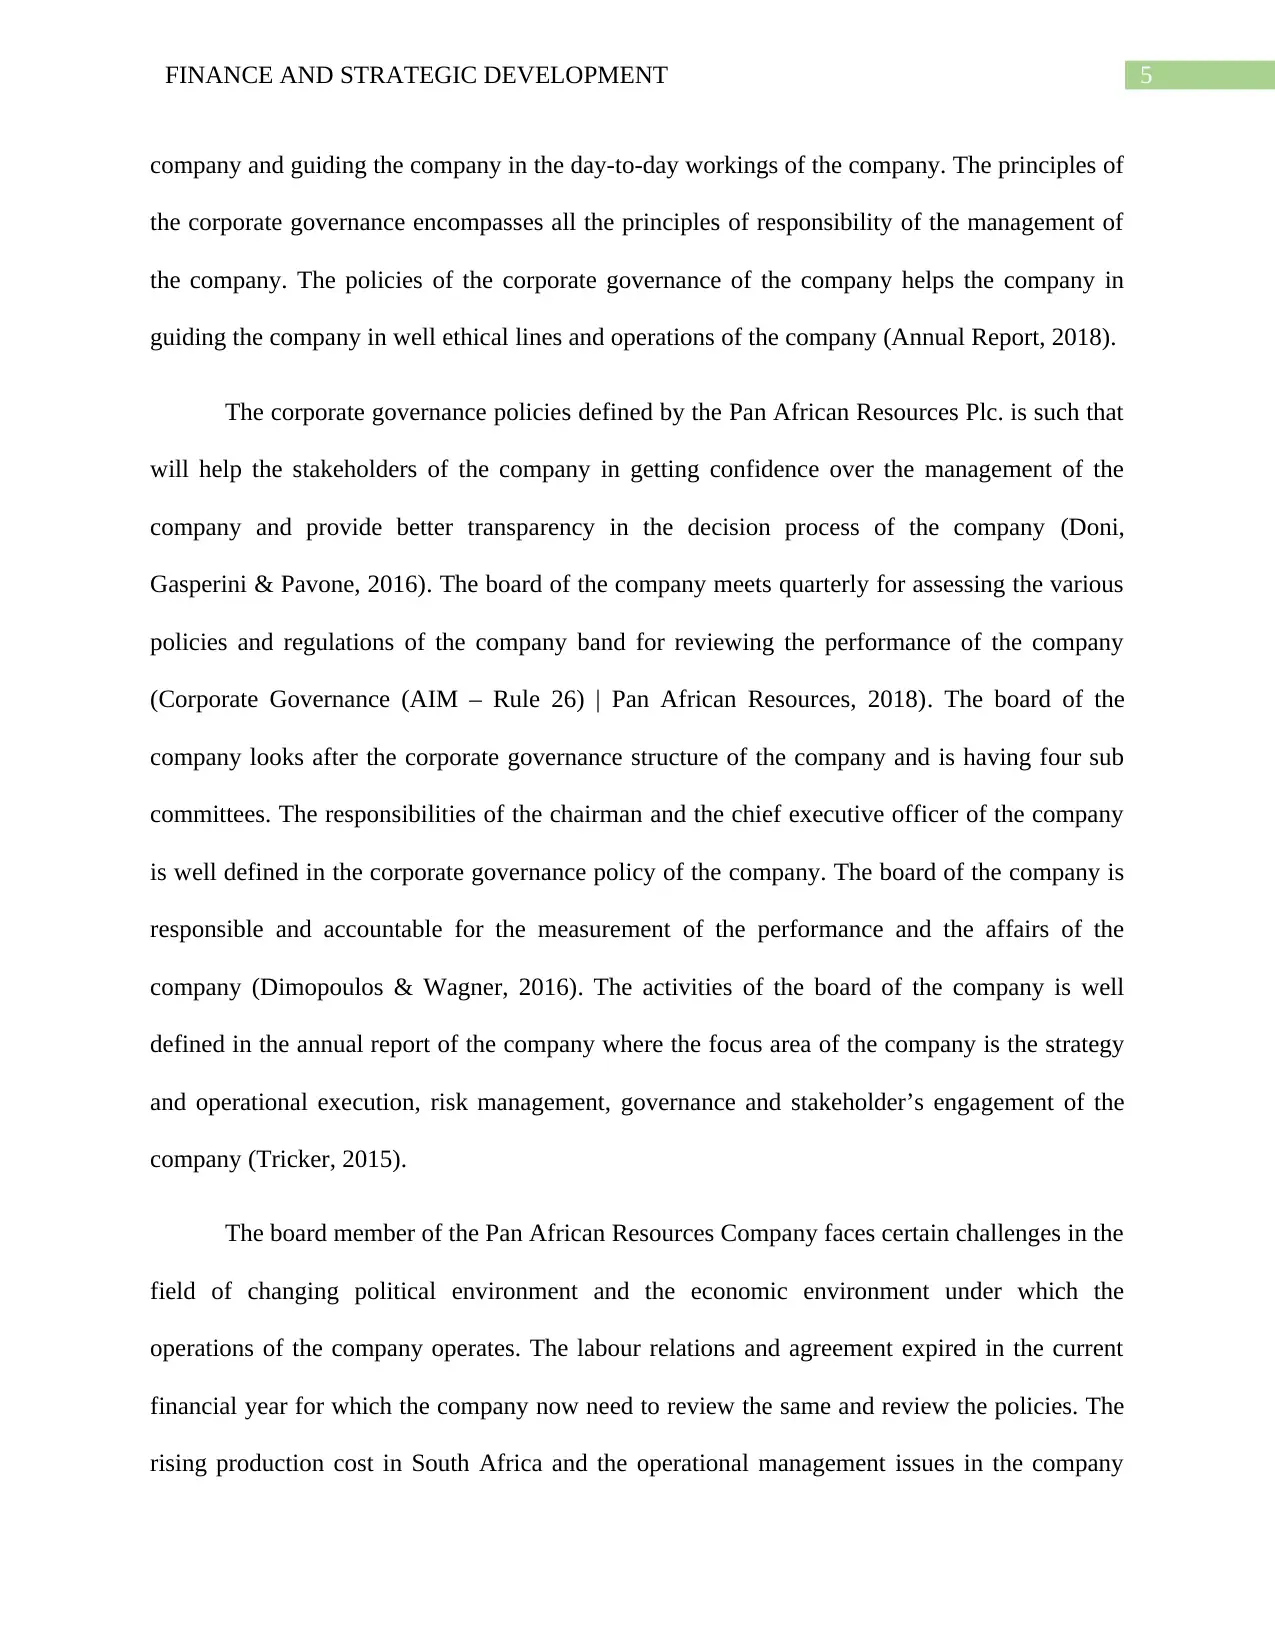
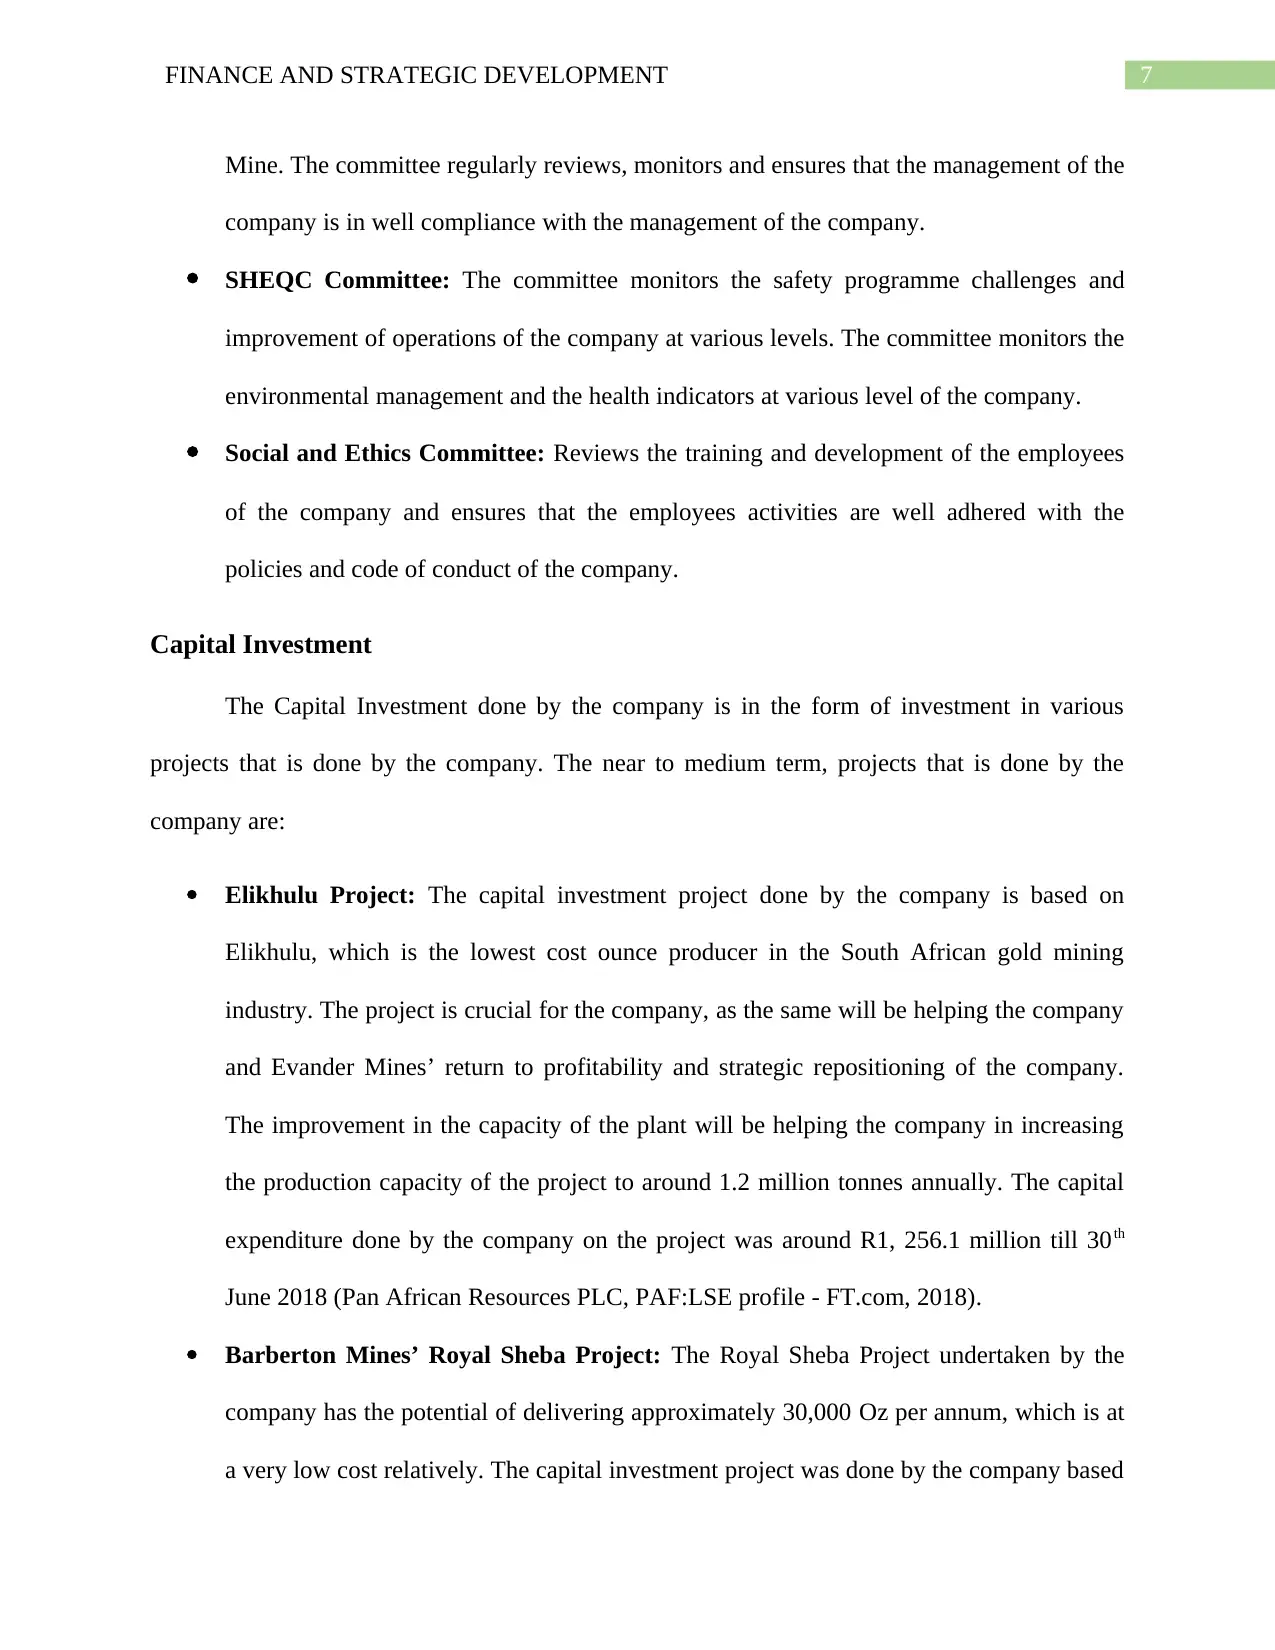
The audit committee of the company, remuneration committee, SHEQC committee and
the social & ethics committee of the company are some of the key committee of the companies.
Audit Committee: The audit committee of the company monitors the internal audit
programme of the company and approves the group integrated annual and interim report
for the company. The audit committees of the company reviews the inherent risk
associated with the company and the risk tolerance level of the company (Yermack,
2017).
Remuneration Committee: The remuneration committee of the company ensures that
the company has an effective process for the cessation of large-scale mining at Evander
has been the key issues of the company (McCahery et al. 2016). The operations of the company
is well spread in many diversified area where the need for adherence to the policies and
regulations of the company needs to review carefully.
The audit committee of the company, remuneration committee, SHEQC committee and
the social & ethics committee of the company are some of the key committee of the companies.
Audit Committee: The audit committee of the company monitors the internal audit
programme of the company and approves the group integrated annual and interim report
for the company. The audit committees of the company reviews the inherent risk
associated with the company and the risk tolerance level of the company (Yermack,
2017).
Remuneration Committee: The remuneration committee of the company ensures that
the company has an effective process for the cessation of large-scale mining at Evander
Paraphrase This Document
Need a fresh take? Get an instant paraphrase of this document with our AI Paraphraser
7FINANCE AND STRATEGIC DEVELOPMENT
Mine. The committee regularly reviews, monitors and ensures that the management of the
company is in well compliance with the management of the company.
SHEQC Committee: The committee monitors the safety programme challenges and
improvement of operations of the company at various levels. The committee monitors the
environmental management and the health indicators at various level of the company.
Social and Ethics Committee: Reviews the training and development of the employees
of the company and ensures that the employees activities are well adhered with the
policies and code of conduct of the company.
Capital Investment
The Capital Investment done by the company is in the form of investment in various
projects that is done by the company. The near to medium term, projects that is done by the
company are:
Elikhulu Project: The capital investment project done by the company is based on
Elikhulu, which is the lowest cost ounce producer in the South African gold mining
industry. The project is crucial for the company, as the same will be helping the company
and Evander Mines’ return to profitability and strategic repositioning of the company.
The improvement in the capacity of the plant will be helping the company in increasing
the production capacity of the project to around 1.2 million tonnes annually. The capital
expenditure done by the company on the project was around R1, 256.1 million till 30th
June 2018 (Pan African Resources PLC, PAF:LSE profile - FT.com, 2018).
Barberton Mines’ Royal Sheba Project: The Royal Sheba Project undertaken by the
company has the potential of delivering approximately 30,000 Oz per annum, which is at
a very low cost relatively. The capital investment project was done by the company based
8FINANCE AND STRATEGIC DEVELOPMENT
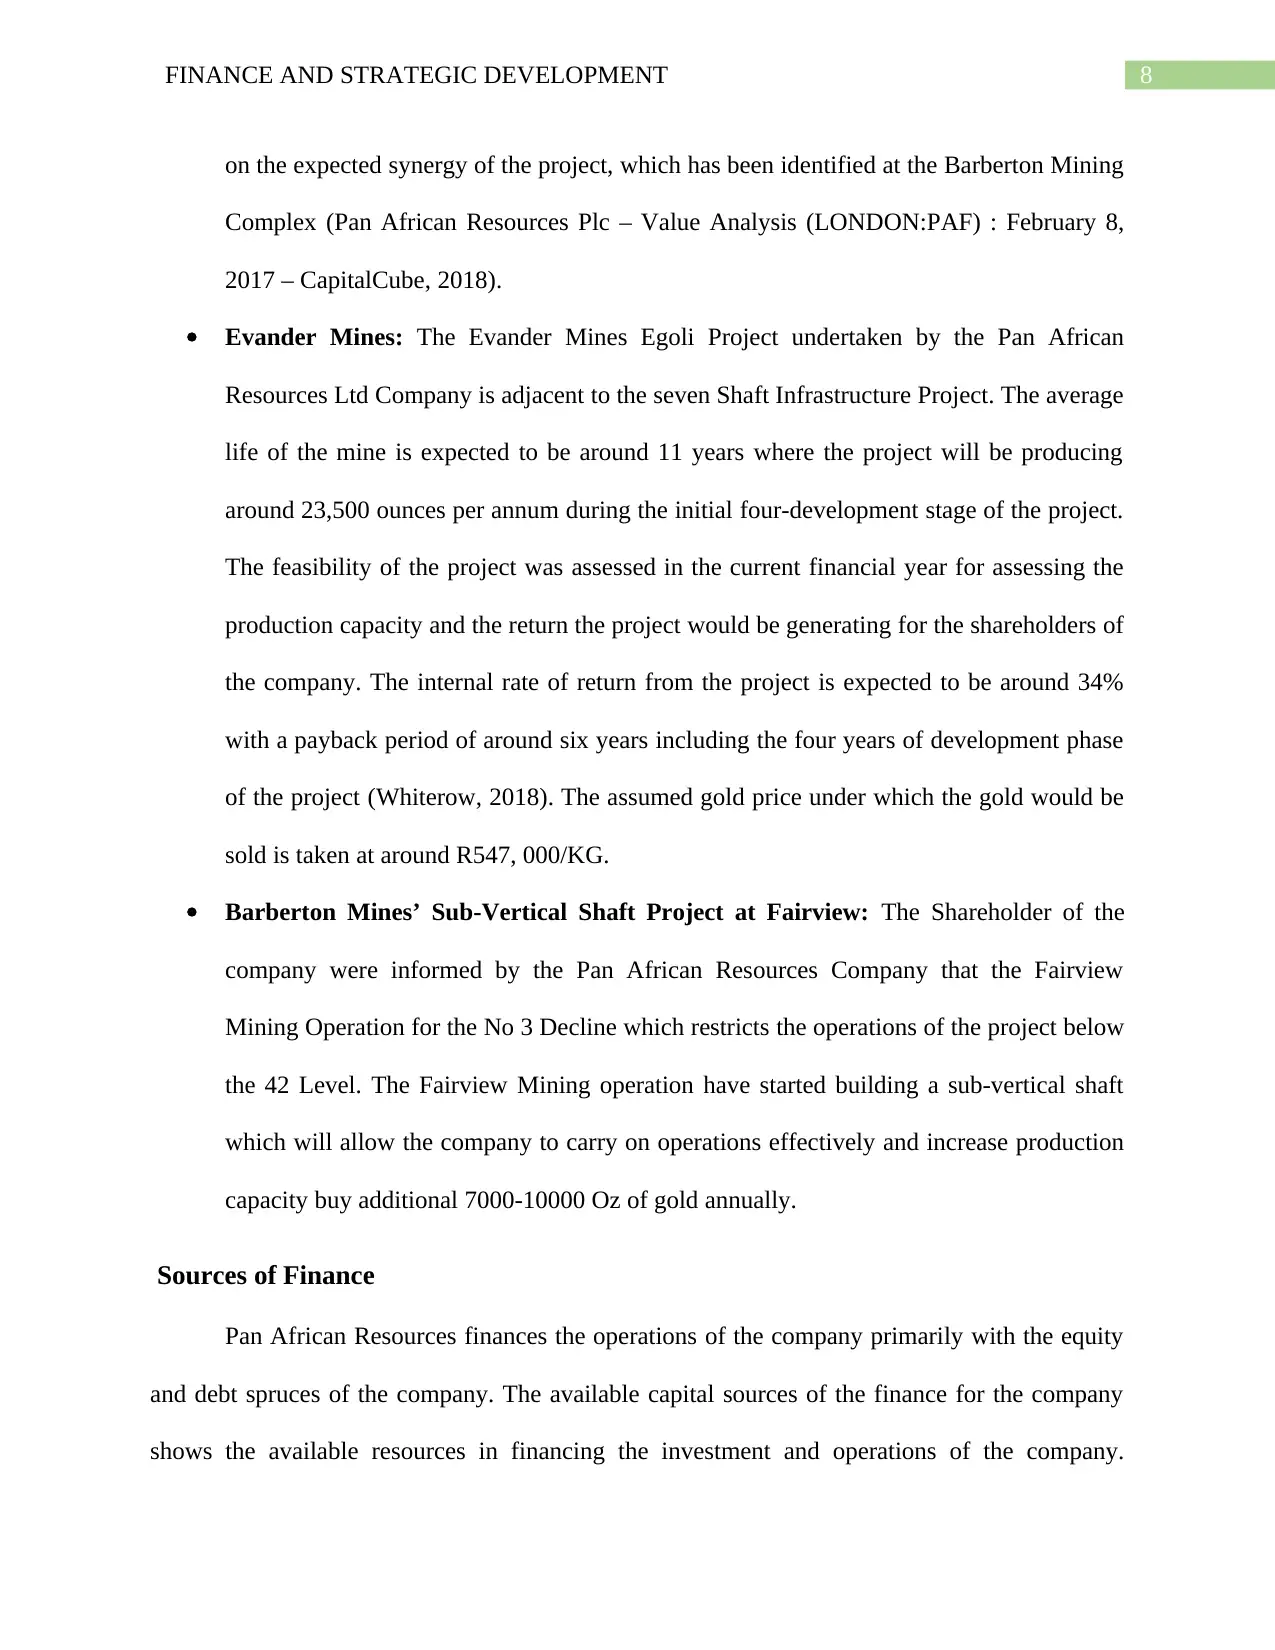
on the expected synergy of the project, which has been identified at the Barberton Mining
Complex (Pan African Resources Plc – Value Analysis (LONDON:PAF) : February 8,
2017 – CapitalCube, 2018).
Evander Mines: The Evander Mines Egoli Project undertaken by the Pan African
Resources Ltd Company is adjacent to the seven Shaft Infrastructure Project. The average
life of the mine is expected to be around 11 years where the project will be producing
around 23,500 ounces per annum during the initial four-development stage of the project.
The feasibility of the project was assessed in the current financial year for assessing the
production capacity and the return the project would be generating for the shareholders of
the company. The internal rate of return from the project is expected to be around 34%
with a payback period of around six years including the four years of development phase
of the project (Whiterow, 2018). The assumed gold price under which the gold would be
sold is taken at around R547, 000/KG.
Barberton Mines’ Sub-Vertical Shaft Project at Fairview: The Shareholder of the
company were informed by the Pan African Resources Company that the Fairview
Mining Operation for the No 3 Decline which restricts the operations of the project below
the 42 Level. The Fairview Mining operation have started building a sub-vertical shaft
which will allow the company to carry on operations effectively and increase production
capacity buy additional 7000-10000 Oz of gold annually.
Sources of Finance
Pan African Resources finances the operations of the company primarily with the equity
and debt spruces of the company. The available capital sources of the finance for the company
shows the available resources in financing the investment and operations of the company.
⊘ This is a preview!⊘
Do you want full access?
Subscribe today to unlock all pages.
Trusted by 1+ million students worldwide
9FINANCE AND STRATEGIC DEVELOPMENT
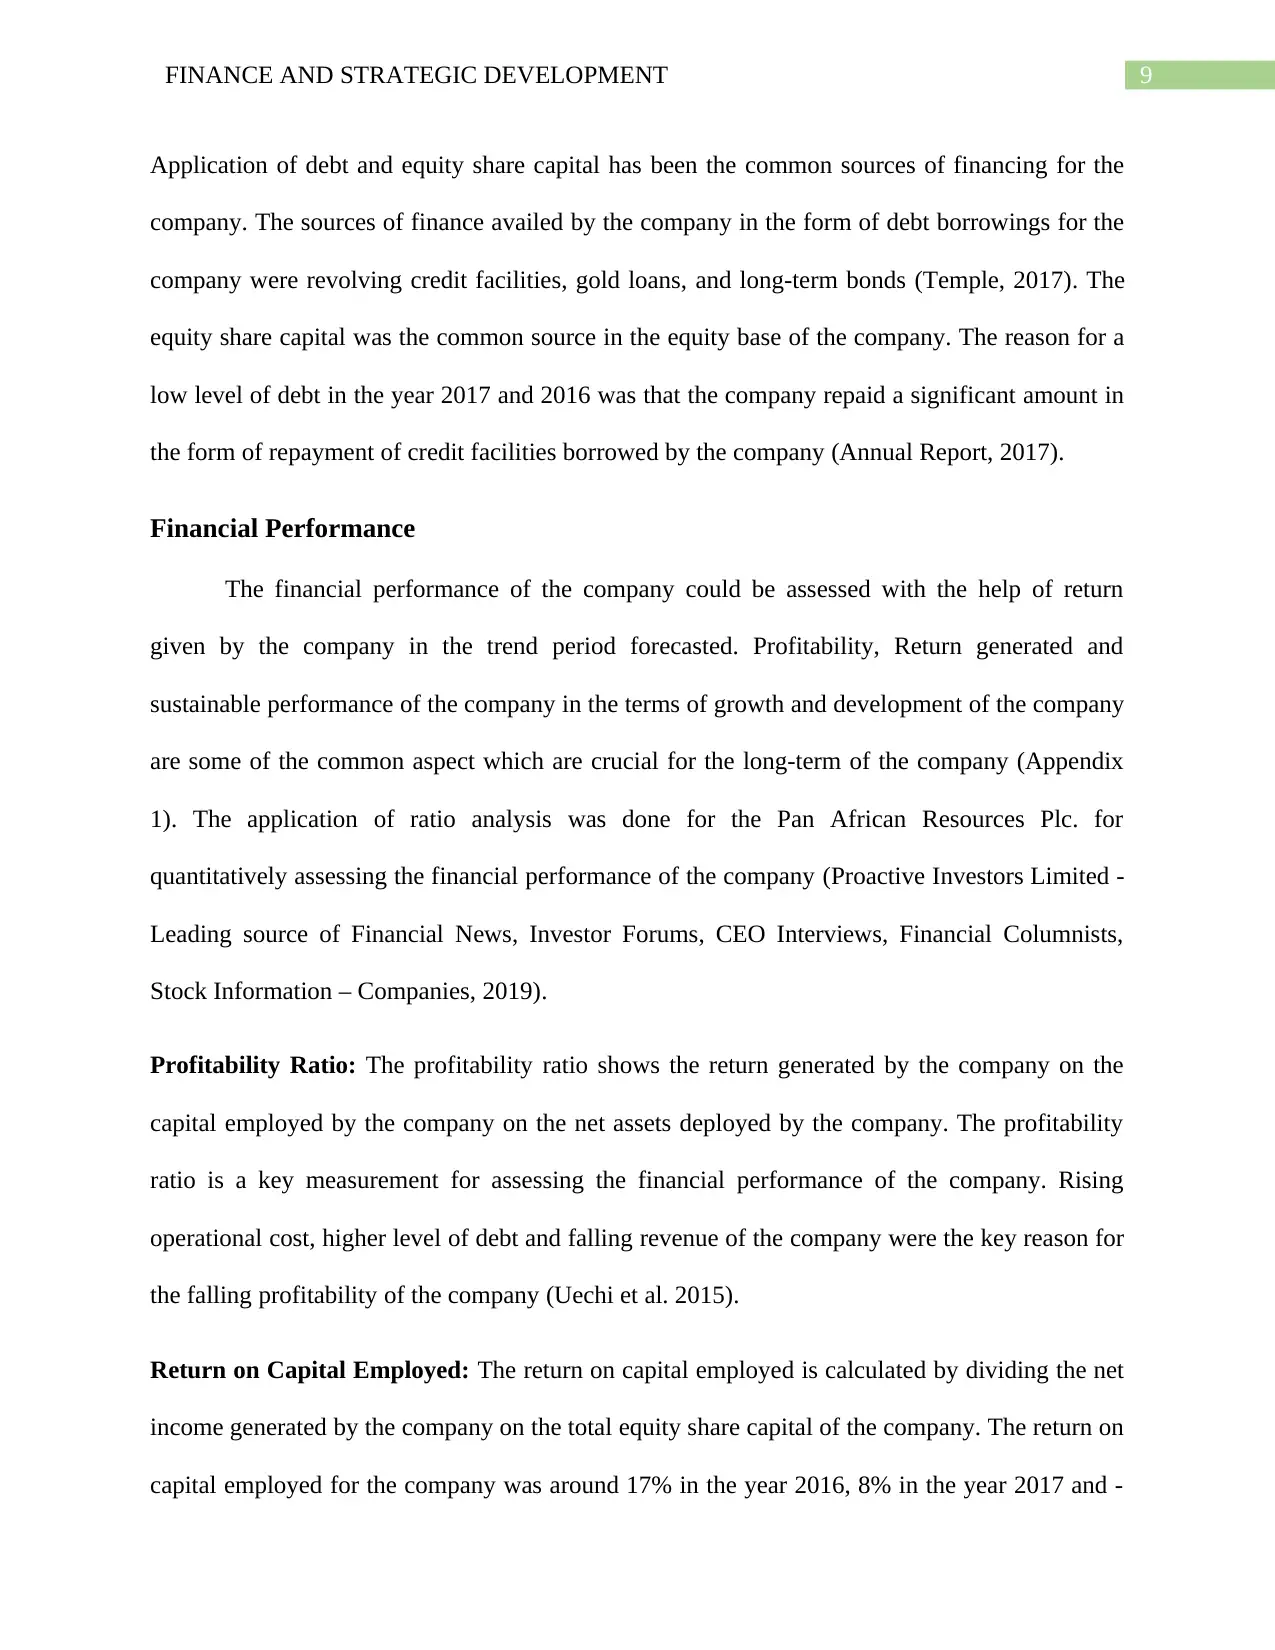
Application of debt and equity share capital has been the common sources of financing for the
company. The sources of finance availed by the company in the form of debt borrowings for the
company were revolving credit facilities, gold loans, and long-term bonds (Temple, 2017). The
equity share capital was the common source in the equity base of the company. The reason for a
low level of debt in the year 2017 and 2016 was that the company repaid a significant amount in
the form of repayment of credit facilities borrowed by the company (Annual Report, 2017).
Financial Performance
The financial performance of the company could be assessed with the help of return
given by the company in the trend period forecasted. Profitability, Return generated and
sustainable performance of the company in the terms of growth and development of the company
are some of the common aspect which are crucial for the long-term of the company (Appendix
1). The application of ratio analysis was done for the Pan African Resources Plc. for
quantitatively assessing the financial performance of the company (Proactive Investors Limited -
Leading source of Financial News, Investor Forums, CEO Interviews, Financial Columnists,
Stock Information – Companies, 2019).
Profitability Ratio: The profitability ratio shows the return generated by the company on the
capital employed by the company on the net assets deployed by the company. The profitability
ratio is a key measurement for assessing the financial performance of the company. Rising
operational cost, higher level of debt and falling revenue of the company were the key reason for
the falling profitability of the company (Uechi et al. 2015).
Return on Capital Employed: The return on capital employed is calculated by dividing the net
income generated by the company on the total equity share capital of the company. The return on
capital employed for the company was around 17% in the year 2016, 8% in the year 2017 and -
Paraphrase This Document
Need a fresh take? Get an instant paraphrase of this document with our AI Paraphraser
10FINANCE AND STRATEGIC DEVELOPMENT
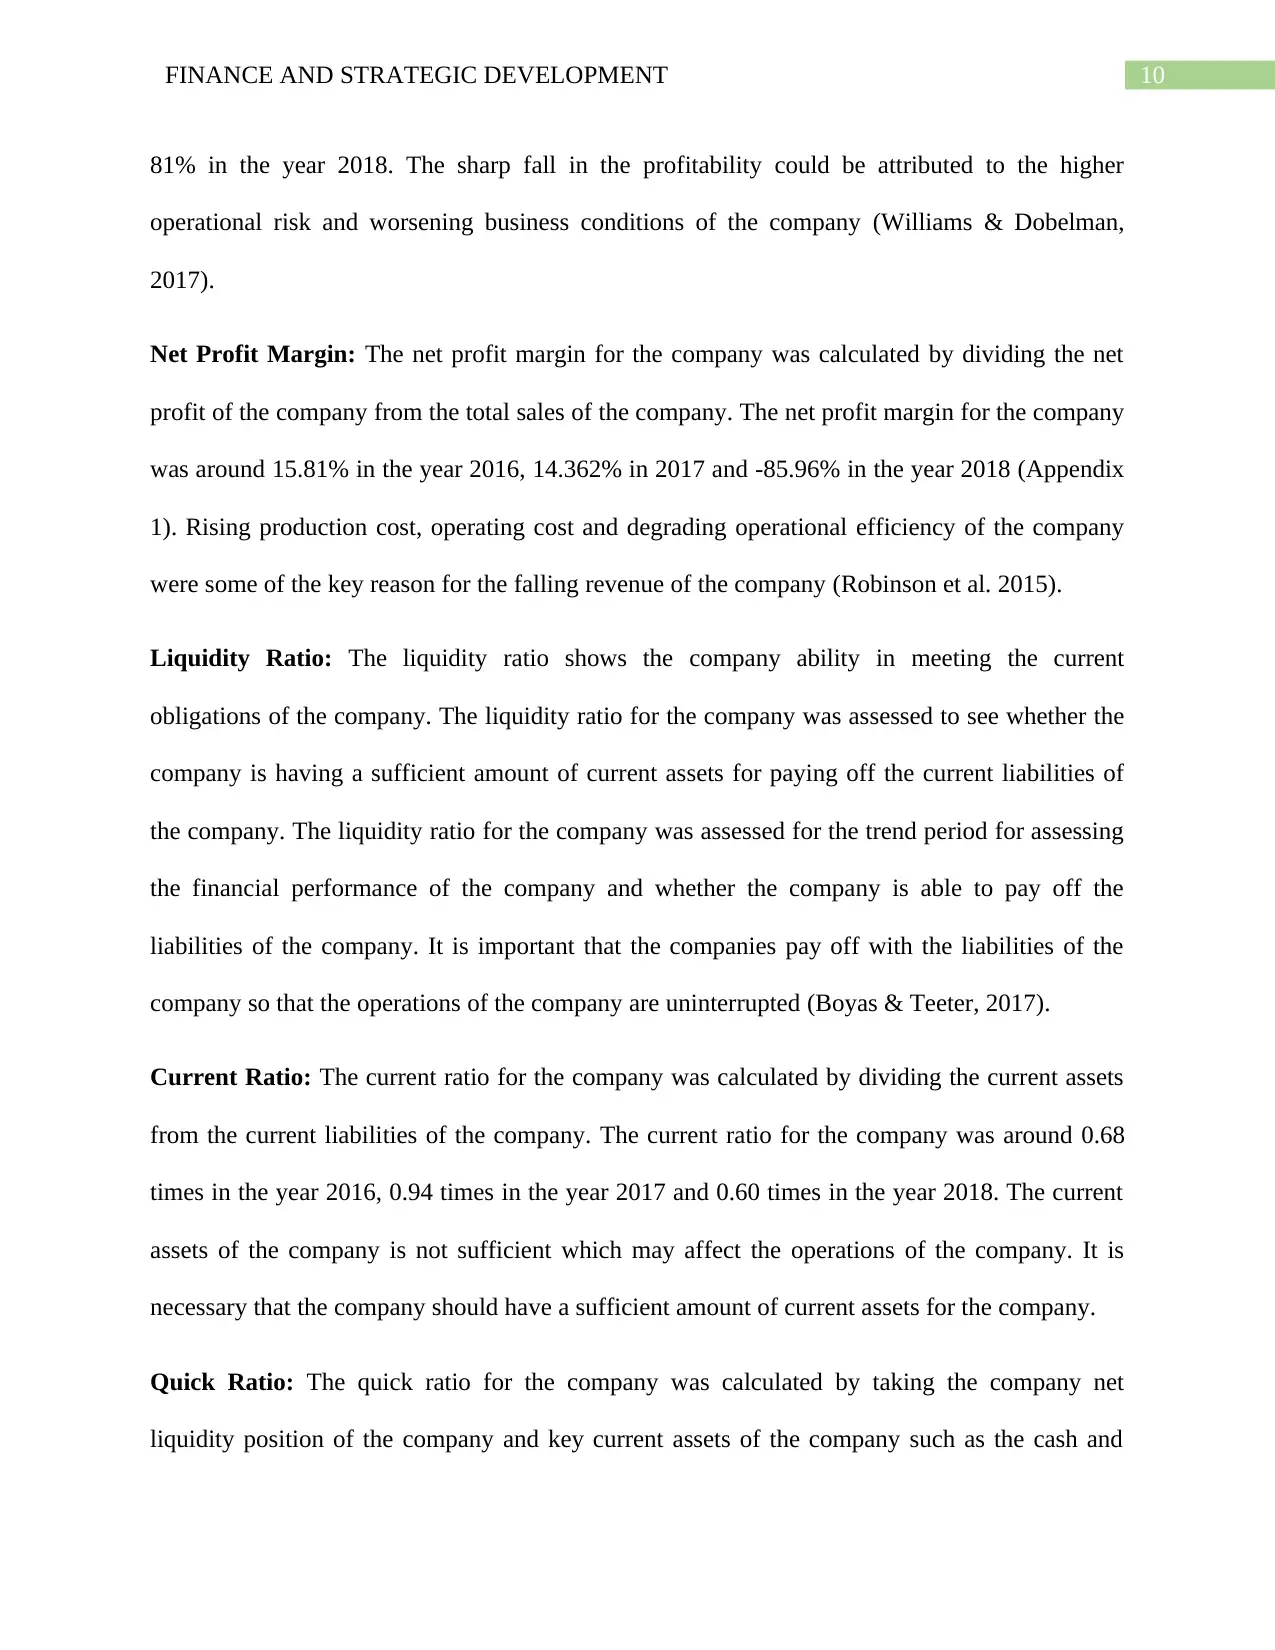
81% in the year 2018. The sharp fall in the profitability could be attributed to the higher
operational risk and worsening business conditions of the company (Williams & Dobelman,
2017).
Net Profit Margin: The net profit margin for the company was calculated by dividing the net
profit of the company from the total sales of the company. The net profit margin for the company
was around 15.81% in the year 2016, 14.362% in 2017 and -85.96% in the year 2018 (Appendix
1). Rising production cost, operating cost and degrading operational efficiency of the company
were some of the key reason for the falling revenue of the company (Robinson et al. 2015).
Liquidity Ratio: The liquidity ratio shows the company ability in meeting the current
obligations of the company. The liquidity ratio for the company was assessed to see whether the
company is having a sufficient amount of current assets for paying off the current liabilities of
the company. The liquidity ratio for the company was assessed for the trend period for assessing
the financial performance of the company and whether the company is able to pay off the
liabilities of the company. It is important that the companies pay off with the liabilities of the
company so that the operations of the company are uninterrupted (Boyas & Teeter, 2017).
Current Ratio: The current ratio for the company was calculated by dividing the current assets
from the current liabilities of the company. The current ratio for the company was around 0.68
times in the year 2016, 0.94 times in the year 2017 and 0.60 times in the year 2018. The current
assets of the company is not sufficient which may affect the operations of the company. It is
necessary that the company should have a sufficient amount of current assets for the company.
Quick Ratio: The quick ratio for the company was calculated by taking the company net
liquidity position of the company and key current assets of the company such as the cash and
11FINANCE AND STRATEGIC DEVELOPMENT
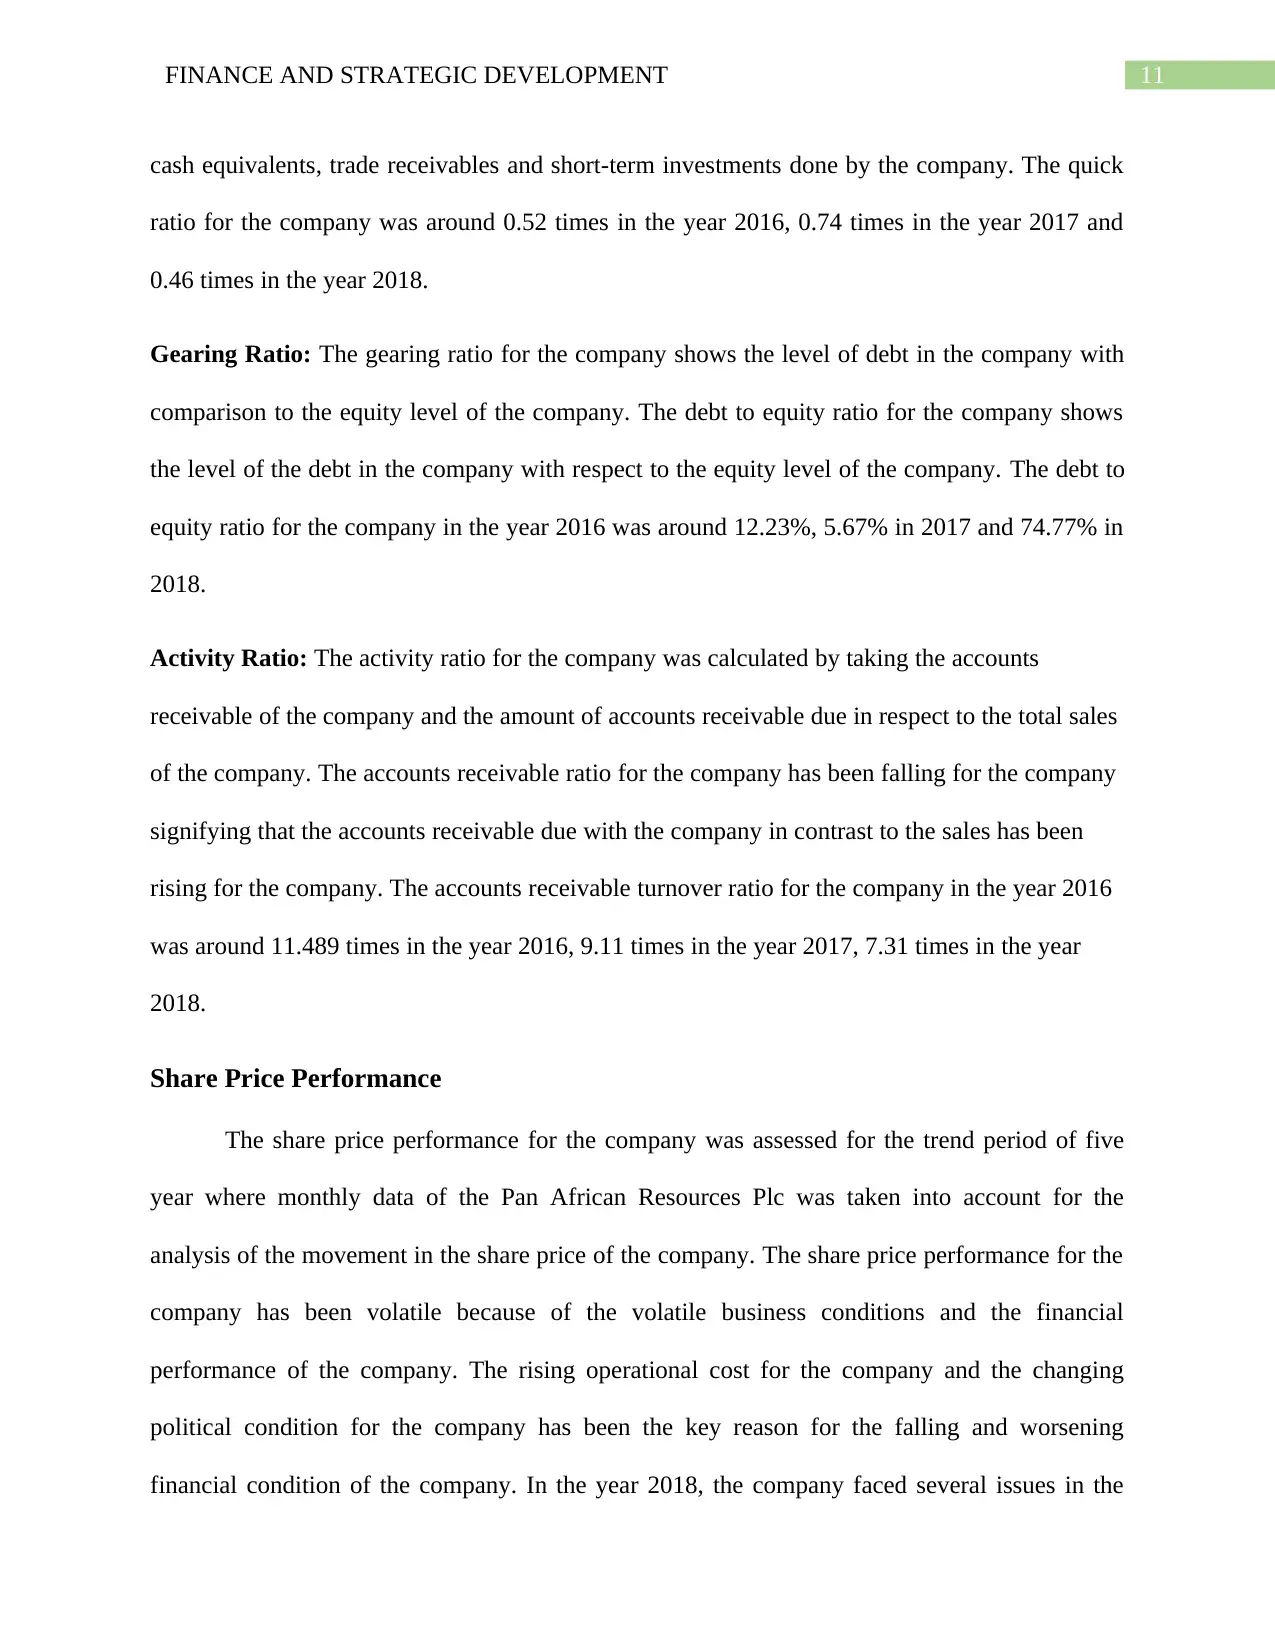
cash equivalents, trade receivables and short-term investments done by the company. The quick
ratio for the company was around 0.52 times in the year 2016, 0.74 times in the year 2017 and
0.46 times in the year 2018.
Gearing Ratio: The gearing ratio for the company shows the level of debt in the company with
comparison to the equity level of the company. The debt to equity ratio for the company shows
the level of the debt in the company with respect to the equity level of the company. The debt to
equity ratio for the company in the year 2016 was around 12.23%, 5.67% in 2017 and 74.77% in
2018.
Activity Ratio: The activity ratio for the company was calculated by taking the accounts
receivable of the company and the amount of accounts receivable due in respect to the total sales
of the company. The accounts receivable ratio for the company has been falling for the company
signifying that the accounts receivable due with the company in contrast to the sales has been
rising for the company. The accounts receivable turnover ratio for the company in the year 2016
was around 11.489 times in the year 2016, 9.11 times in the year 2017, 7.31 times in the year
2018.
Share Price Performance
The share price performance for the company was assessed for the trend period of five
year where monthly data of the Pan African Resources Plc was taken into account for the
analysis of the movement in the share price of the company. The share price performance for the
company has been volatile because of the volatile business conditions and the financial
performance of the company. The rising operational cost for the company and the changing
political condition for the company has been the key reason for the falling and worsening
financial condition of the company. In the year 2018, the company faced several issues in the
⊘ This is a preview!⊘
Do you want full access?
Subscribe today to unlock all pages.
Trusted by 1+ million students worldwide
1 out of 19
Related Documents


Your All-in-One AI-Powered Toolkit for Academic Success.
+13062052269
info@desklib.com
Available 24*7 on WhatsApp / Email
![[object Object]](/_next/static/media/star-bottom.7253800d.svg)
Unlock your academic potential
Copyright © 2020–2026 A2Z Services. All Rights Reserved. Developed and managed by ZUCOL.