Finance & Strategic Management: An Investor's View of Pan African PLC
VerifiedAdded on 2023/06/07
|17
|4258
|238
Report
AI Summary
This report provides a comprehensive financial analysis of Pan Africa Resources PLC for the fiscal years 2016 and 2017, adopting an investor's perspective. It evaluates the company's corporate governance, highlighting its compliance with UK Companies Act coding and commitment to integrity. The analysis covers capital investments in land, mineral rights, and exploration assets, alongside an examination of the company's sources of finance, including shareholders' equity and liabilities. Financial ratios, including profitability, efficiency, and short-term solvency ratios, are calculated and interpreted to assess the company's financial health. Furthermore, the report includes a share performance evaluation using technical analysis tools, offering insights into potential investment opportunities. The report concludes with recommendations based on the findings, aiming to guide investment decisions and improve the company's financial strategy.
Running head: FINANCE AND STRATEGIC MANAGEMENT
Finance and Strategic Management
Name of the Student:
Name of the University:
Authors Note:
Finance and Strategic Management
Name of the Student:
Name of the University:
Authors Note:
Paraphrase This Document
Need a fresh take? Get an instant paraphrase of this document with our AI Paraphraser
FINANCE AND STRATEGIC MANAGEMENT
1
Table of Contents
Introduction:...............................................................................................................................2
1. Corporate governance status and challenges:........................................................................2
2. Evaluating the company’s capital investment:.......................................................................3
3. Company’s sources of finance:..............................................................................................4
4. Financial ratios of the organisation:.......................................................................................5
5. Share performance of the organisation:...............................................................................11
Conclusion:..............................................................................................................................12
Recommendation:....................................................................................................................12
References and Bibliography:..................................................................................................14
FINANCE AND STRATEGIC MANAGEMENT
2
Introduction:
The overall assessment aims in detecting the current financial performance of Pan
Africa Resources PLC for the financial year of 2016 and 2017. The financial ratios have been
taken into consideration, which helps in depicting the level of progress that has been made by
the organisation over the fiscal years. In addition, the corporate governance status of the
company is also evaluated to understand the current operations that have been conducted by
the company over the period. Further evaluation has been conducted regarding the current
capital investments, which has been conducted by the organisation over the fiscal years.
Moreover, the source of Pan Africa Resources PLC is also evaluated, which has been used by
the management in smoothly conducting their operations. The share price performance and
evaluation is also conducted with the help of technical analysis tool such as moving averages,
which help in detecting the investment opportunity within Pan Africa Resources PLC.
1. Corporate governance status and challenges:
Pan Africa resources has a relatively been one of the compliant organization, which
utilizes the UK Companies Act coding and provide the listing of corporate governance
activity that has been conducted by the management over the financial years
(Panafricanresources.com, 2018). The business of the organization is relatively conducted
with integrity and in accordance with the highest standards that needs to be practiced by the
management. The practice that has been conducted by the management has relatively allowed
organization to increase the trust of the stakeholders. The management of the organization
practices the best principle based on the indication that it will support the company and uplift
its image in the eyes of the stakeholders. Management takes the help of non-executive
director, which bring in the experience that is needed by the organization to improve its
growth structure. Furthermore, the guidance published by The Institute of Chartered
⊘ This is a preview!⊘
Do you want full access?
Subscribe today to unlock all pages.
Trusted by 1+ million students worldwide
FINANCE AND STRATEGIC MANAGEMENT
3
Accountants in England and Wales has been used by the organization for their internal
control requirements. The organization has setup an adequate remuneration committee
comprising of non-executive directors, which relatively helps to determining the
remunerations of executive, and directors working for the interest of the shareholders. The
remuneration committee also decides the bonus payment and the grants that are provided to
the employees (Panafricanresources.com, 2018). The organization also has an Audit
committee, which takes responsibility for the financial performance, and evaluation that is
conducted on their current operations. The objective of the audit committee is to review the
financial report and the internal controls of the organization, which helps in depicting the
accurate financial position to their shareholders.
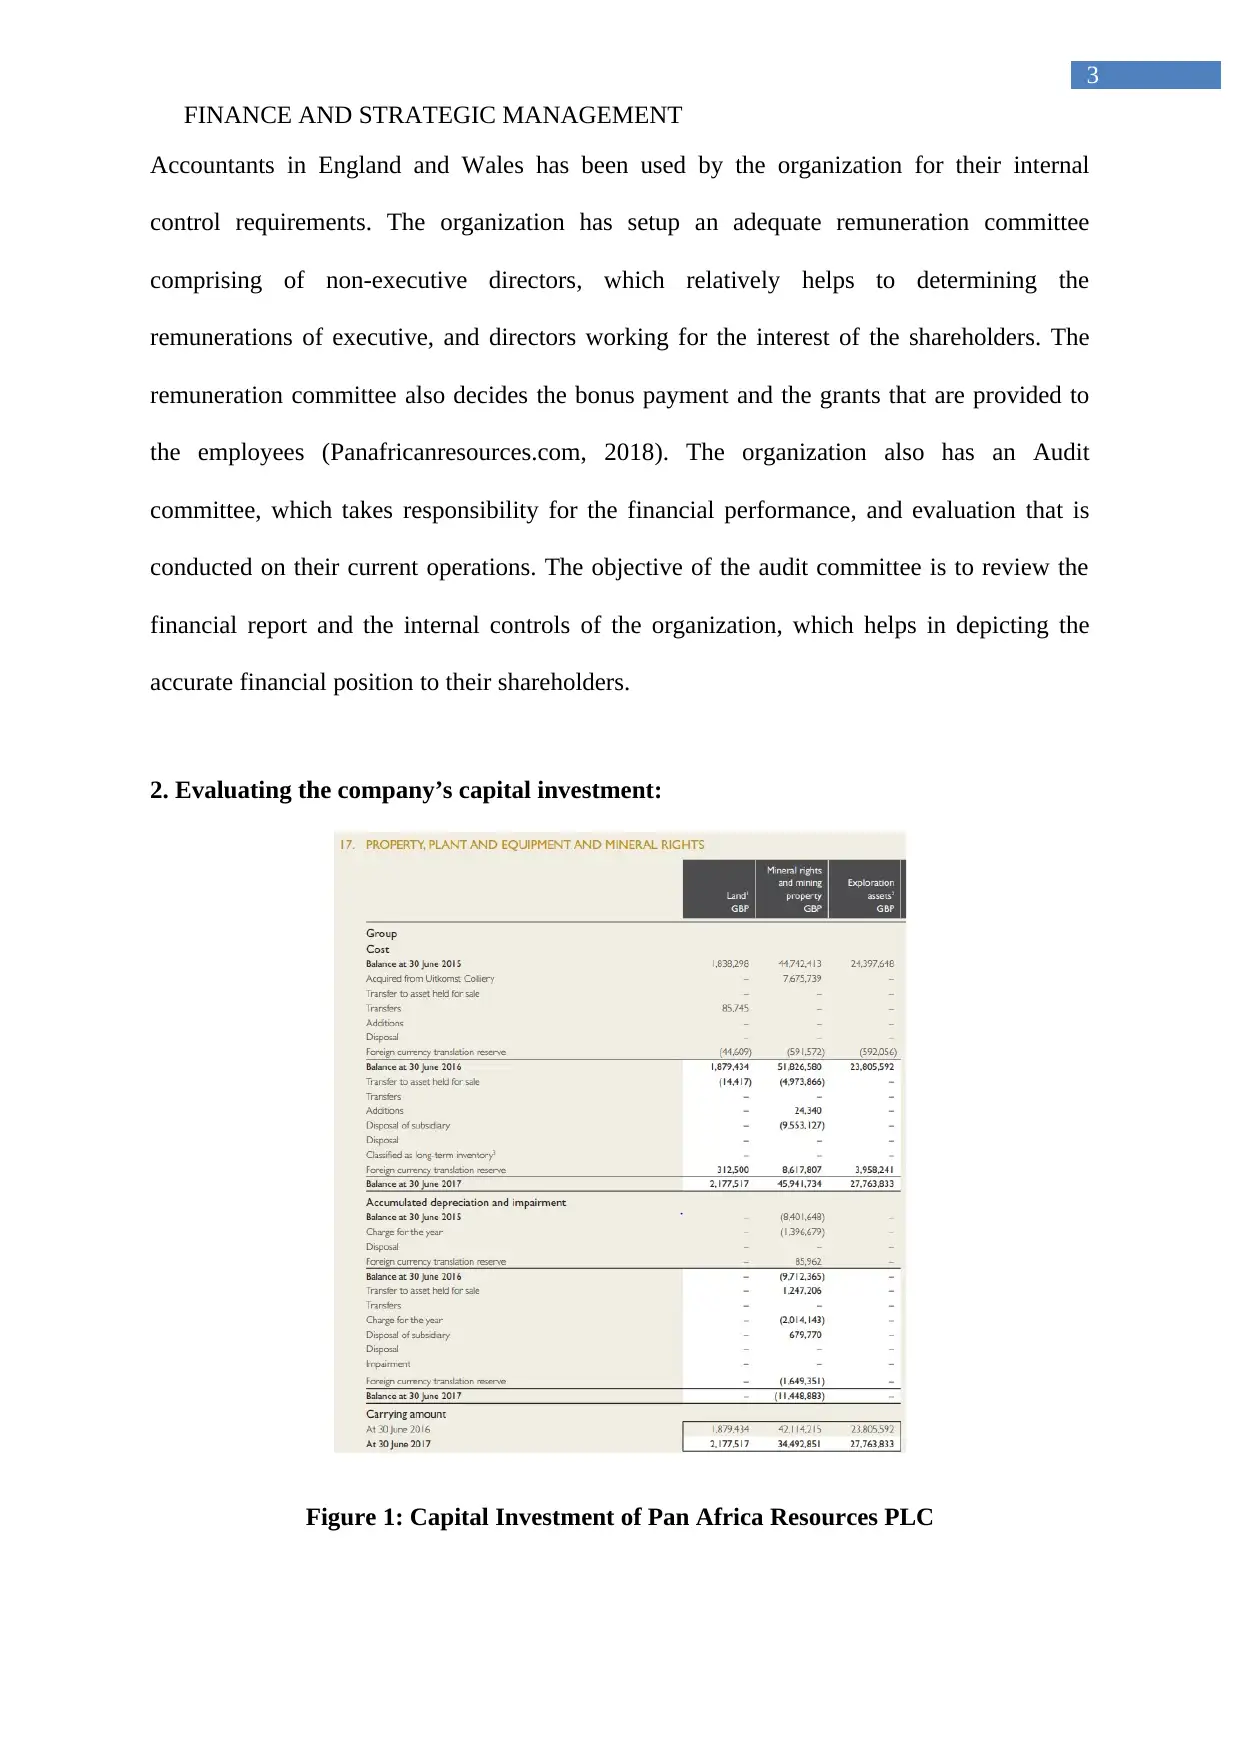
2. Evaluating the company’s capital investment:
Figure 1: Capital Investment of Pan Africa Resources PLC
3
Accountants in England and Wales has been used by the organization for their internal
control requirements. The organization has setup an adequate remuneration committee
comprising of non-executive directors, which relatively helps to determining the
remunerations of executive, and directors working for the interest of the shareholders. The
remuneration committee also decides the bonus payment and the grants that are provided to
the employees (Panafricanresources.com, 2018). The organization also has an Audit
committee, which takes responsibility for the financial performance, and evaluation that is
conducted on their current operations. The objective of the audit committee is to review the
financial report and the internal controls of the organization, which helps in depicting the
accurate financial position to their shareholders.
2. Evaluating the company’s capital investment:
Figure 1: Capital Investment of Pan Africa Resources PLC
Paraphrase This Document
Need a fresh take? Get an instant paraphrase of this document with our AI Paraphraser
FINANCE AND STRATEGIC MANAGEMENT
4
(Source: Panafricanresources.com, 2018)
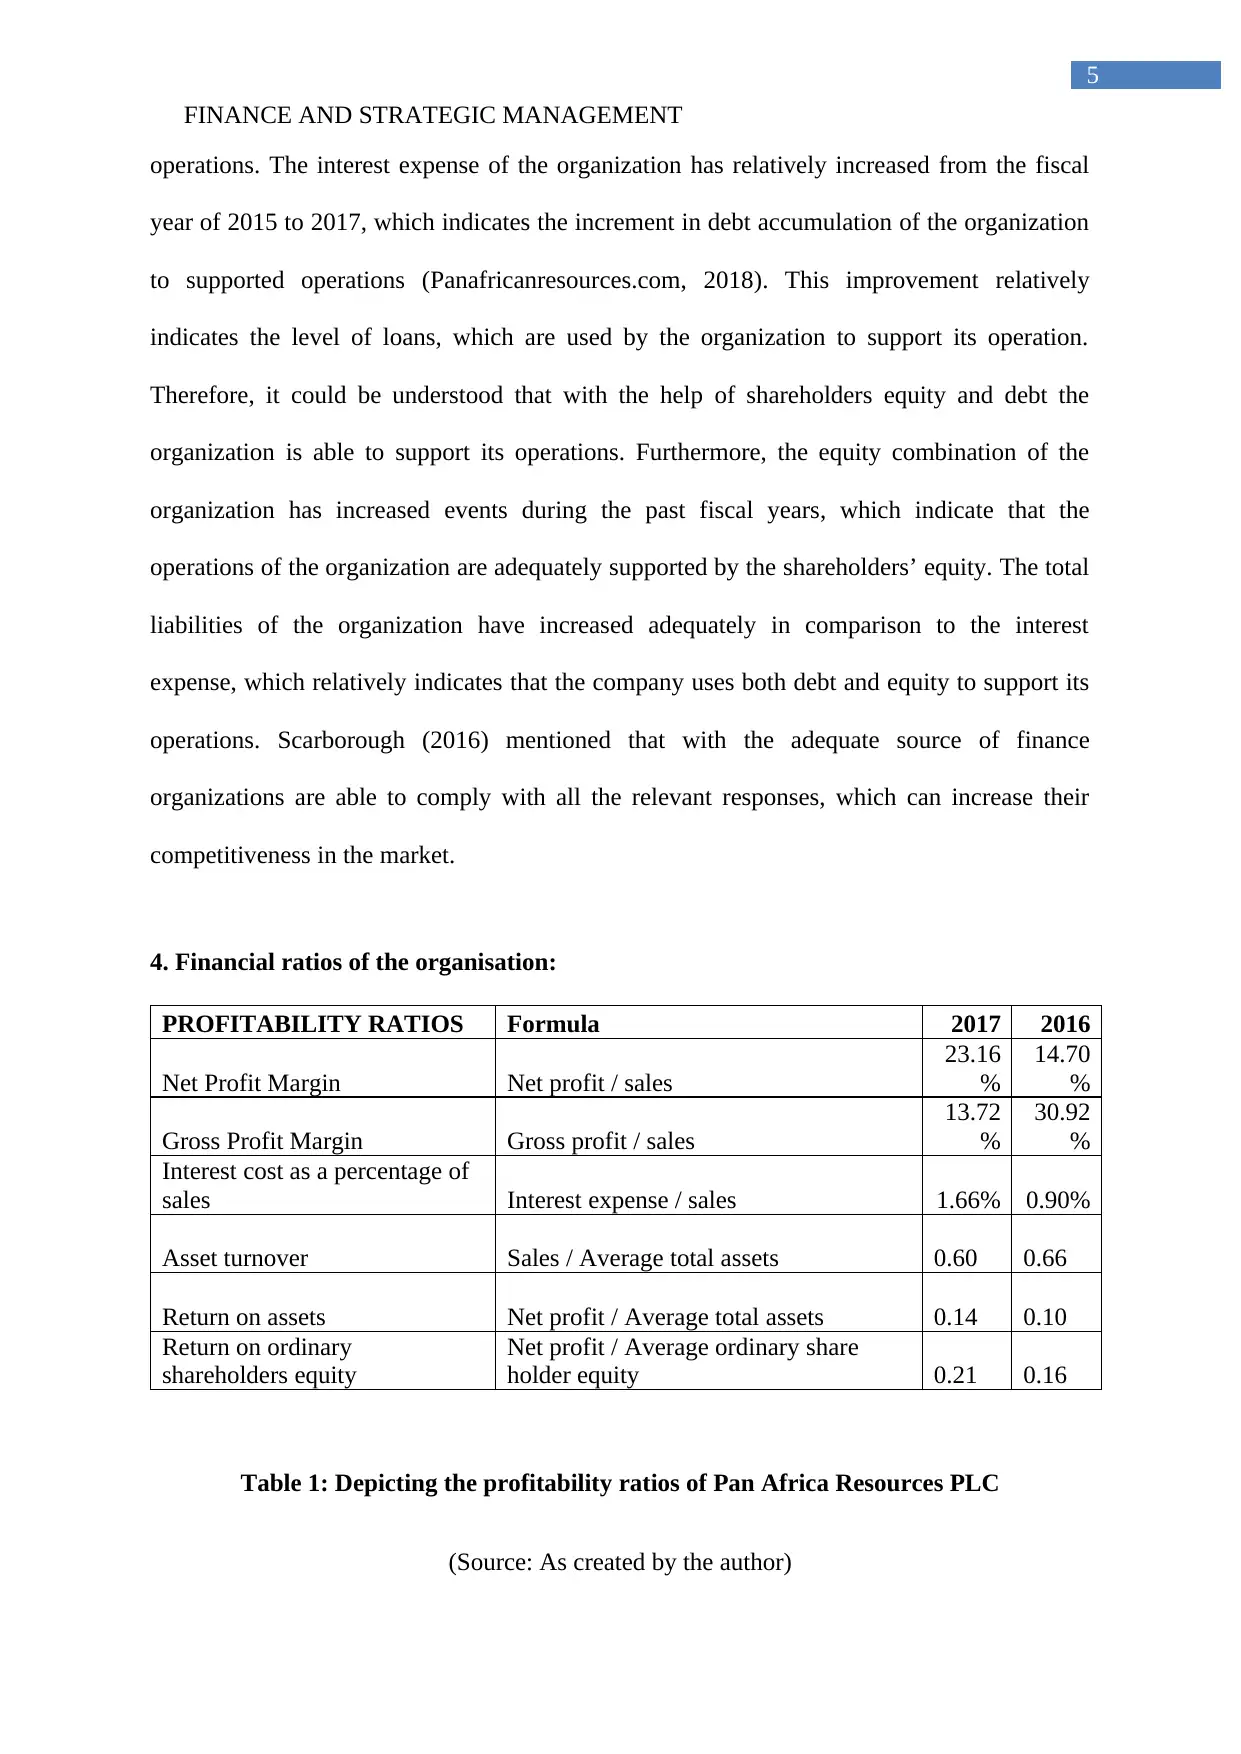
The above figure relatively indicates the capital investment, which has been
conducted by the organization during the fiscal year of 2017. The company has been
adequately conducting invest in land, mineral rights, mining property, and Exploration assets
for improving the current financial position and generating high revenues
(Panafricanresources.com, 2018). The above figure relatively provides a list of relevant
capital investments, which has been conducted by the organization over the fiscal years. The
company has been adequately acquired additional property, which can eventually in the
capital investment that has been conducted by the organization to secure its operational
capability. The acquisition of adequate companies has been conducted by your organization
for improving is mineral rights and mining property, which is essential for increasing their
production capability. Uechi et al., (2015) indicated that the level of improvements in the
current capital structure of the organization could be conducted for increasing their
performance in the long-run.
3. Company’s sources of finance:
Particulars 2017 2016 2015
Interest expense 2,815,223.00 1,448,248.00 2,458,287.00
Shareholders’
equity 216,581,075.00 150,975,202.00 147,167,487.00
Total liabilities 94,143,816.00 101,716,771.00 90,200,713.00
The above figure relatively indicates the sources of finance, which has been
conducted by the organization during the past fiscal years. The shareholders equity, total
liabilities, and interest expense of the organization is relatively depicted in the above table.
The combination of the above finances has allowed the organization to continue its
4
(Source: Panafricanresources.com, 2018)
The above figure relatively indicates the capital investment, which has been
conducted by the organization during the fiscal year of 2017. The company has been
adequately conducting invest in land, mineral rights, mining property, and Exploration assets
for improving the current financial position and generating high revenues
(Panafricanresources.com, 2018). The above figure relatively provides a list of relevant
capital investments, which has been conducted by the organization over the fiscal years. The
company has been adequately acquired additional property, which can eventually in the
capital investment that has been conducted by the organization to secure its operational
capability. The acquisition of adequate companies has been conducted by your organization
for improving is mineral rights and mining property, which is essential for increasing their
production capability. Uechi et al., (2015) indicated that the level of improvements in the
current capital structure of the organization could be conducted for increasing their
performance in the long-run.
3. Company’s sources of finance:
Particulars 2017 2016 2015
Interest expense 2,815,223.00 1,448,248.00 2,458,287.00
Shareholders’
equity 216,581,075.00 150,975,202.00 147,167,487.00
Total liabilities 94,143,816.00 101,716,771.00 90,200,713.00
The above figure relatively indicates the sources of finance, which has been
conducted by the organization during the past fiscal years. The shareholders equity, total
liabilities, and interest expense of the organization is relatively depicted in the above table.
The combination of the above finances has allowed the organization to continue its
FINANCE AND STRATEGIC MANAGEMENT
5
operations. The interest expense of the organization has relatively increased from the fiscal
year of 2015 to 2017, which indicates the increment in debt accumulation of the organization
to supported operations (Panafricanresources.com, 2018). This improvement relatively
indicates the level of loans, which are used by the organization to support its operation.
Therefore, it could be understood that with the help of shareholders equity and debt the
organization is able to support its operations. Furthermore, the equity combination of the
organization has increased events during the past fiscal years, which indicate that the
operations of the organization are adequately supported by the shareholders’ equity. The total
liabilities of the organization have increased adequately in comparison to the interest
expense, which relatively indicates that the company uses both debt and equity to support its
operations. Scarborough (2016) mentioned that with the adequate source of finance
organizations are able to comply with all the relevant responses, which can increase their
competitiveness in the market.
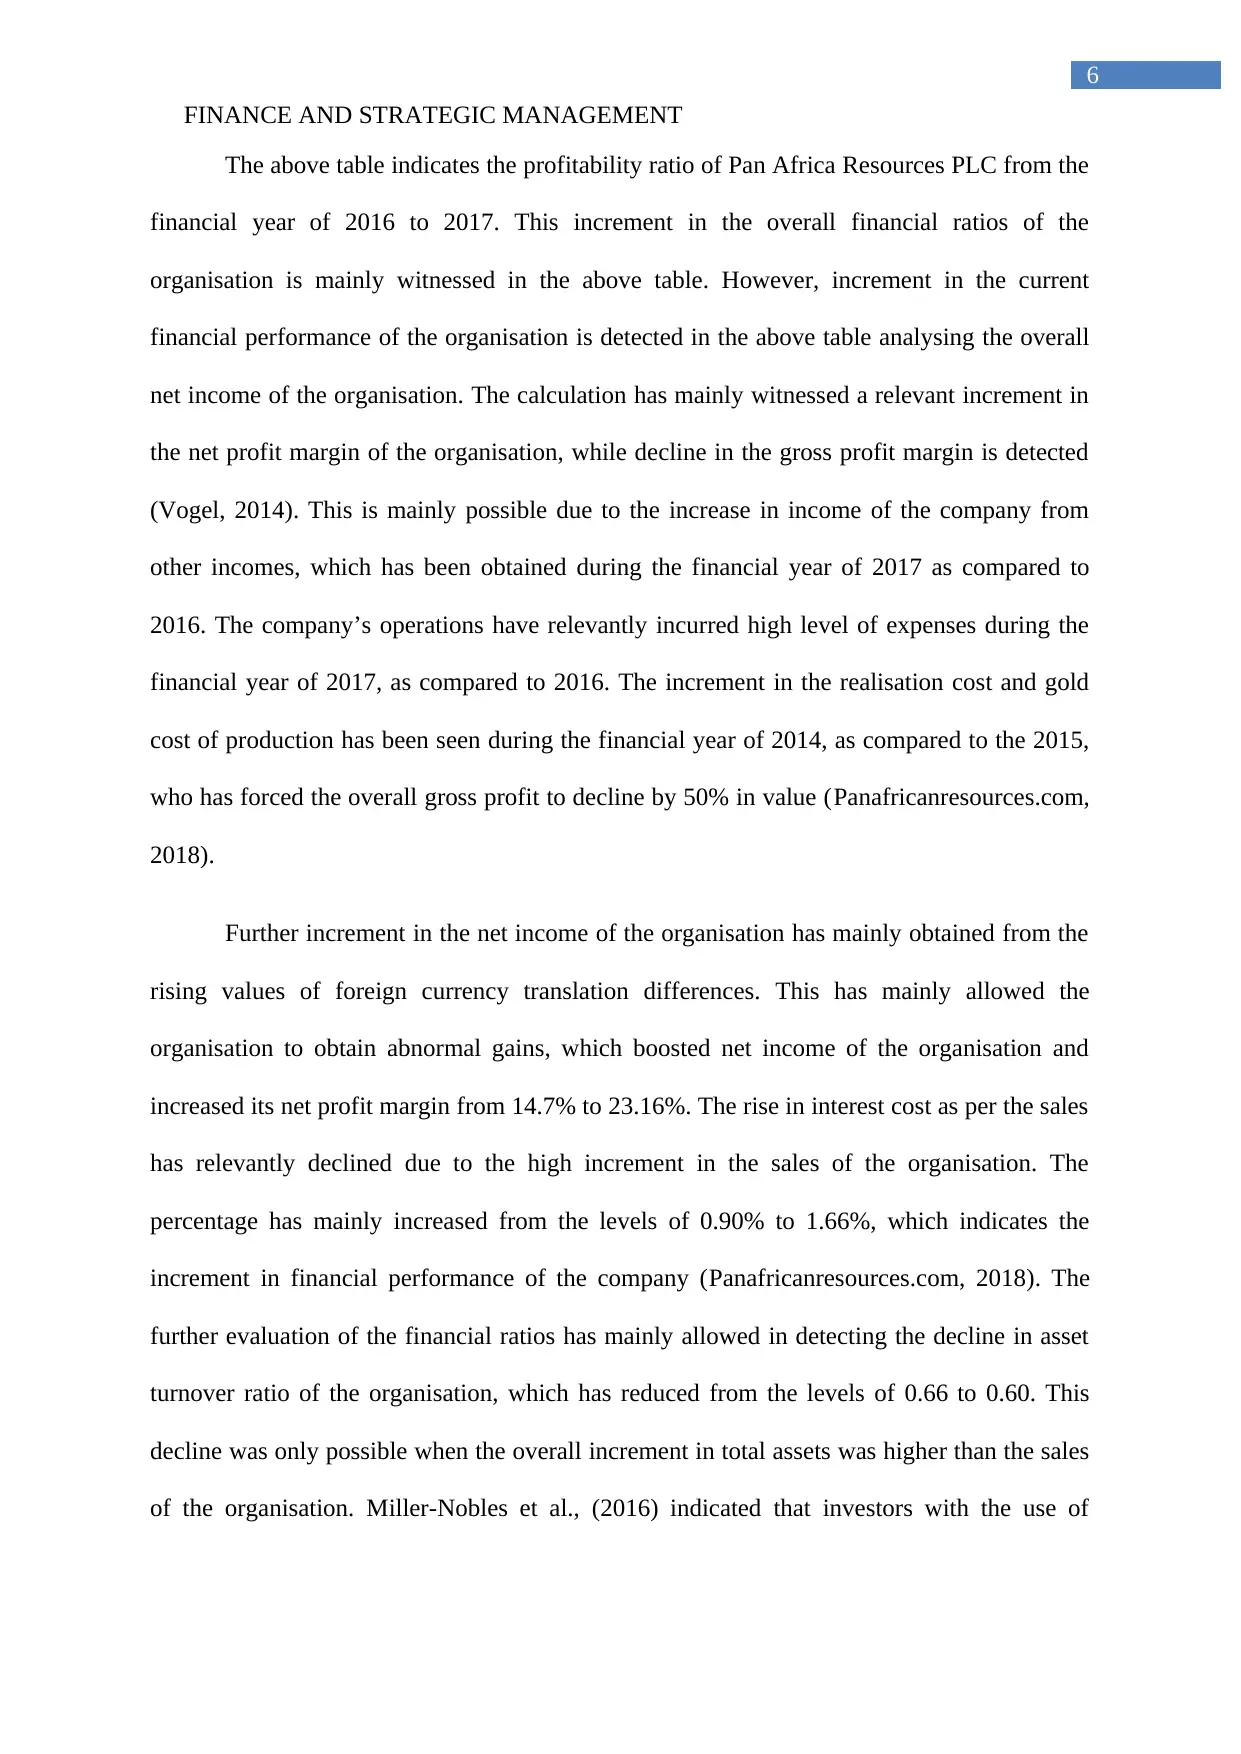
4. Financial ratios of the organisation:
PROFITABILITY RATIOS Formula 2017 2016
Net Profit Margin Net profit / sales
23.16
%
14.70
%
Gross Profit Margin Gross profit / sales
13.72
%
30.92
%
Interest cost as a percentage of
sales Interest expense / sales 1.66% 0.90%
Asset turnover Sales / Average total assets 0.60 0.66
Return on assets Net profit / Average total assets 0.14 0.10
Return on ordinary
shareholders equity
Net profit / Average ordinary share
holder equity 0.21 0.16
Table 1: Depicting the profitability ratios of Pan Africa Resources PLC
(Source: As created by the author)
5
operations. The interest expense of the organization has relatively increased from the fiscal
year of 2015 to 2017, which indicates the increment in debt accumulation of the organization
to supported operations (Panafricanresources.com, 2018). This improvement relatively
indicates the level of loans, which are used by the organization to support its operation.
Therefore, it could be understood that with the help of shareholders equity and debt the
organization is able to support its operations. Furthermore, the equity combination of the
organization has increased events during the past fiscal years, which indicate that the
operations of the organization are adequately supported by the shareholders’ equity. The total
liabilities of the organization have increased adequately in comparison to the interest
expense, which relatively indicates that the company uses both debt and equity to support its
operations. Scarborough (2016) mentioned that with the adequate source of finance
organizations are able to comply with all the relevant responses, which can increase their
competitiveness in the market.
4. Financial ratios of the organisation:
PROFITABILITY RATIOS Formula 2017 2016
Net Profit Margin Net profit / sales
23.16
%
14.70
%
Gross Profit Margin Gross profit / sales
13.72
%
30.92
%
Interest cost as a percentage of
sales Interest expense / sales 1.66% 0.90%
Asset turnover Sales / Average total assets 0.60 0.66
Return on assets Net profit / Average total assets 0.14 0.10
Return on ordinary
shareholders equity
Net profit / Average ordinary share
holder equity 0.21 0.16
Table 1: Depicting the profitability ratios of Pan Africa Resources PLC
(Source: As created by the author)
⊘ This is a preview!⊘
Do you want full access?
Subscribe today to unlock all pages.
Trusted by 1+ million students worldwide
FINANCE AND STRATEGIC MANAGEMENT
6
The above table indicates the profitability ratio of Pan Africa Resources PLC from the
financial year of 2016 to 2017. This increment in the overall financial ratios of the
organisation is mainly witnessed in the above table. However, increment in the current
financial performance of the organisation is detected in the above table analysing the overall
net income of the organisation. The calculation has mainly witnessed a relevant increment in
the net profit margin of the organisation, while decline in the gross profit margin is detected
(Vogel, 2014). This is mainly possible due to the increase in income of the company from
other incomes, which has been obtained during the financial year of 2017 as compared to
2016. The company’s operations have relevantly incurred high level of expenses during the
financial year of 2017, as compared to 2016. The increment in the realisation cost and gold
cost of production has been seen during the financial year of 2014, as compared to the 2015,
who has forced the overall gross profit to decline by 50% in value (Panafricanresources.com,
2018).
Further increment in the net income of the organisation has mainly obtained from the
rising values of foreign currency translation differences. This has mainly allowed the
organisation to obtain abnormal gains, which boosted net income of the organisation and
increased its net profit margin from 14.7% to 23.16%. The rise in interest cost as per the sales
has relevantly declined due to the high increment in the sales of the organisation. The
percentage has mainly increased from the levels of 0.90% to 1.66%, which indicates the
increment in financial performance of the company (Panafricanresources.com, 2018). The
further evaluation of the financial ratios has mainly allowed in detecting the decline in asset
turnover ratio of the organisation, which has reduced from the levels of 0.66 to 0.60. This
decline was only possible when the overall increment in total assets was higher than the sales
of the organisation. Miller-Nobles et al., (2016) indicated that investors with the use of
Paraphrase This Document
Need a fresh take? Get an instant paraphrase of this document with our AI Paraphraser
FINANCE AND STRATEGIC MANAGEMENT
7
financial ratios are able to detect the accurate financial position of the organisation and make
adequate investment decision on the data.
The financial performance of the organisation is further evaluated from the return on
assets and return on equity of Pan Africa Resources PLC from 2016 to 2017. The increment
in the financial performance of the organisation is mainly detected from the rising values of
return on assets from 0.10 in 2016 to 2014 in 2017. This increment in return is mainly
achieved due to the rising net income of the company, which has been achieved during the
financial year of 2017. The further increment in the return on equity is witnessed, where the
values have increased from the levels of 0.16 in 2016 to 0.21 in 2017
(Panafricanresources.com, 2018). This increment is mainly conducted due to the rising levels
of net income, which has been generated by the company over the period. Almamy, Aston &
Ngwa (2016) argued that the financial ratios mainly lose its friction, as it does not allow
investor in detecting the accurate level of growth, which can be achieved in near future.
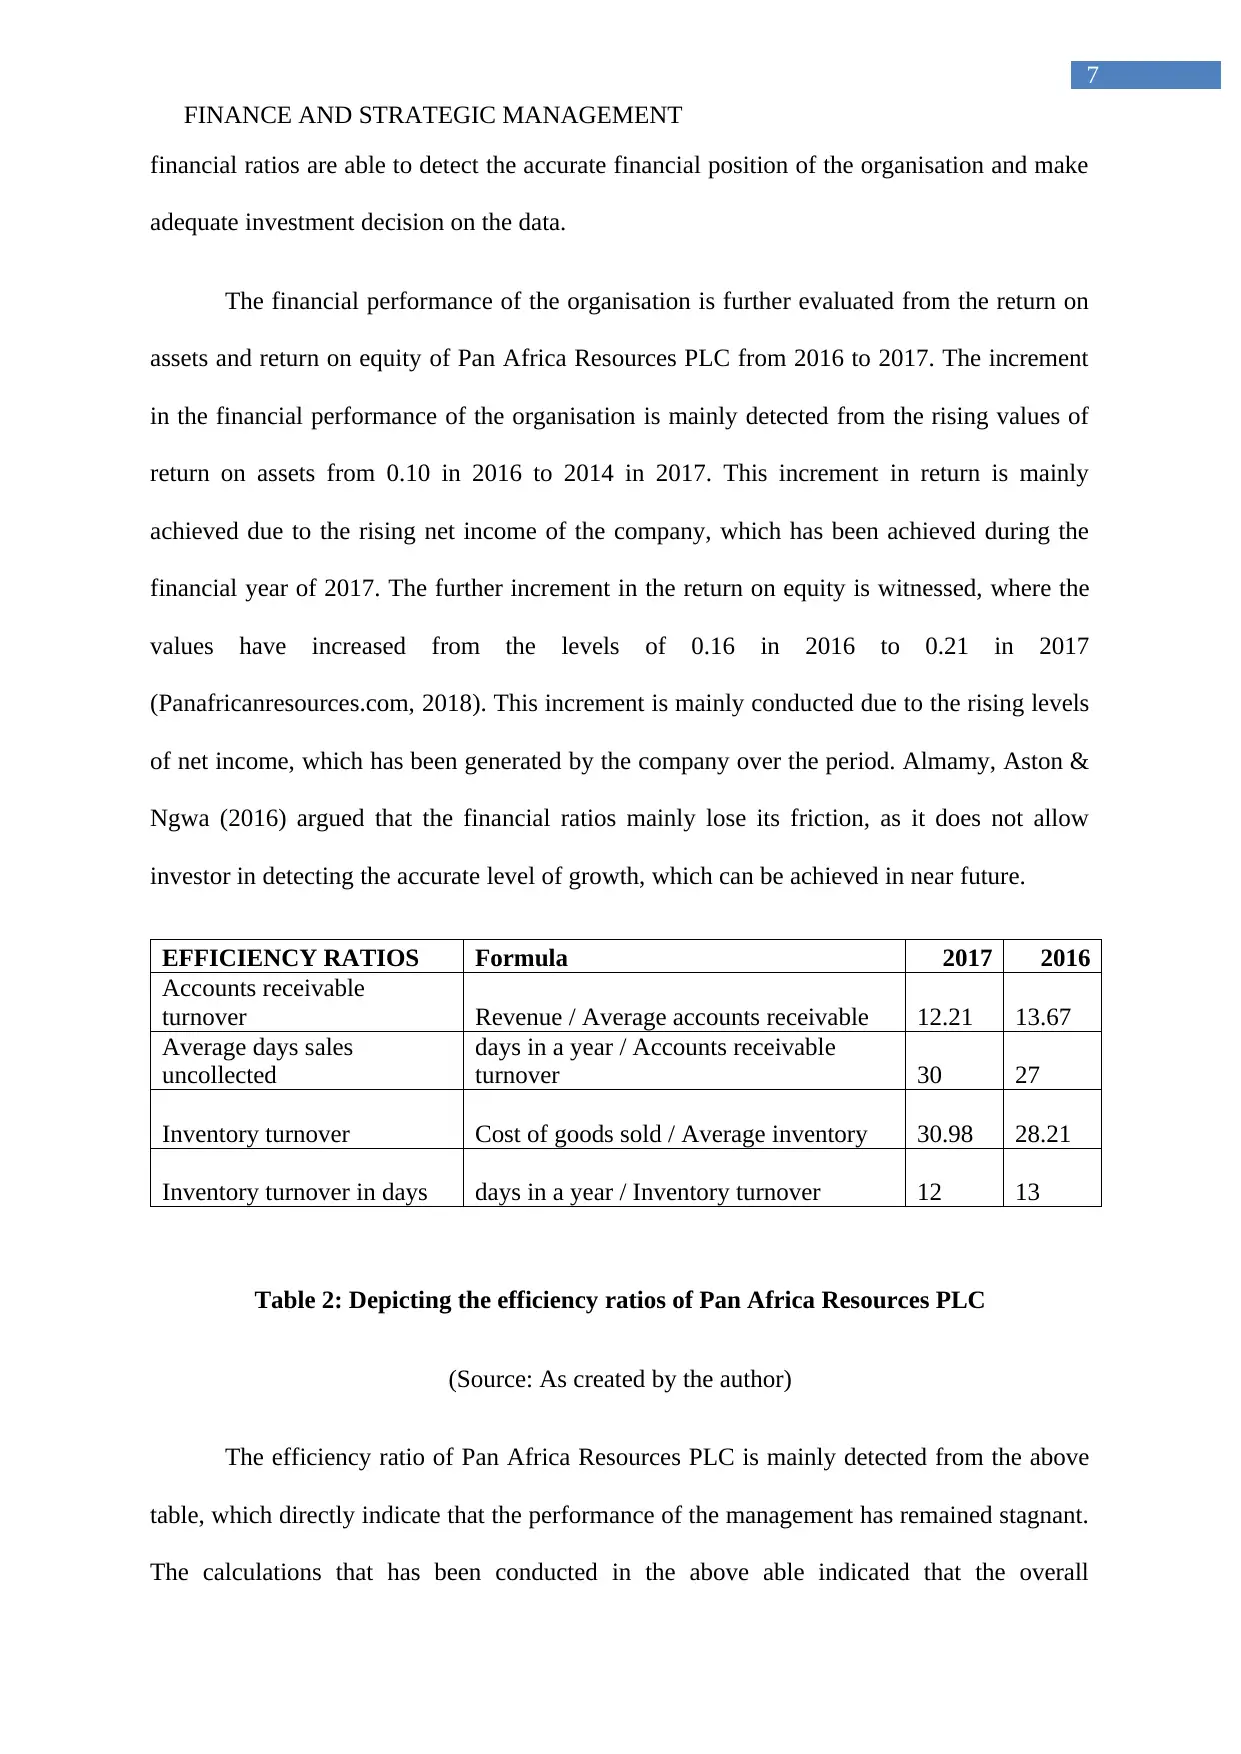
EFFICIENCY RATIOS Formula 2017 2016
Accounts receivable
turnover Revenue / Average accounts receivable 12.21 13.67
Average days sales
uncollected
days in a year / Accounts receivable
turnover 30 27
Inventory turnover Cost of goods sold / Average inventory 30.98 28.21
Inventory turnover in days days in a year / Inventory turnover 12 13
Table 2: Depicting the efficiency ratios of Pan Africa Resources PLC
(Source: As created by the author)
The efficiency ratio of Pan Africa Resources PLC is mainly detected from the above
table, which directly indicate that the performance of the management has remained stagnant.
The calculations that has been conducted in the above able indicated that the overall
7
financial ratios are able to detect the accurate financial position of the organisation and make
adequate investment decision on the data.
The financial performance of the organisation is further evaluated from the return on
assets and return on equity of Pan Africa Resources PLC from 2016 to 2017. The increment
in the financial performance of the organisation is mainly detected from the rising values of
return on assets from 0.10 in 2016 to 2014 in 2017. This increment in return is mainly
achieved due to the rising net income of the company, which has been achieved during the
financial year of 2017. The further increment in the return on equity is witnessed, where the
values have increased from the levels of 0.16 in 2016 to 0.21 in 2017
(Panafricanresources.com, 2018). This increment is mainly conducted due to the rising levels
of net income, which has been generated by the company over the period. Almamy, Aston &
Ngwa (2016) argued that the financial ratios mainly lose its friction, as it does not allow
investor in detecting the accurate level of growth, which can be achieved in near future.
EFFICIENCY RATIOS Formula 2017 2016
Accounts receivable
turnover Revenue / Average accounts receivable 12.21 13.67
Average days sales
uncollected
days in a year / Accounts receivable
turnover 30 27
Inventory turnover Cost of goods sold / Average inventory 30.98 28.21
Inventory turnover in days days in a year / Inventory turnover 12 13
Table 2: Depicting the efficiency ratios of Pan Africa Resources PLC
(Source: As created by the author)
The efficiency ratio of Pan Africa Resources PLC is mainly detected from the above
table, which directly indicate that the performance of the management has remained stagnant.
The calculations that has been conducted in the above able indicated that the overall
FINANCE AND STRATEGIC MANAGEMENT
8
performance of the company has increased and decreased at the same time. This mainly
detected from the rising value of inventory turnover ratio and declining values of accounts
receivable turnover. Enekwe (2015) mentioned that with the efficiency ratio investors are
able to detect the management performance in making adequate decision for increasing
growth of the organisation in future. The overall values of accounts receivables has mainly
declined from the level of 13.67 in 2016 to 12.21 in 2017, which has directly indicted the low
efficiency of the organisation in acquiring the required level of payments from its creditors
(Panafricanresources.com, 2018). This decline in accounts receivable value has mainly
increased the average day’s sales uncollected from 27 days to 30 days.
The efficiency ratio that has been calculated in the above table is the inventory
turnover ratio, which is a relatively improved over the fiscal year. The values have relatively
increased from the levels of 28.21 in 2016 to 30.98 in 2017. This increment has relatively
depicted the efficiency of the management in clearing of the inventory that has been produced
over the period of one year. This improvement in the inventory turnover ratio as a relatively
decline the inventory turnover in days from 13 days in 2016 to 12 days in 2017
(Panafricanresources.com, 2018). This is a major achievement by the management, where
control over the blockage in the inventory system has been conducted by an organization.
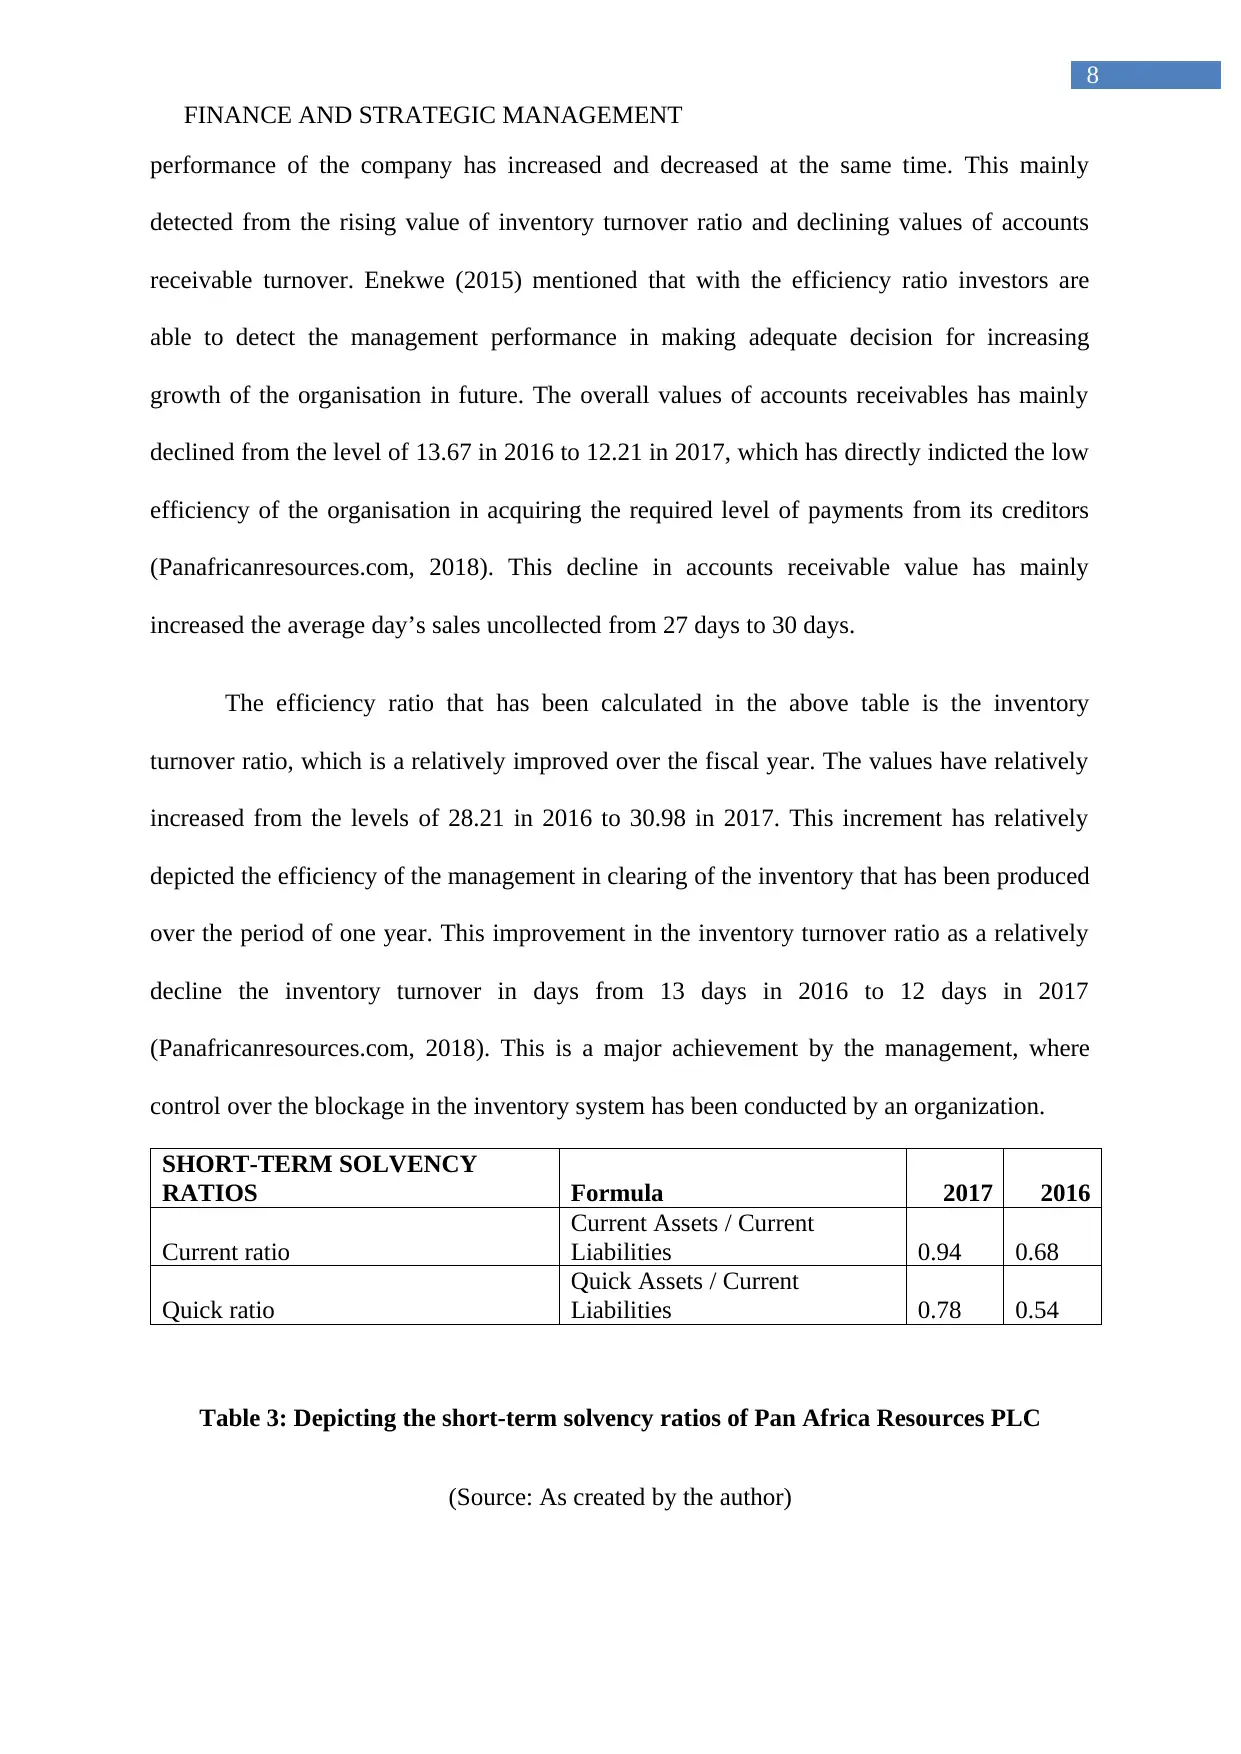
SHORT-TERM SOLVENCY
RATIOS Formula 2017 2016
Current ratio
Current Assets / Current
Liabilities 0.94 0.68
Quick ratio
Quick Assets / Current
Liabilities 0.78 0.54
Table 3: Depicting the short-term solvency ratios of Pan Africa Resources PLC
(Source: As created by the author)
8
performance of the company has increased and decreased at the same time. This mainly
detected from the rising value of inventory turnover ratio and declining values of accounts
receivable turnover. Enekwe (2015) mentioned that with the efficiency ratio investors are
able to detect the management performance in making adequate decision for increasing
growth of the organisation in future. The overall values of accounts receivables has mainly
declined from the level of 13.67 in 2016 to 12.21 in 2017, which has directly indicted the low
efficiency of the organisation in acquiring the required level of payments from its creditors
(Panafricanresources.com, 2018). This decline in accounts receivable value has mainly
increased the average day’s sales uncollected from 27 days to 30 days.
The efficiency ratio that has been calculated in the above table is the inventory
turnover ratio, which is a relatively improved over the fiscal year. The values have relatively
increased from the levels of 28.21 in 2016 to 30.98 in 2017. This increment has relatively
depicted the efficiency of the management in clearing of the inventory that has been produced
over the period of one year. This improvement in the inventory turnover ratio as a relatively
decline the inventory turnover in days from 13 days in 2016 to 12 days in 2017
(Panafricanresources.com, 2018). This is a major achievement by the management, where
control over the blockage in the inventory system has been conducted by an organization.
SHORT-TERM SOLVENCY
RATIOS Formula 2017 2016
Current ratio
Current Assets / Current
Liabilities 0.94 0.68
Quick ratio
Quick Assets / Current
Liabilities 0.78 0.54
Table 3: Depicting the short-term solvency ratios of Pan Africa Resources PLC
(Source: As created by the author)
⊘ This is a preview!⊘
Do you want full access?
Subscribe today to unlock all pages.
Trusted by 1+ million students worldwide
FINANCE AND STRATEGIC MANAGEMENT
9
The short-term solvency ratio has been relatively conducted in the above table, which
directly evaluates the financial performance of the organization during the past two fiscal
years. The short-term solvency condition of the organization has a relatively improved, as
both the current ratio and quick ratio values has increased from previous fiscal year. The
improvements in the value of short-term solvency position have increased due to the rise in
the current assets of the organization, while current liabilities declined during the period of
one fiscal year (Panafricanresources.com, 2018). This improvement has mainly allowed the
organization to support its short-term obligations and reduce the chance of closing down the
business after paying its short-term debts. The difference between the quick and current ratio
inclined from 2016 to 2017, which indicates the high level of inventory that has been
accumulated by the organization for supporting its operations. Zainudin & Hashim (2016)
argued that investors using the short-term solvency ratios does not gauge into the future
operational capability of the organization, as it only indicates the current position.
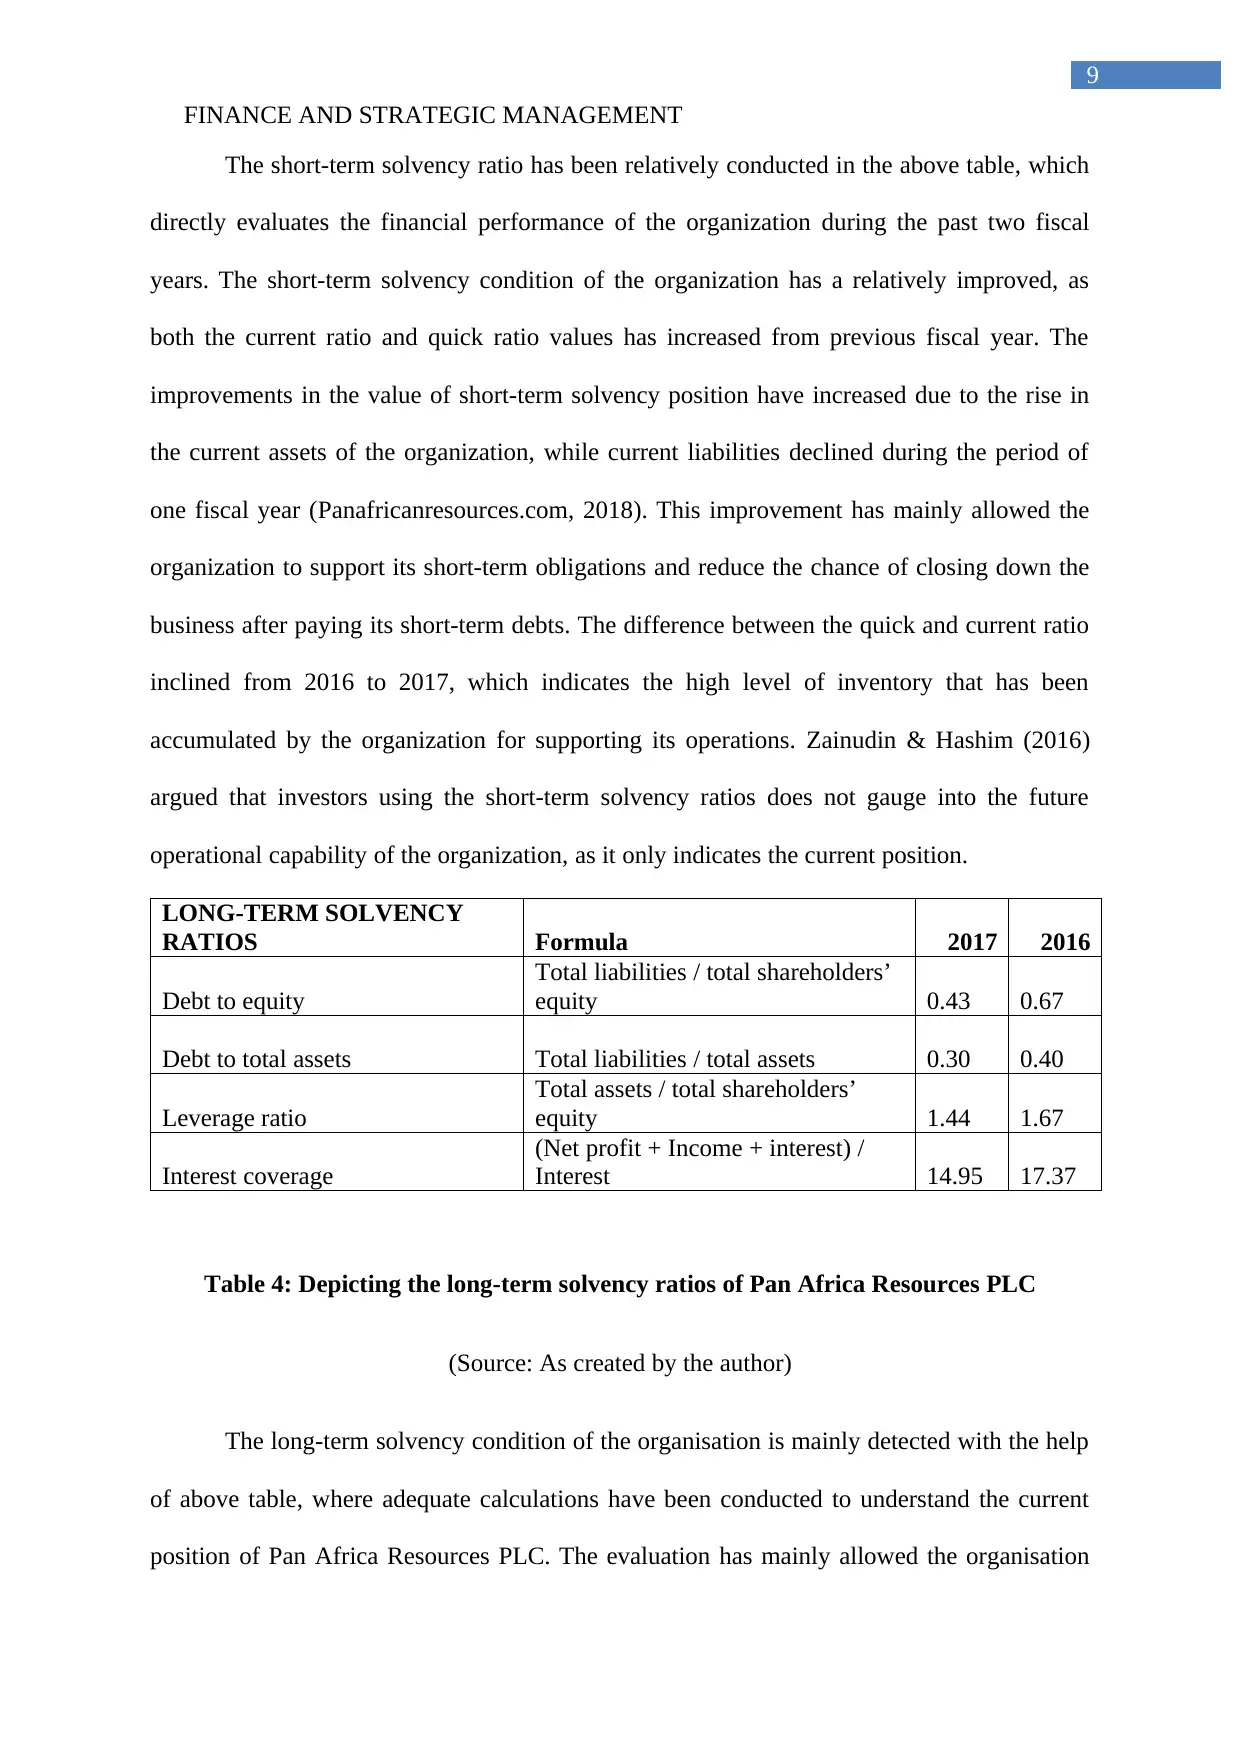
LONG-TERM SOLVENCY
RATIOS Formula 2017 2016
Debt to equity
Total liabilities / total shareholders’
equity 0.43 0.67
Debt to total assets Total liabilities / total assets 0.30 0.40
Leverage ratio
Total assets / total shareholders’
equity 1.44 1.67
Interest coverage
(Net profit + Income + interest) /
Interest 14.95 17.37
Table 4: Depicting the long-term solvency ratios of Pan Africa Resources PLC
(Source: As created by the author)
The long-term solvency condition of the organisation is mainly detected with the help
of above table, where adequate calculations have been conducted to understand the current
position of Pan Africa Resources PLC. The evaluation has mainly allowed the organisation
9
The short-term solvency ratio has been relatively conducted in the above table, which
directly evaluates the financial performance of the organization during the past two fiscal
years. The short-term solvency condition of the organization has a relatively improved, as
both the current ratio and quick ratio values has increased from previous fiscal year. The
improvements in the value of short-term solvency position have increased due to the rise in
the current assets of the organization, while current liabilities declined during the period of
one fiscal year (Panafricanresources.com, 2018). This improvement has mainly allowed the
organization to support its short-term obligations and reduce the chance of closing down the
business after paying its short-term debts. The difference between the quick and current ratio
inclined from 2016 to 2017, which indicates the high level of inventory that has been
accumulated by the organization for supporting its operations. Zainudin & Hashim (2016)
argued that investors using the short-term solvency ratios does not gauge into the future
operational capability of the organization, as it only indicates the current position.
LONG-TERM SOLVENCY
RATIOS Formula 2017 2016
Debt to equity
Total liabilities / total shareholders’
equity 0.43 0.67
Debt to total assets Total liabilities / total assets 0.30 0.40
Leverage ratio
Total assets / total shareholders’
equity 1.44 1.67
Interest coverage
(Net profit + Income + interest) /
Interest 14.95 17.37
Table 4: Depicting the long-term solvency ratios of Pan Africa Resources PLC
(Source: As created by the author)
The long-term solvency condition of the organisation is mainly detected with the help
of above table, where adequate calculations have been conducted to understand the current
position of Pan Africa Resources PLC. The evaluation has mainly allowed the organisation
Paraphrase This Document
Need a fresh take? Get an instant paraphrase of this document with our AI Paraphraser
FINANCE AND STRATEGIC MANAGEMENT
10
for indicating the level of progress, which has been made by the company for generating high
level of income from investment. The calculation of debt to equity has mainly declined from
the levels of 0.67 in 2016 to 0.43 in 2017, due to the drastic increment in equity capital and
decline in total liabilities of the firm. This decline has mainly allowed the organisation to
reduce the chances of insolvency, which might occur due to the excessive accumulation of
high interest debt. The improvement in the solvency position of the organisation can also be
detected from the debt to total assets of the organisation, which has declined from the levels
of 0.40 in 2016 to 0.30 in 2017 (Panafricanresources.com, 2018). The reduction in debt
accumulation of the organisation has extended to the demise in total asset purchase from the
debt capital. This is mainly securing the organisations overall capability to improve its
growth prospects and reduce the occurrence of insolvency in future.
The leverage ratio of the company has also been calculated, which indicates a decline
in the values, as the company has not being expensively using debt to support its asset
purchases. The leverage values has declined from 1.67 in 2016 to 1.44 in 2017, which
indicates that the accumulation of equity is relevantly higher than the purchase of assets
conducted by Pan Africa Resources PLC. In addition, the decline in interest coverage ratio
has been calculated from the levels of 17.37 in 2016 to 14.95 in 2017, which indicates that
the company’s high debt has been eroding their profits (Panafricanresources.com, 2018).
Therefore, the increment in equity position has mainly allowed the organisation to strengthen
its activities and reduce the lingering problems of debt. However, no further debt needs to be
accumulated by the company, as it will raises the level of interest payments, which is already
eroding profits of the organisation (Greco, Figueira & Ehrgott, 2016).
FINANCE AND STRATEGIC MANAGEMENT
11
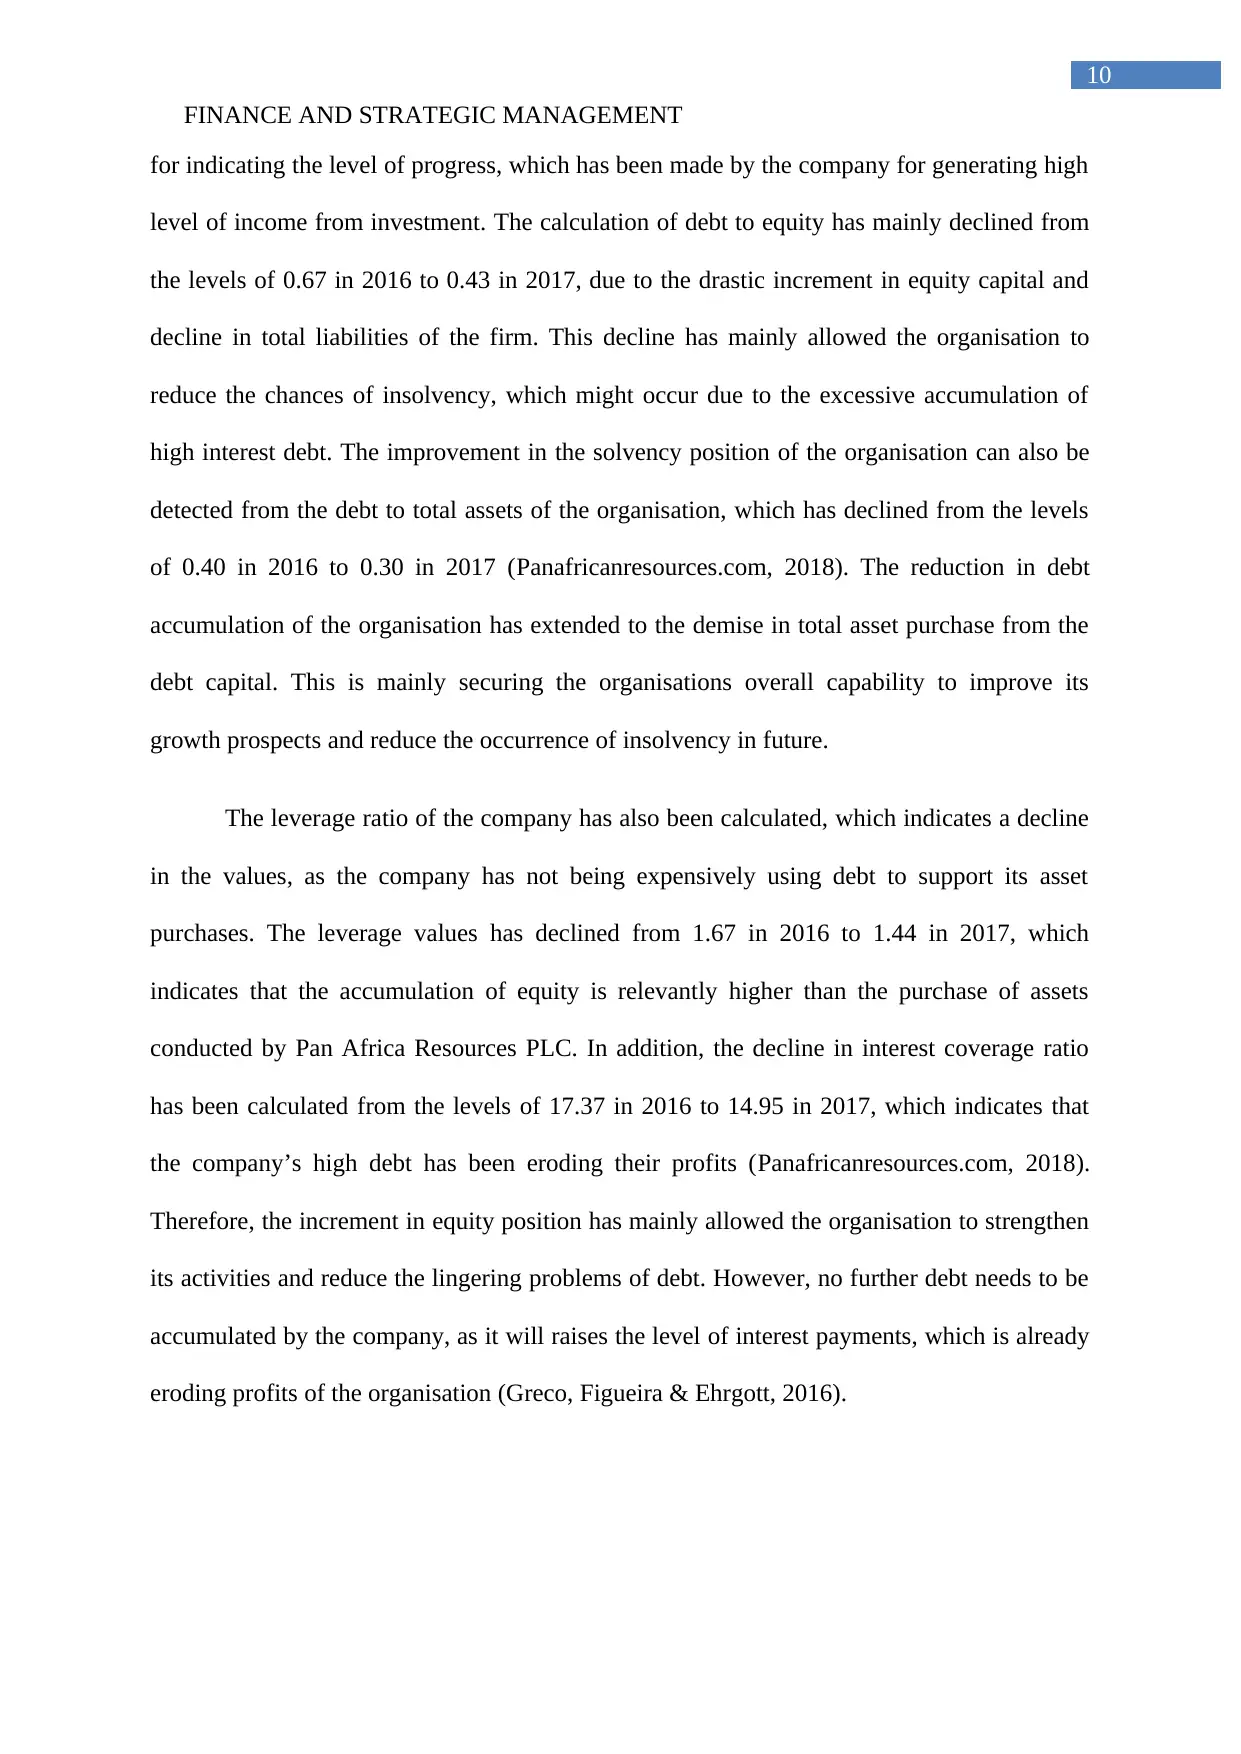
5. Share performance of the organisation:
Figure 2: Share price performance of Pan Africa Resources PLC
(Source: Uk.finance.yahoo.com, 2018)
The above figure mainly helps in depicting the level of share price, which Pan Africa
Resources PLC has accumulated over the period of five-fiscal year. The share price
movement is relevantly evaluated with the help of moving averages, which has been used for
detecting the investment opportunity present without the price movement of Pan Africa
Resources PLC. Moreover, drastic alteration in the current share price of Pan Africa
Resources PLC is witnessed during the previous five fiscal years. The share values of the
organisation have mainly increased from the levels of 6.30 to the height of 24.50, which
indicates a wide price range that has been witnessed by Pan Africa Resources PLC. The share
price of the organisation mainly started to rise from July 2015 until the end of July 2016, after
which the overall share price started to decline again. This decline in the overall share price
has mainly indicated during the fiscal year of 2017 until date.
The share price movement of the organisation has mainly been evaluated with the
help of 30-day moving average and 10-day moving average, which has helped in understand
the investment scope present within the organisation. The 10-day moving average is
11
5. Share performance of the organisation:
Figure 2: Share price performance of Pan Africa Resources PLC
(Source: Uk.finance.yahoo.com, 2018)
The above figure mainly helps in depicting the level of share price, which Pan Africa
Resources PLC has accumulated over the period of five-fiscal year. The share price
movement is relevantly evaluated with the help of moving averages, which has been used for
detecting the investment opportunity present without the price movement of Pan Africa
Resources PLC. Moreover, drastic alteration in the current share price of Pan Africa
Resources PLC is witnessed during the previous five fiscal years. The share values of the
organisation have mainly increased from the levels of 6.30 to the height of 24.50, which
indicates a wide price range that has been witnessed by Pan Africa Resources PLC. The share
price of the organisation mainly started to rise from July 2015 until the end of July 2016, after
which the overall share price started to decline again. This decline in the overall share price
has mainly indicated during the fiscal year of 2017 until date.
The share price movement of the organisation has mainly been evaluated with the
help of 30-day moving average and 10-day moving average, which has helped in understand
the investment scope present within the organisation. The 10-day moving average is
⊘ This is a preview!⊘
Do you want full access?
Subscribe today to unlock all pages.
Trusted by 1+ million students worldwide
1 out of 17
Related Documents


Your All-in-One AI-Powered Toolkit for Academic Success.
+13062052269
info@desklib.com
Available 24*7 on WhatsApp / Email
![[object Object]](/_next/static/media/star-bottom.7253800d.svg)
Unlock your academic potential
Copyright © 2020–2026 A2Z Services. All Rights Reserved. Developed and managed by ZUCOL.