Panel Analysis of GDP, CPI, and Unemployment: Global Financial Crisis
VerifiedAdded on 2021/09/23
|14
|2181
|144
Report
AI Summary
This report presents a panel analysis investigating the relationship between GDP, CPI, unemployment rate, and GDP deflator in the United States, France, and South Africa, spanning the period before, during, and after the 2008 global financial crisis. The study uses annual data from 1994 to 2017, dividing the data into three panels to assess the crisis's impact. The analysis employs a fixed effects model and Stata software. The results reveal that consumer price index (CPI) and unemployment rate play a crucial role in determining the GDP of a country. The report provides descriptive statistics and interprets the regression models for each panel, highlighting the significant and insignificant variables and their relationships. For example, the CPI showed a positive relationship with GDP across all panels while unemployment rate had a negative relationship with GDP. The analysis offers insights into the evolving influence of these economic indicators during and after the global financial crisis.
Panel Analysis of relationship between GDP and Consumer Price Index, Unemployment rate,
GDP deflator
Student name:
Student number:
Lecturer name:
Date: 6th November 2018
1 | P a g e
GDP deflator
Student name:
Student number:
Lecturer name:
Date: 6th November 2018
1 | P a g e
Paraphrase This Document
Need a fresh take? Get an instant paraphrase of this document with our AI Paraphraser
Abstract
This report presents a panel analysis study that was performed to investigate the relationship
between GDP deflator (GDPF), unemployment rate (UR) and the inflation rates (CPI) with the
nominal Gross Domestic Product (GDP), during/after and before the global financial crisis of
2008. Annual data for 24 succeeding years for three countries (United States, France and South
Africa) have been included in the panel. For us to be able to obtained a more overwhelming
comprehension of the impacts of the global crisis on the relationship between the variables, we
split the panel data set into 3 panel categories, that is, Panel 1 (1994-2007) represents the panel
for the before-crisis, Panel 2 (2008-2017) represents the panel for the during and after crisis
while Panel 3 (1994-2017) represents the long-run panel. We used Stata to analyze the data.
2 | P a g e
Table of Contents
Abstract............................................................................................................................................2
Introduction......................................................................................................................................4
Methodology....................................................................................................................................5
Results..............................................................................................................................................6
Descriptive analysis.....................................................................................................................6
Model Interpretation for Panel 1......................................................................................................7
Model Interpretation for Panel 2......................................................................................................8
Model Interpretation for Panel 3......................................................................................................9
Conclusion.....................................................................................................................................11
References......................................................................................................................................12
Appendix........................................................................................................................................13
3 | P a g e
⊘ This is a preview!⊘
Do you want full access?
Subscribe today to unlock all pages.
Trusted by 1+ million students worldwide
Introduction
The 2007/2008 global crisis on finance began in the United States (US) and was as a result of a
serious liquidity inadequacy among monetary institutions when they got confronted with
unforgiving economic situation while trying to transfer the short term debts. Thusly,
indebtedness among those foundations began to become a normal issue and not long after, a
noteworthy investment bank in the US by the name Lehman Brothers came down in September
2008. This led to a drop in the certainty level and compelled the investors to generously sell and
close their positions, making the share trading system dive. Subsequently, the money related
market of the European Union (EU) was thumped down to its most reduced since the retreat of
early1930s (also known as the Great Depression).
This study therefore was performed to investigate the relationship between GDP deflator
(GDPF), unemployment rate (UR) and the inflation rates (CPI) with the nominal Gross Domestic
Product (GDP), before and after the 2008 global financial crisis. The aim was to check how the
global financial crisis influenced the effect that the independent variables (GDP deflator (GDPF),
unemployment rate (UR) and the inflation rates (CPI)) had on the dependent variable (nominal
Gross Domestic Product growth rates (GDP)).
4 | P a g e
Paraphrase This Document
Need a fresh take? Get an instant paraphrase of this document with our AI Paraphraser
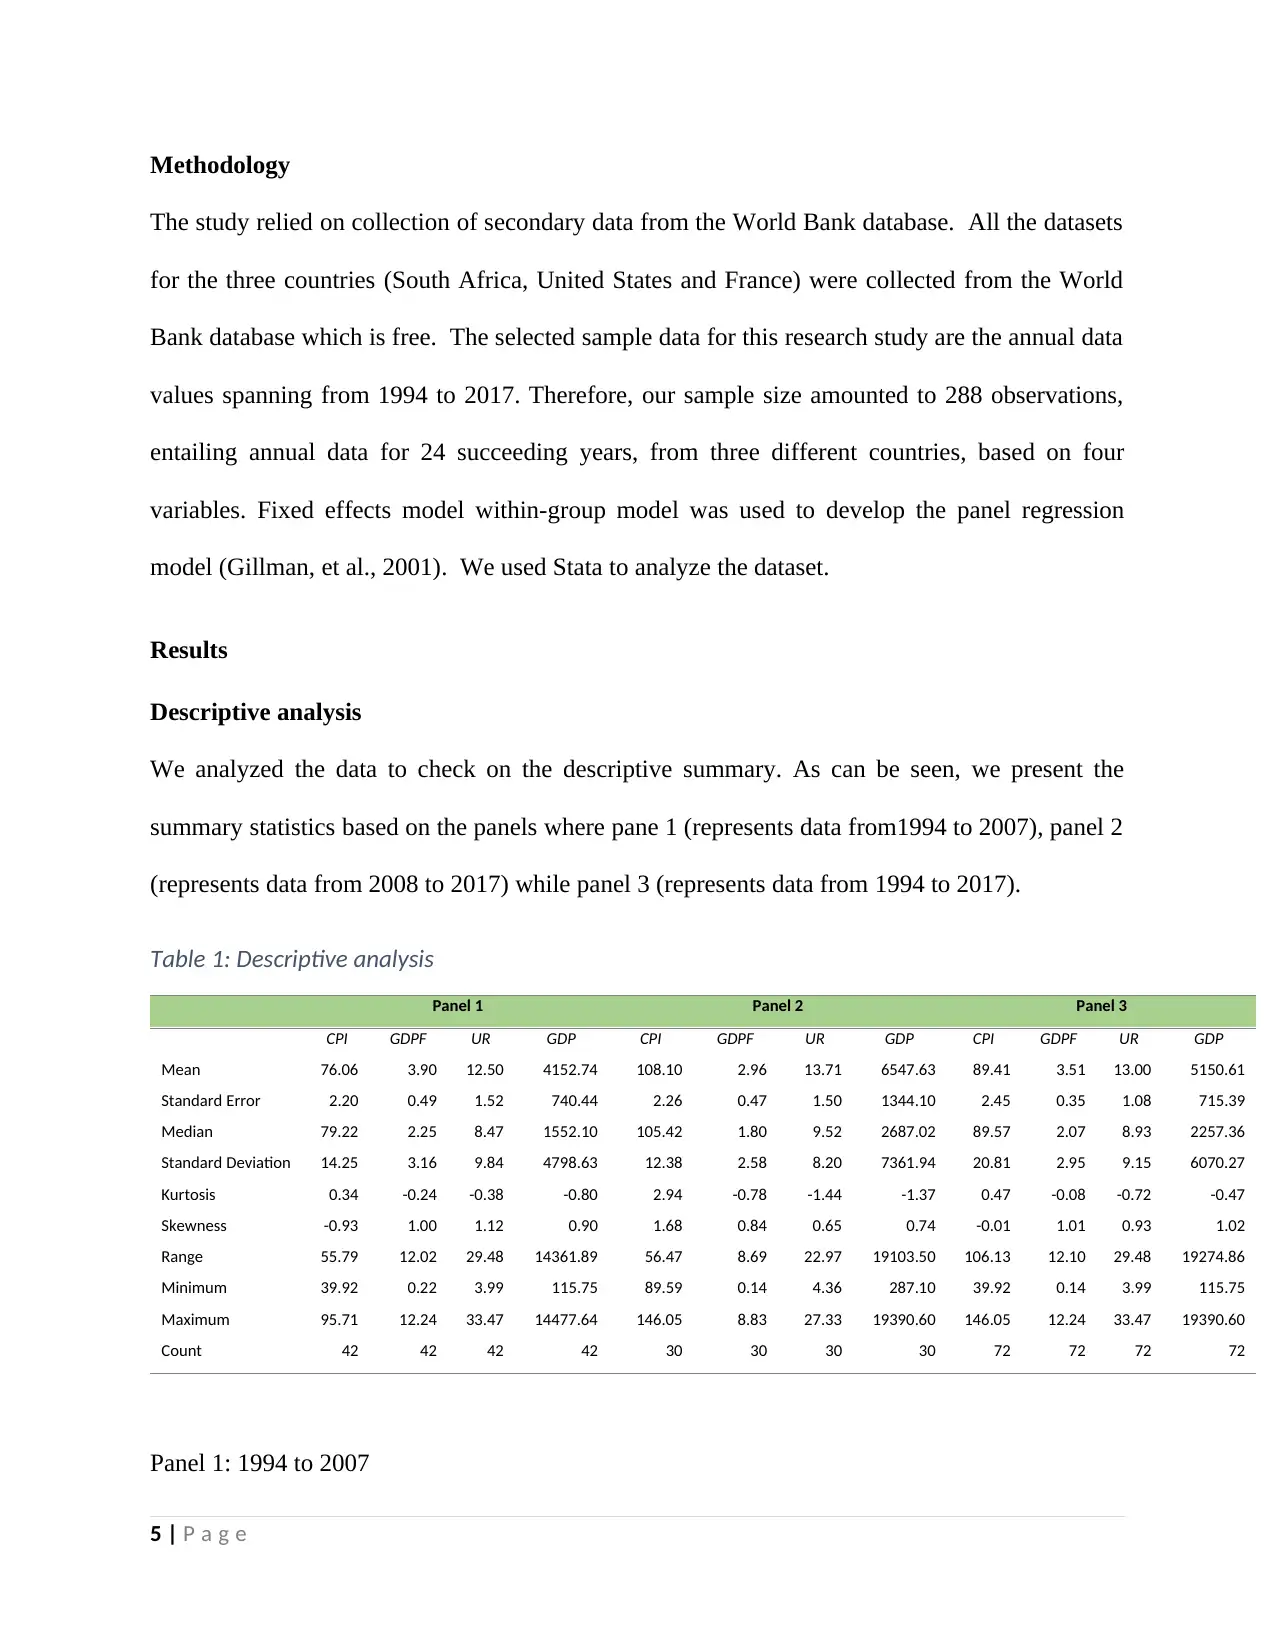
Methodology
The study relied on collection of secondary data from the World Bank database. All the datasets
for the three countries (South Africa, United States and France) were collected from the World
Bank database which is free. The selected sample data for this research study are the annual data
values spanning from 1994 to 2017. Therefore, our sample size amounted to 288 observations,
entailing annual data for 24 succeeding years, from three different countries, based on four
variables. Fixed effects model within-group model was used to develop the panel regression
model (Gillman, et al., 2001). We used Stata to analyze the dataset.
Results
Descriptive analysis
We analyzed the data to check on the descriptive summary. As can be seen, we present the
summary statistics based on the panels where pane 1 (represents data from1994 to 2007), panel 2
(represents data from 2008 to 2017) while panel 3 (represents data from 1994 to 2017).
Table 1: Descriptive analysis
Panel 1 Panel 2 Panel 3
CPI GDPF UR GDP CPI GDPF UR GDP CPI GDPF UR GDP
Mean 76.06 3.90 12.50 4152.74 108.10 2.96 13.71 6547.63 89.41 3.51 13.00 5150.61
Standard Error 2.20 0.49 1.52 740.44 2.26 0.47 1.50 1344.10 2.45 0.35 1.08 715.39
Median 79.22 2.25 8.47 1552.10 105.42 1.80 9.52 2687.02 89.57 2.07 8.93 2257.36
Standard Deviation 14.25 3.16 9.84 4798.63 12.38 2.58 8.20 7361.94 20.81 2.95 9.15 6070.27
Kurtosis 0.34 -0.24 -0.38 -0.80 2.94 -0.78 -1.44 -1.37 0.47 -0.08 -0.72 -0.47
Skewness -0.93 1.00 1.12 0.90 1.68 0.84 0.65 0.74 -0.01 1.01 0.93 1.02
Range 55.79 12.02 29.48 14361.89 56.47 8.69 22.97 19103.50 106.13 12.10 29.48 19274.86
Minimum 39.92 0.22 3.99 115.75 89.59 0.14 4.36 287.10 39.92 0.14 3.99 115.75
Maximum 95.71 12.24 33.47 14477.64 146.05 8.83 27.33 19390.60 146.05 12.24 33.47 19390.60
Count 42 42 42 42 30 30 30 30 72 72 72 72
Panel 1: 1994 to 2007
5 | P a g e
Panel 2: 2008 to 2017
Panel 3: 1994 to 2017
As can be seen from table 1 above, the average CPI was lowest before the global crisis (M =
76.06, SD = 14.25) and it rose after the global crisis (M = 108.10, SD = 12.38). The
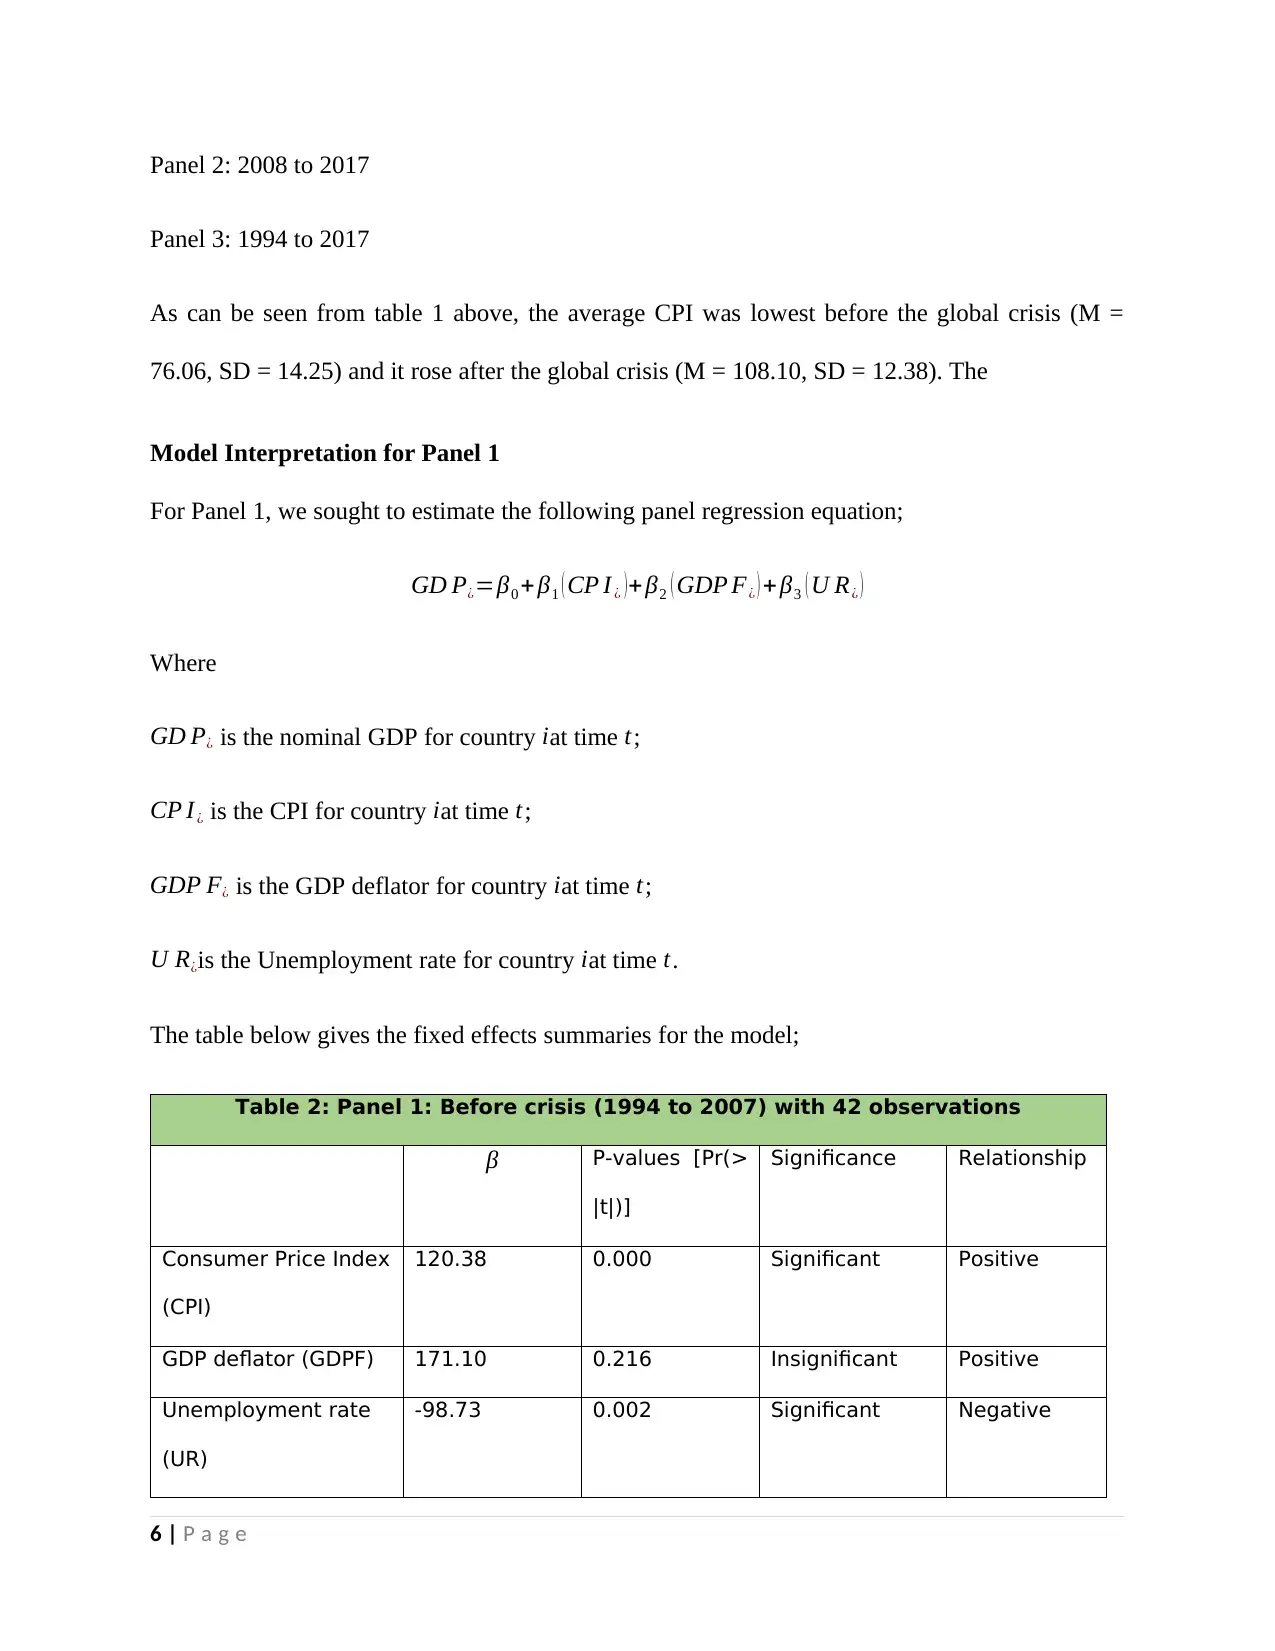
Model Interpretation for Panel 1
For Panel 1, we sought to estimate the following panel regression equation;
GD P¿=β0 + β1 ( CP I ¿ )+ β2 ( GDP F¿ ) + β3 ( U R¿ )
Where
GD P¿ is the nominal GDP for country iat time t;
CP I¿ is the CPI for country iat time t;
GDP F¿ is the GDP deflator for country iat time t;
U R¿is the Unemployment rate for country iat time t.
The table below gives the fixed effects summaries for the model;
Table 2: Panel 1: Before crisis (1994 to 2007) with 42 observations
β P-values [Pr(>
|t|)]
Significance Relationship
Consumer Price Index
(CPI)
120.38 0.000 Significant Positive
GDP deflator (GDPF) 171.10 0.216 Insignificant Positive
Unemployment rate
(UR)
-98.73 0.002 Significant Negative
6 | P a g e
Panel 3: 1994 to 2017
As can be seen from table 1 above, the average CPI was lowest before the global crisis (M =
76.06, SD = 14.25) and it rose after the global crisis (M = 108.10, SD = 12.38). The
Model Interpretation for Panel 1
For Panel 1, we sought to estimate the following panel regression equation;
GD P¿=β0 + β1 ( CP I ¿ )+ β2 ( GDP F¿ ) + β3 ( U R¿ )
Where
GD P¿ is the nominal GDP for country iat time t;
CP I¿ is the CPI for country iat time t;
GDP F¿ is the GDP deflator for country iat time t;
U R¿is the Unemployment rate for country iat time t.
The table below gives the fixed effects summaries for the model;
Table 2: Panel 1: Before crisis (1994 to 2007) with 42 observations
β P-values [Pr(>
|t|)]
Significance Relationship
Consumer Price Index
(CPI)
120.38 0.000 Significant Positive
GDP deflator (GDPF) 171.10 0.216 Insignificant Positive
Unemployment rate
(UR)
-98.73 0.002 Significant Negative
6 | P a g e
⊘ This is a preview!⊘
Do you want full access?
Subscribe today to unlock all pages.
Trusted by 1+ million students worldwide
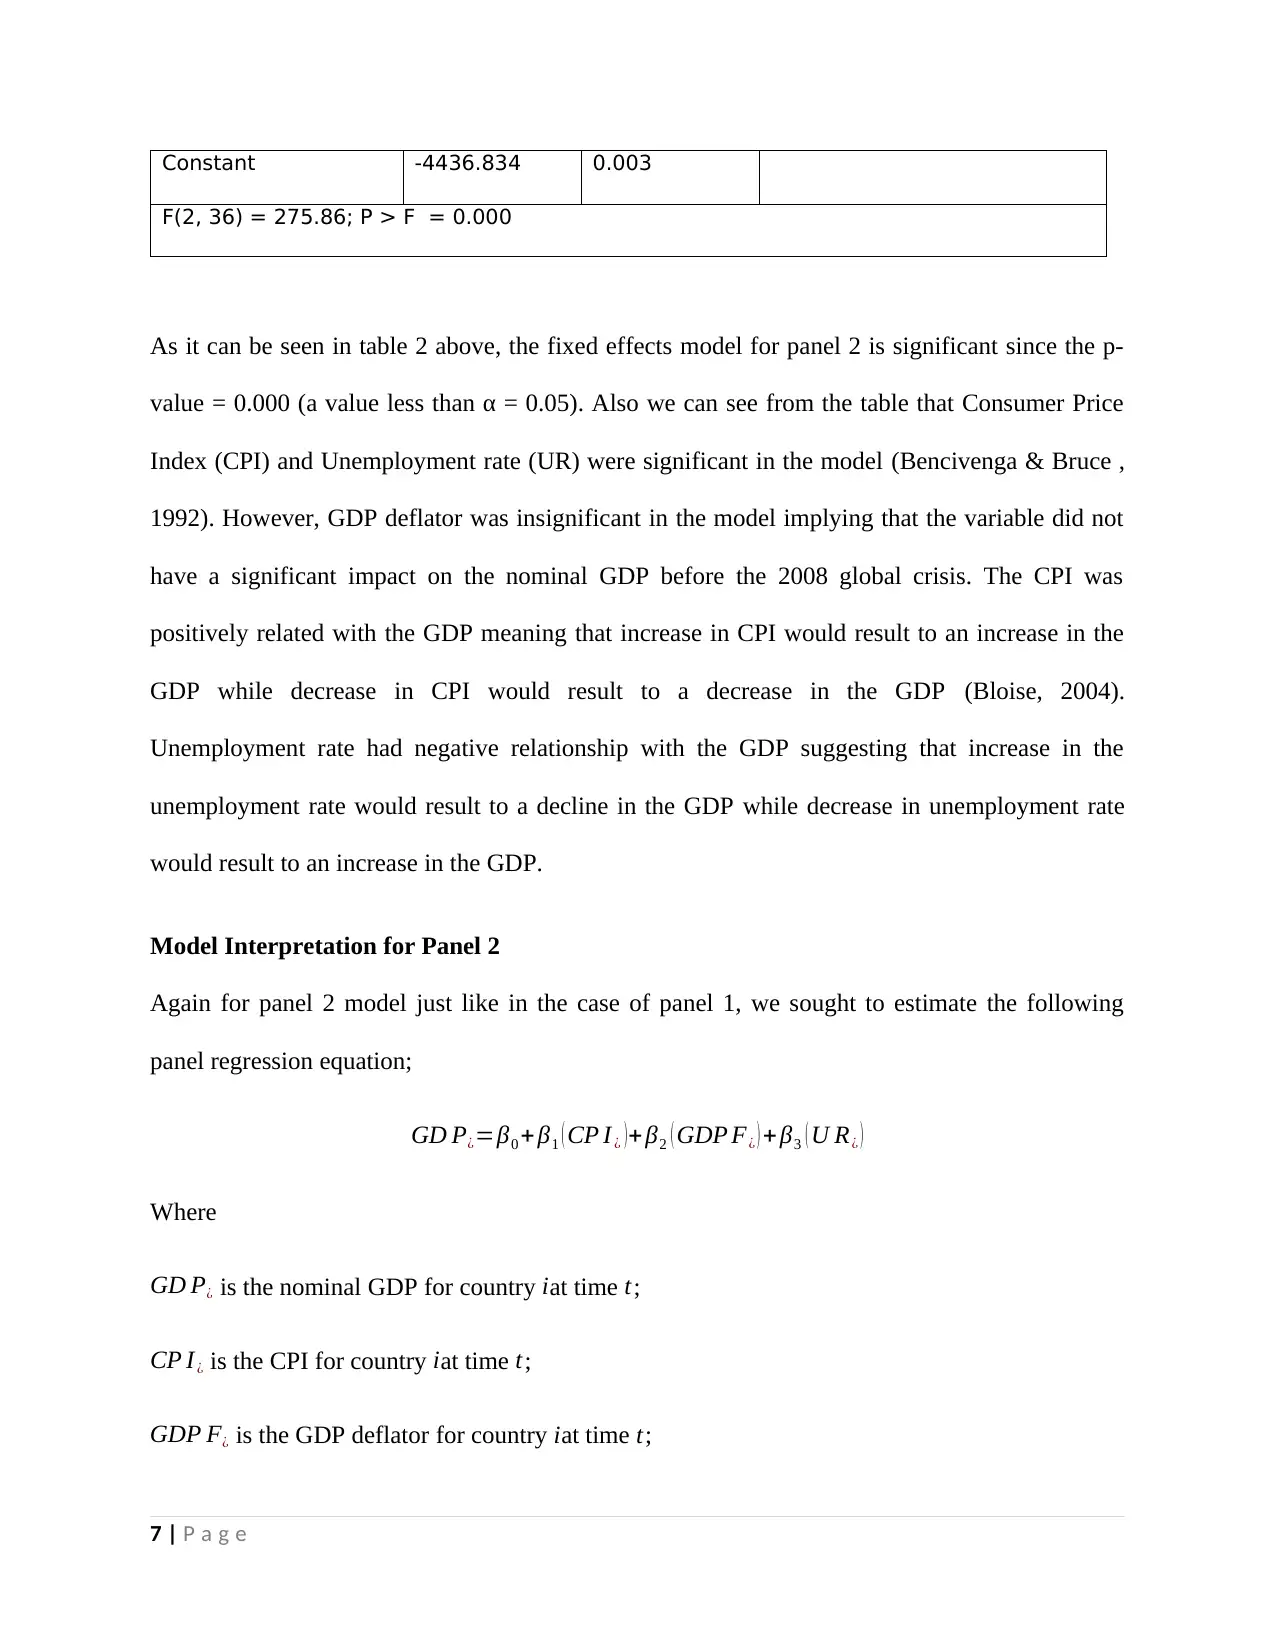
Constant -4436.834 0.003
F(2, 36) = 275.86; P > F = 0.000
As it can be seen in table 2 above, the fixed effects model for panel 2 is significant since the p-
value = 0.000 (a value less than α = 0.05). Also we can see from the table that Consumer Price
Index (CPI) and Unemployment rate (UR) were significant in the model (Bencivenga & Bruce ,
1992). However, GDP deflator was insignificant in the model implying that the variable did not
have a significant impact on the nominal GDP before the 2008 global crisis. The CPI was
positively related with the GDP meaning that increase in CPI would result to an increase in the
GDP while decrease in CPI would result to a decrease in the GDP (Bloise, 2004).
Unemployment rate had negative relationship with the GDP suggesting that increase in the
unemployment rate would result to a decline in the GDP while decrease in unemployment rate
would result to an increase in the GDP.
Model Interpretation for Panel 2
Again for panel 2 model just like in the case of panel 1, we sought to estimate the following
panel regression equation;
GD P¿=β0 + β1 ( CP I ¿ )+ β2 ( GDP F¿ ) + β3 ( U R¿ )
Where
GD P¿ is the nominal GDP for country iat time t;
CP I¿ is the CPI for country iat time t;
GDP F¿ is the GDP deflator for country iat time t;
7 | P a g e
Paraphrase This Document
Need a fresh take? Get an instant paraphrase of this document with our AI Paraphraser
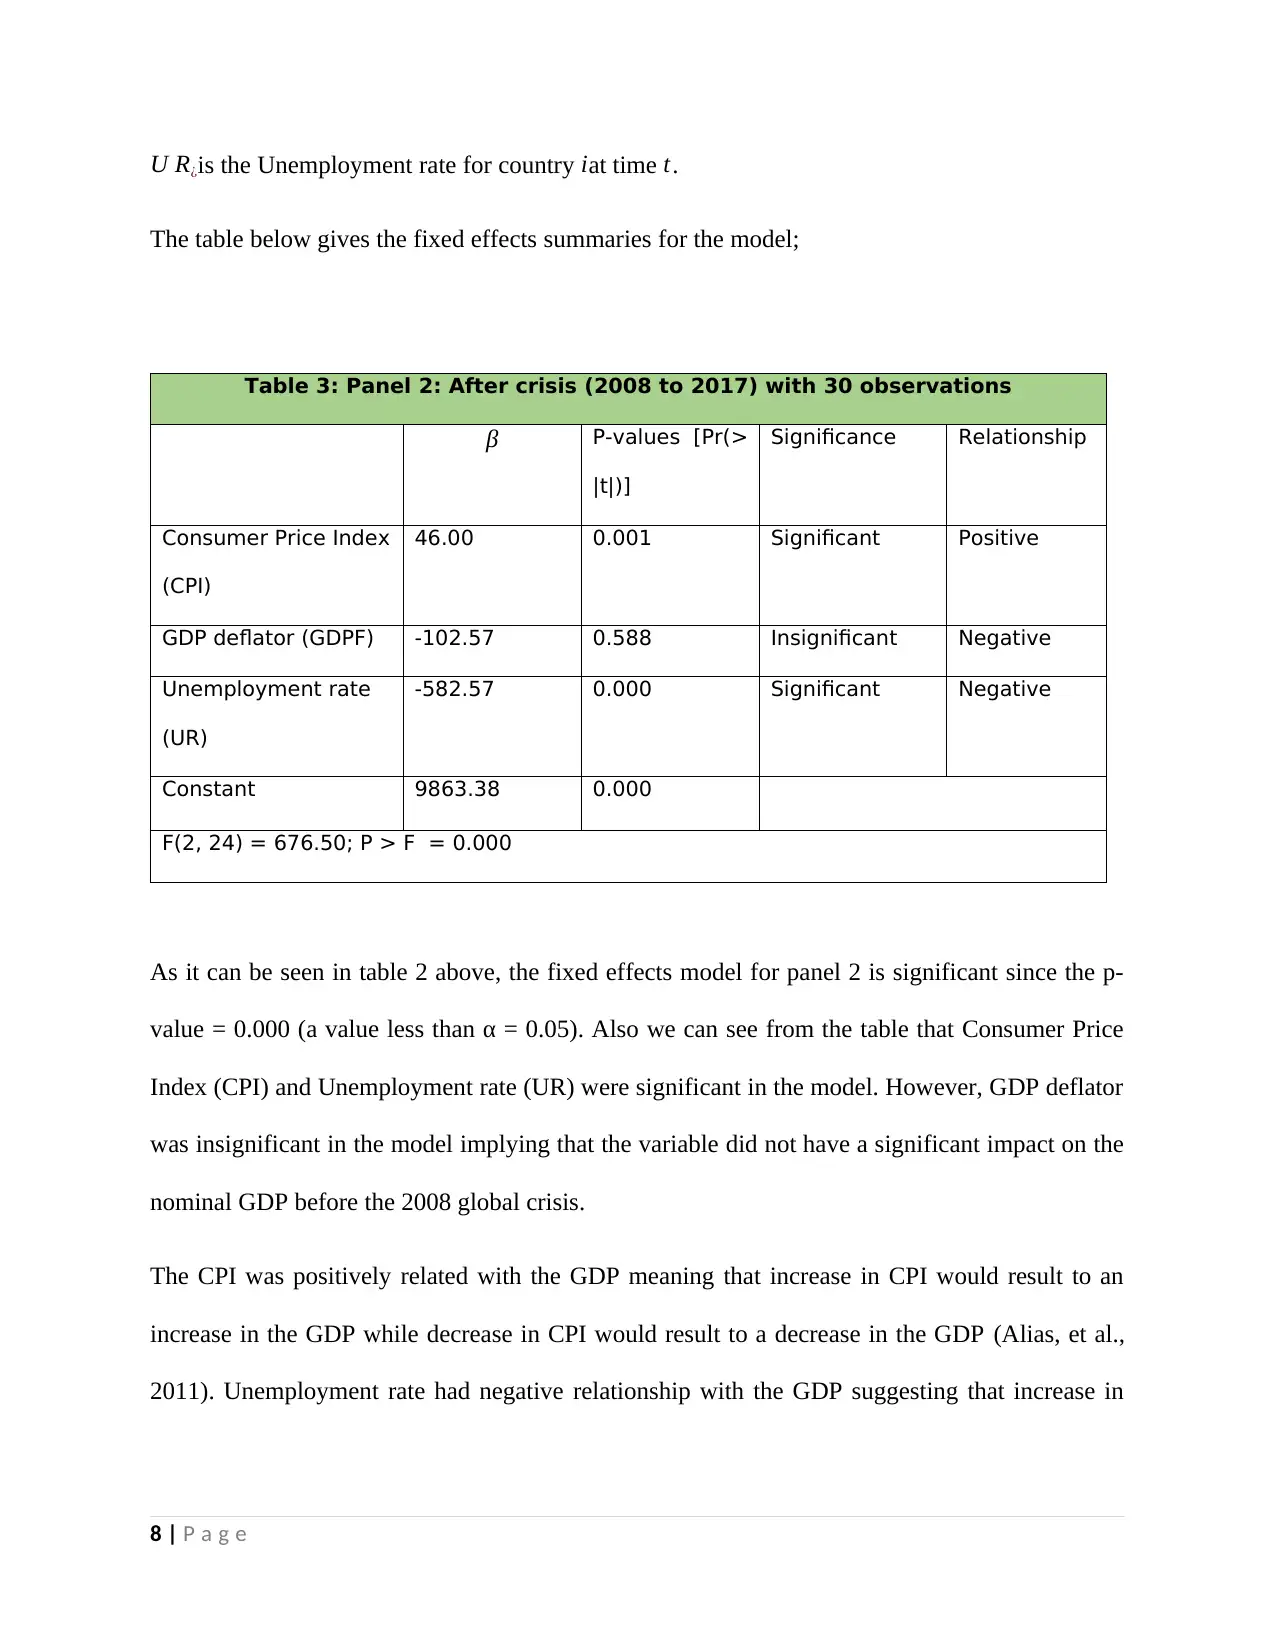
U R¿is the Unemployment rate for country iat time t.
The table below gives the fixed effects summaries for the model;
Table 3: Panel 2: After crisis (2008 to 2017) with 30 observations
β P-values [Pr(>
|t|)]
Significance Relationship
Consumer Price Index
(CPI)
46.00 0.001 Significant Positive
GDP deflator (GDPF) -102.57 0.588 Insignificant Negative
Unemployment rate
(UR)
-582.57 0.000 Significant Negative
Constant 9863.38 0.000
F(2, 24) = 676.50; P > F = 0.000
As it can be seen in table 2 above, the fixed effects model for panel 2 is significant since the p-
value = 0.000 (a value less than α = 0.05). Also we can see from the table that Consumer Price
Index (CPI) and Unemployment rate (UR) were significant in the model. However, GDP deflator
was insignificant in the model implying that the variable did not have a significant impact on the
nominal GDP before the 2008 global crisis.
The CPI was positively related with the GDP meaning that increase in CPI would result to an
increase in the GDP while decrease in CPI would result to a decrease in the GDP (Alias, et al.,
2011). Unemployment rate had negative relationship with the GDP suggesting that increase in
8 | P a g e
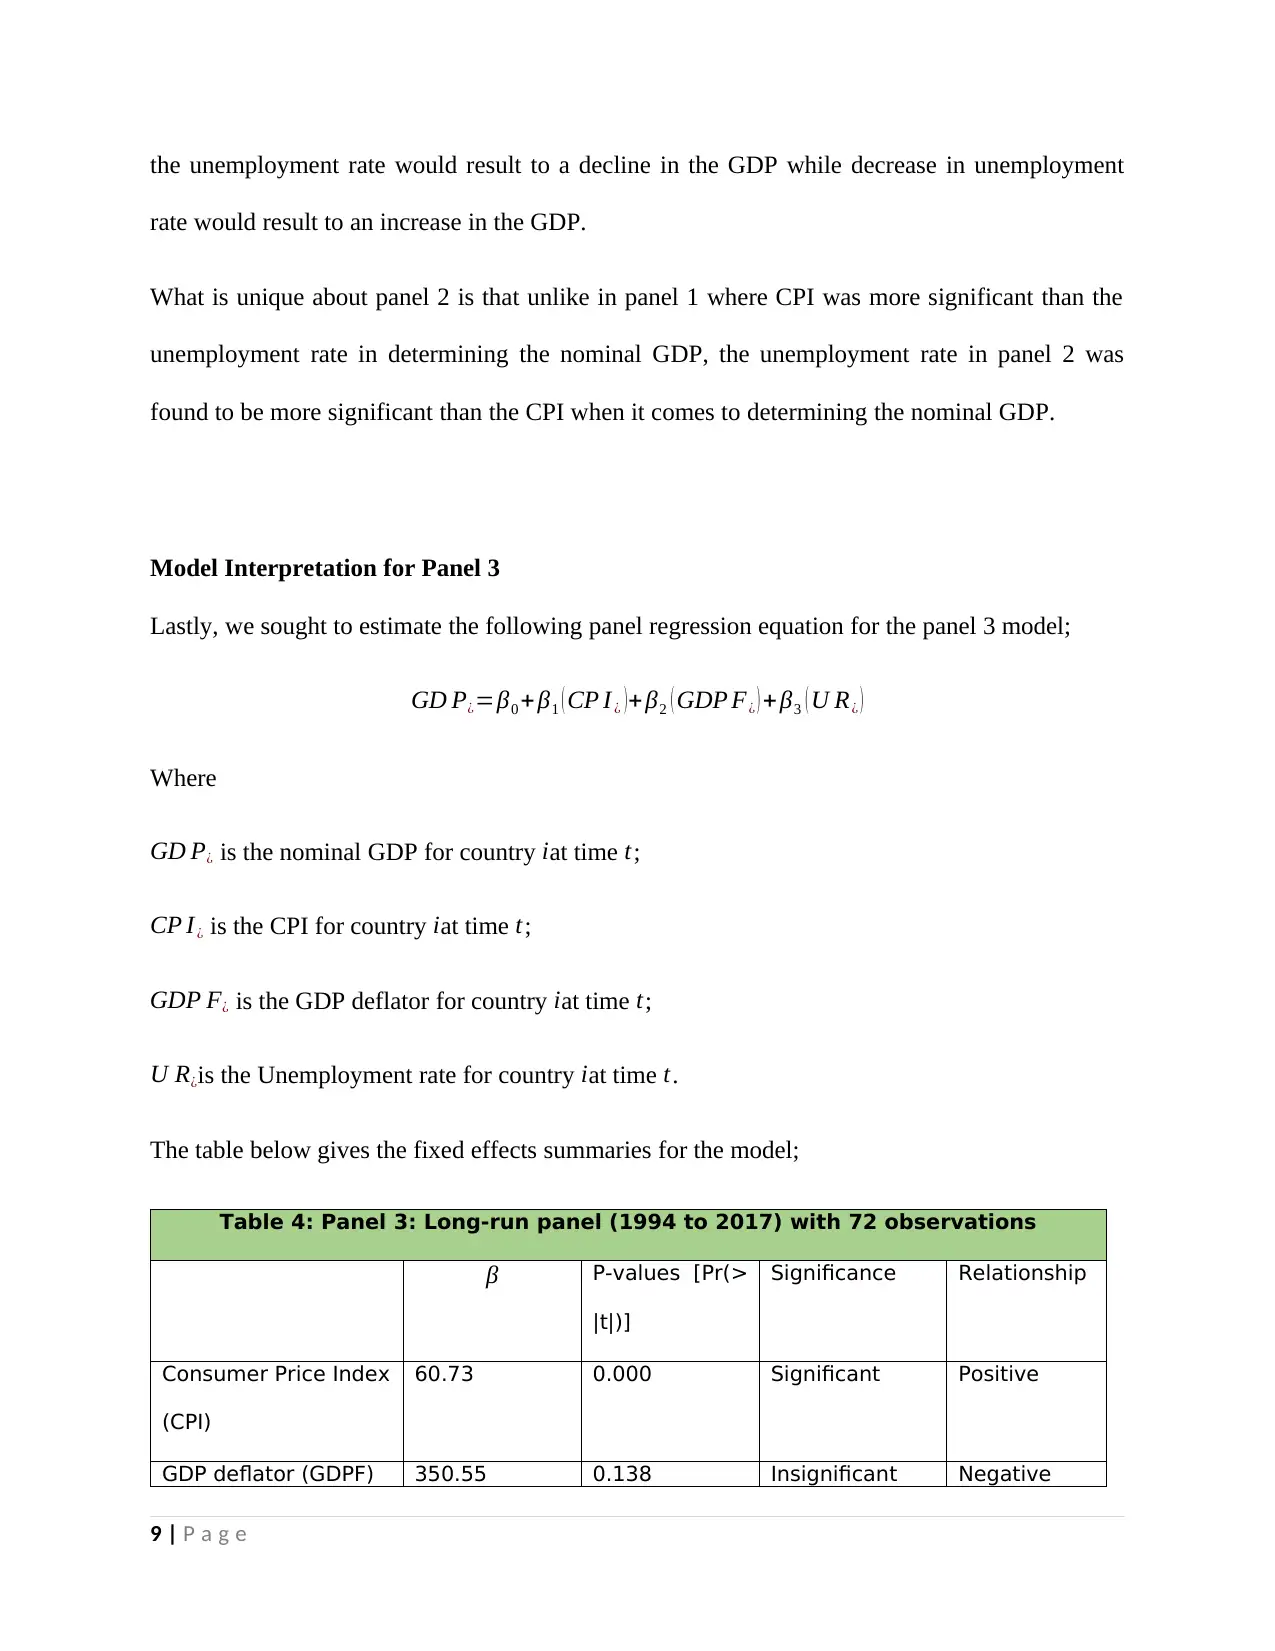
the unemployment rate would result to a decline in the GDP while decrease in unemployment
rate would result to an increase in the GDP.
What is unique about panel 2 is that unlike in panel 1 where CPI was more significant than the
unemployment rate in determining the nominal GDP, the unemployment rate in panel 2 was
found to be more significant than the CPI when it comes to determining the nominal GDP.
Model Interpretation for Panel 3
Lastly, we sought to estimate the following panel regression equation for the panel 3 model;
GD P¿=β0 + β1 ( CP I ¿ )+ β2 ( GDP F¿ ) + β3 ( U R¿ )
Where
GD P¿ is the nominal GDP for country iat time t;
CP I¿ is the CPI for country iat time t;
GDP F¿ is the GDP deflator for country iat time t;
U R¿is the Unemployment rate for country iat time t.
The table below gives the fixed effects summaries for the model;
Table 4: Panel 3: Long-run panel (1994 to 2017) with 72 observations
β P-values [Pr(>
|t|)]
Significance Relationship
Consumer Price Index
(CPI)
60.73 0.000 Significant Positive
GDP deflator (GDPF) 350.55 0.138 Insignificant Negative
9 | P a g e
⊘ This is a preview!⊘
Do you want full access?
Subscribe today to unlock all pages.
Trusted by 1+ million students worldwide
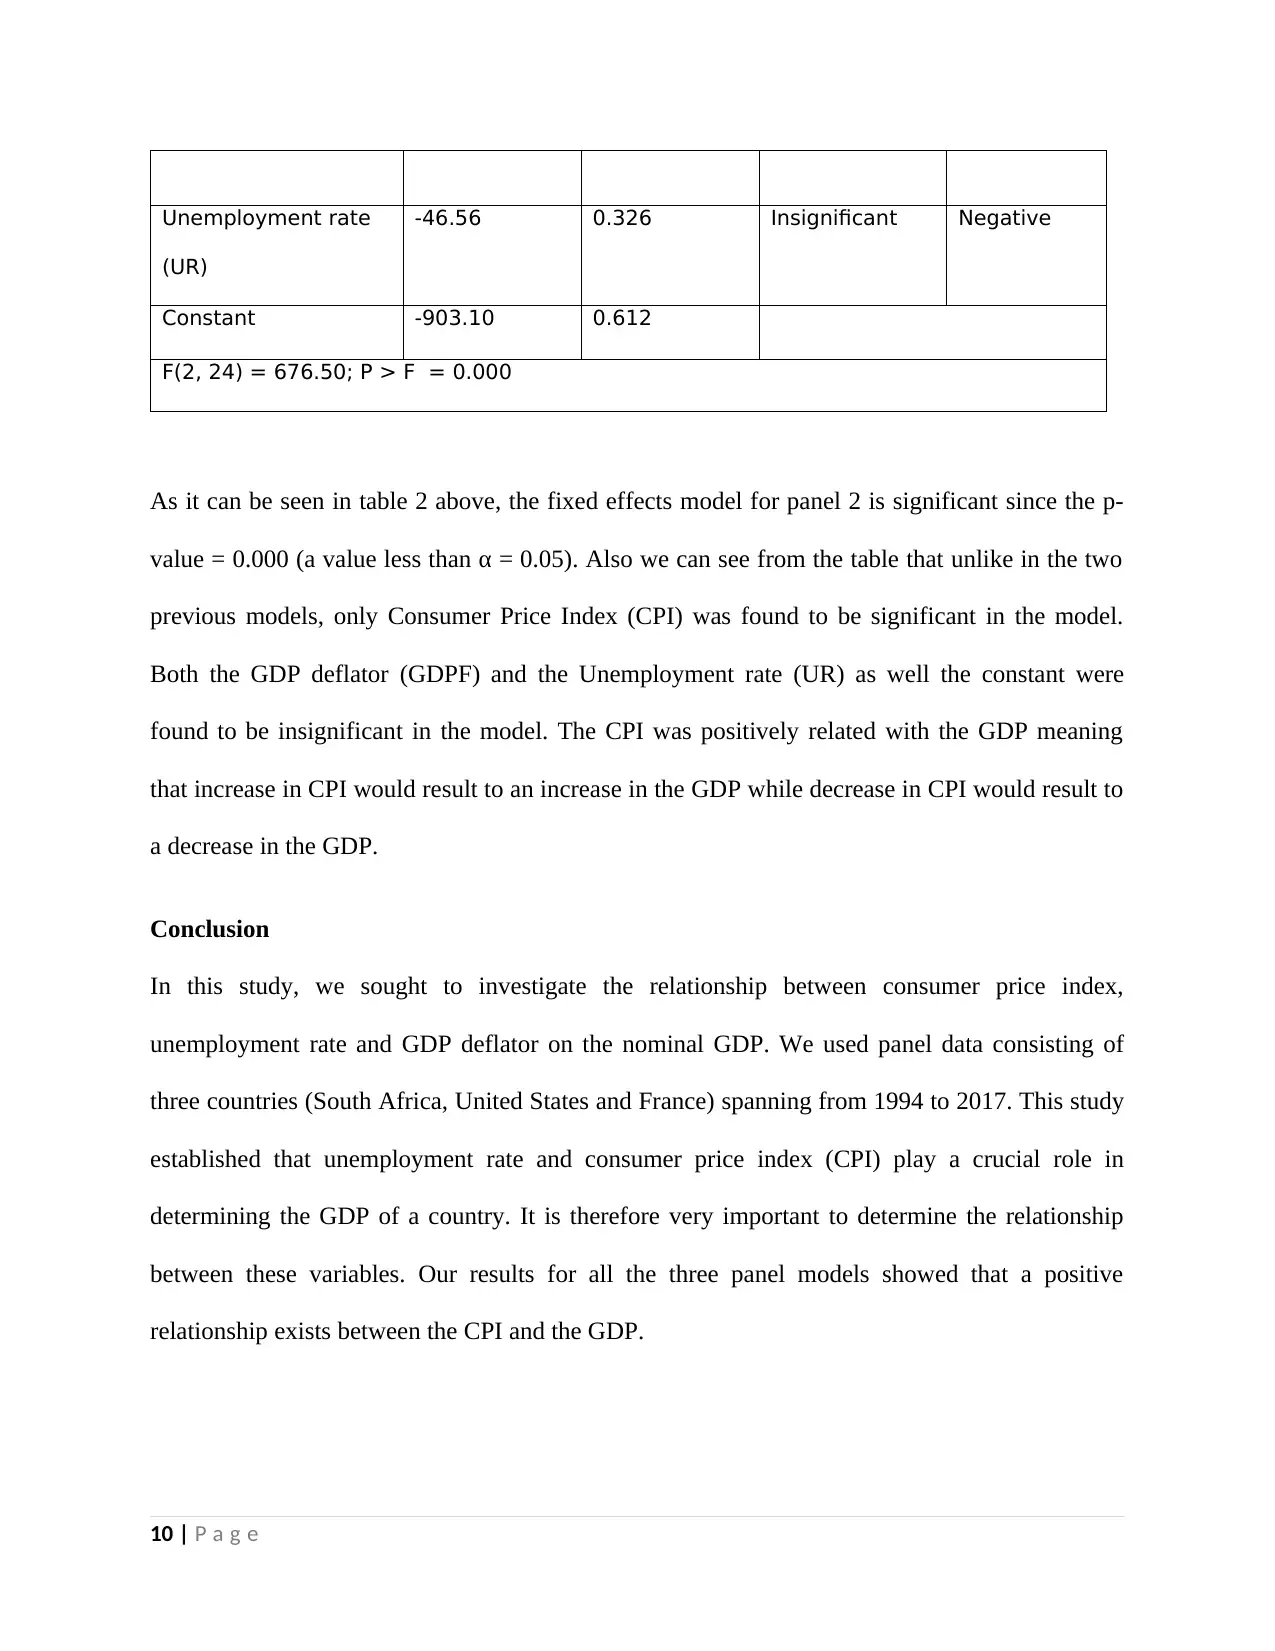
Unemployment rate
(UR)
-46.56 0.326 Insignificant Negative
Constant -903.10 0.612
F(2, 24) = 676.50; P > F = 0.000
As it can be seen in table 2 above, the fixed effects model for panel 2 is significant since the p-
value = 0.000 (a value less than α = 0.05). Also we can see from the table that unlike in the two
previous models, only Consumer Price Index (CPI) was found to be significant in the model.
Both the GDP deflator (GDPF) and the Unemployment rate (UR) as well the constant were
found to be insignificant in the model. The CPI was positively related with the GDP meaning
that increase in CPI would result to an increase in the GDP while decrease in CPI would result to
a decrease in the GDP.
Conclusion
In this study, we sought to investigate the relationship between consumer price index,
unemployment rate and GDP deflator on the nominal GDP. We used panel data consisting of
three countries (South Africa, United States and France) spanning from 1994 to 2017. This study
established that unemployment rate and consumer price index (CPI) play a crucial role in
determining the GDP of a country. It is therefore very important to determine the relationship
between these variables. Our results for all the three panel models showed that a positive
relationship exists between the CPI and the GDP.
10 | P a g e
Paraphrase This Document
Need a fresh take? Get an instant paraphrase of this document with our AI Paraphraser
References
Alias, T. S., Razak, E. A., Asari, F. F. & Zin, S. M., 2011. Multivariate Time Series Analysis on
Correlation Between Inflation Rate and Employment Rate with Gross Domestic Product.
Baltagi, B., 2008. Econometric analysis of panel data (4th ed).
Bencivenga, V. R. & Bruce , D. S., 1992. Deficits, Inflation and the Banking System in
Developing Countries: Optimal Degree of Financial Repression. Oxford Economic Papers, pp.
767-790.
Bloise, G., 2004. A remark on the fiscal theory of price determination. Journal of Mathematical
Economics, 41(8), pp. 1037-1052.
David, D., Pedro, G. P. & Paula, H. E., 2005. Threshold effects in the relationship between
inflation and growth: A new panel-data approach.
Gillman, M., Harris, M. N. & Matyas, L., 2001. Inflation and growth: Some theory and evidence.
10th International Conference on Panel Data. International Conferences on Panel Data.
11 | P a g e
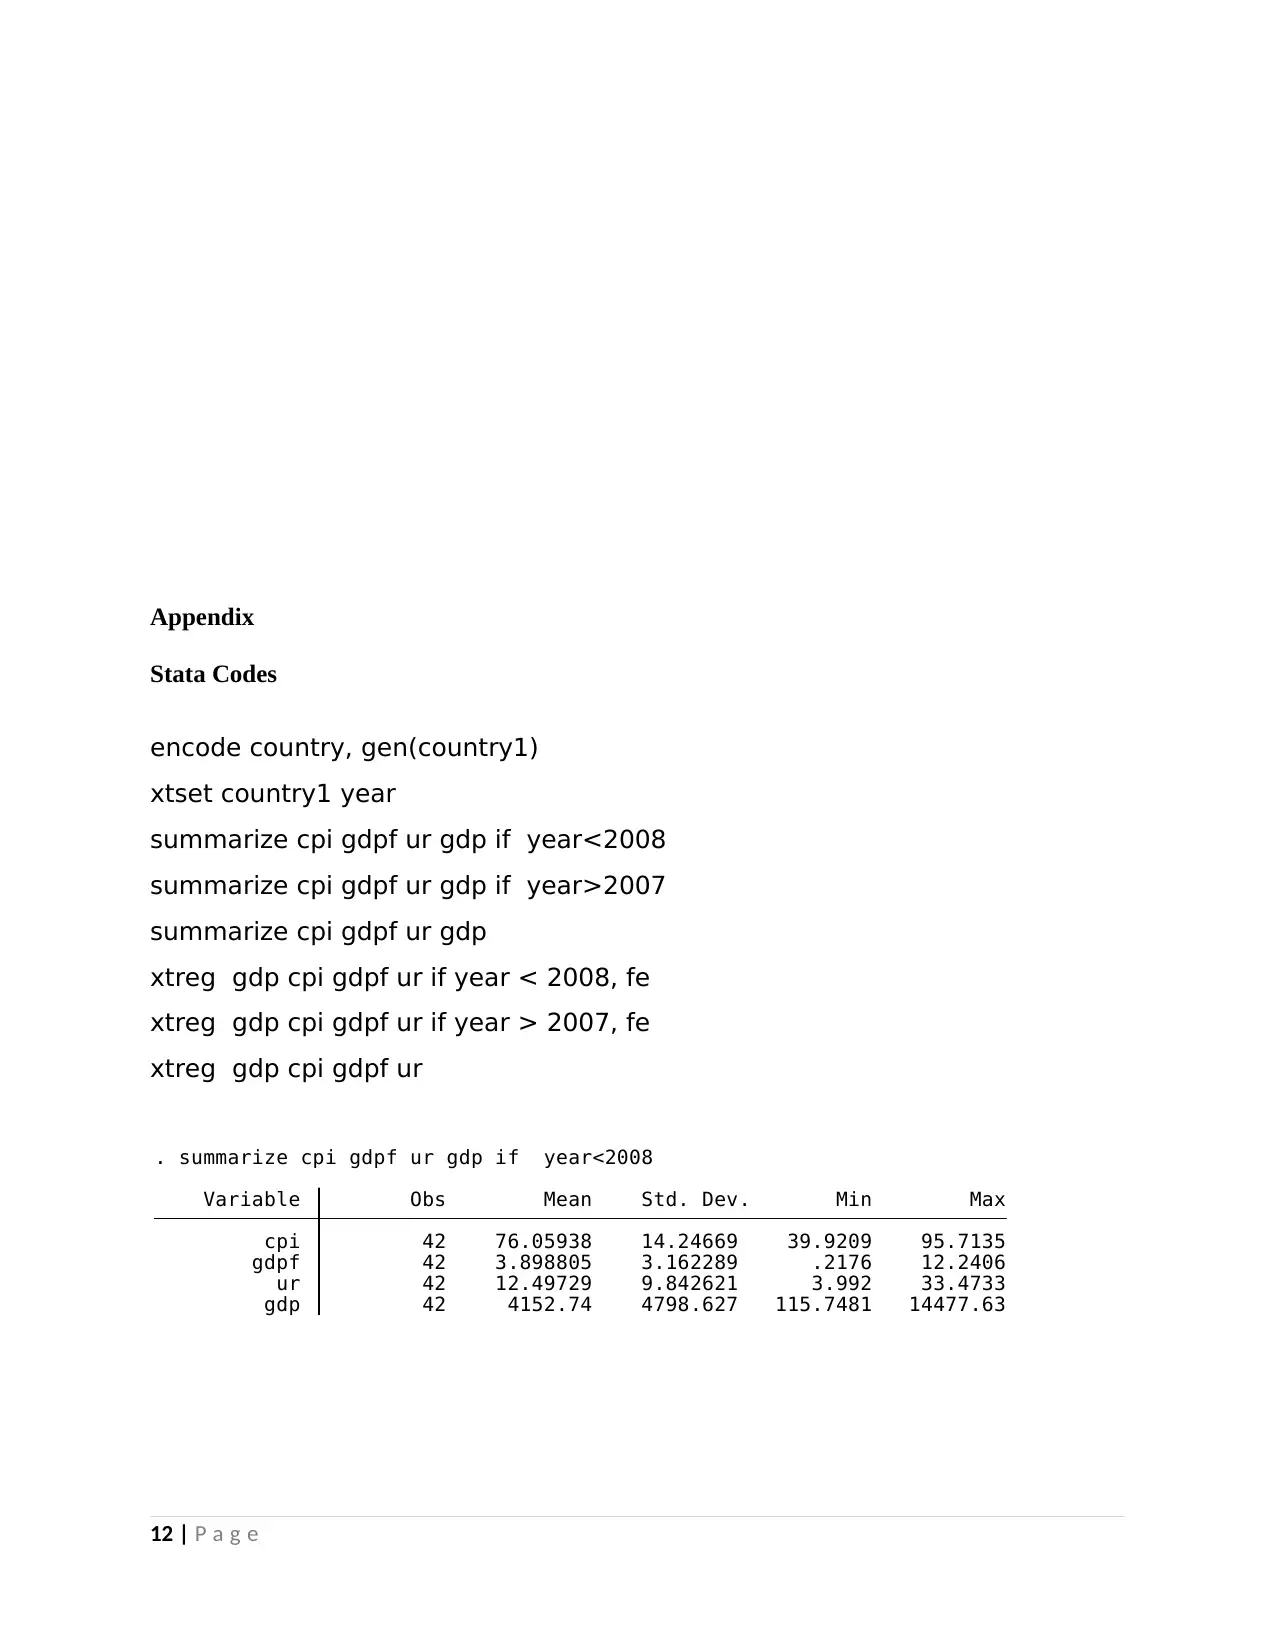
Appendix
Stata Codes
encode country, gen(country1)
xtset country1 year
summarize cpi gdpf ur gdp if year<2008
summarize cpi gdpf ur gdp if year>2007
summarize cpi gdpf ur gdp
xtreg gdp cpi gdpf ur if year < 2008, fe
xtreg gdp cpi gdpf ur if year > 2007, fe
xtreg gdp cpi gdpf ur
gdp 42 4152.74 4798.627 115.7481 14477.63
ur 42 12.49729 9.842621 3.992 33.4733
gdpf 42 3.898805 3.162289 .2176 12.2406
cpi 42 76.05938 14.24669 39.9209 95.7135
Variable Obs Mean Std. Dev. Min Max
. summarize cpi gdpf ur gdp if year<2008
12 | P a g e
⊘ This is a preview!⊘
Do you want full access?
Subscribe today to unlock all pages.
Trusted by 1+ million students worldwide
1 out of 14
Related Documents


Your All-in-One AI-Powered Toolkit for Academic Success.
+13062052269
info@desklib.com
Available 24*7 on WhatsApp / Email
![[object Object]](/_next/static/media/star-bottom.7253800d.svg)
Unlock your academic potential
Copyright © 2020–2026 A2Z Services. All Rights Reserved. Developed and managed by ZUCOL.