Cooling Curve Analysis: Paraffin Wax vs. Stearic Acid Comparison

Verified

Added on  2023/03/30

|6
|805
|480
Practical Assignment
AI Summary
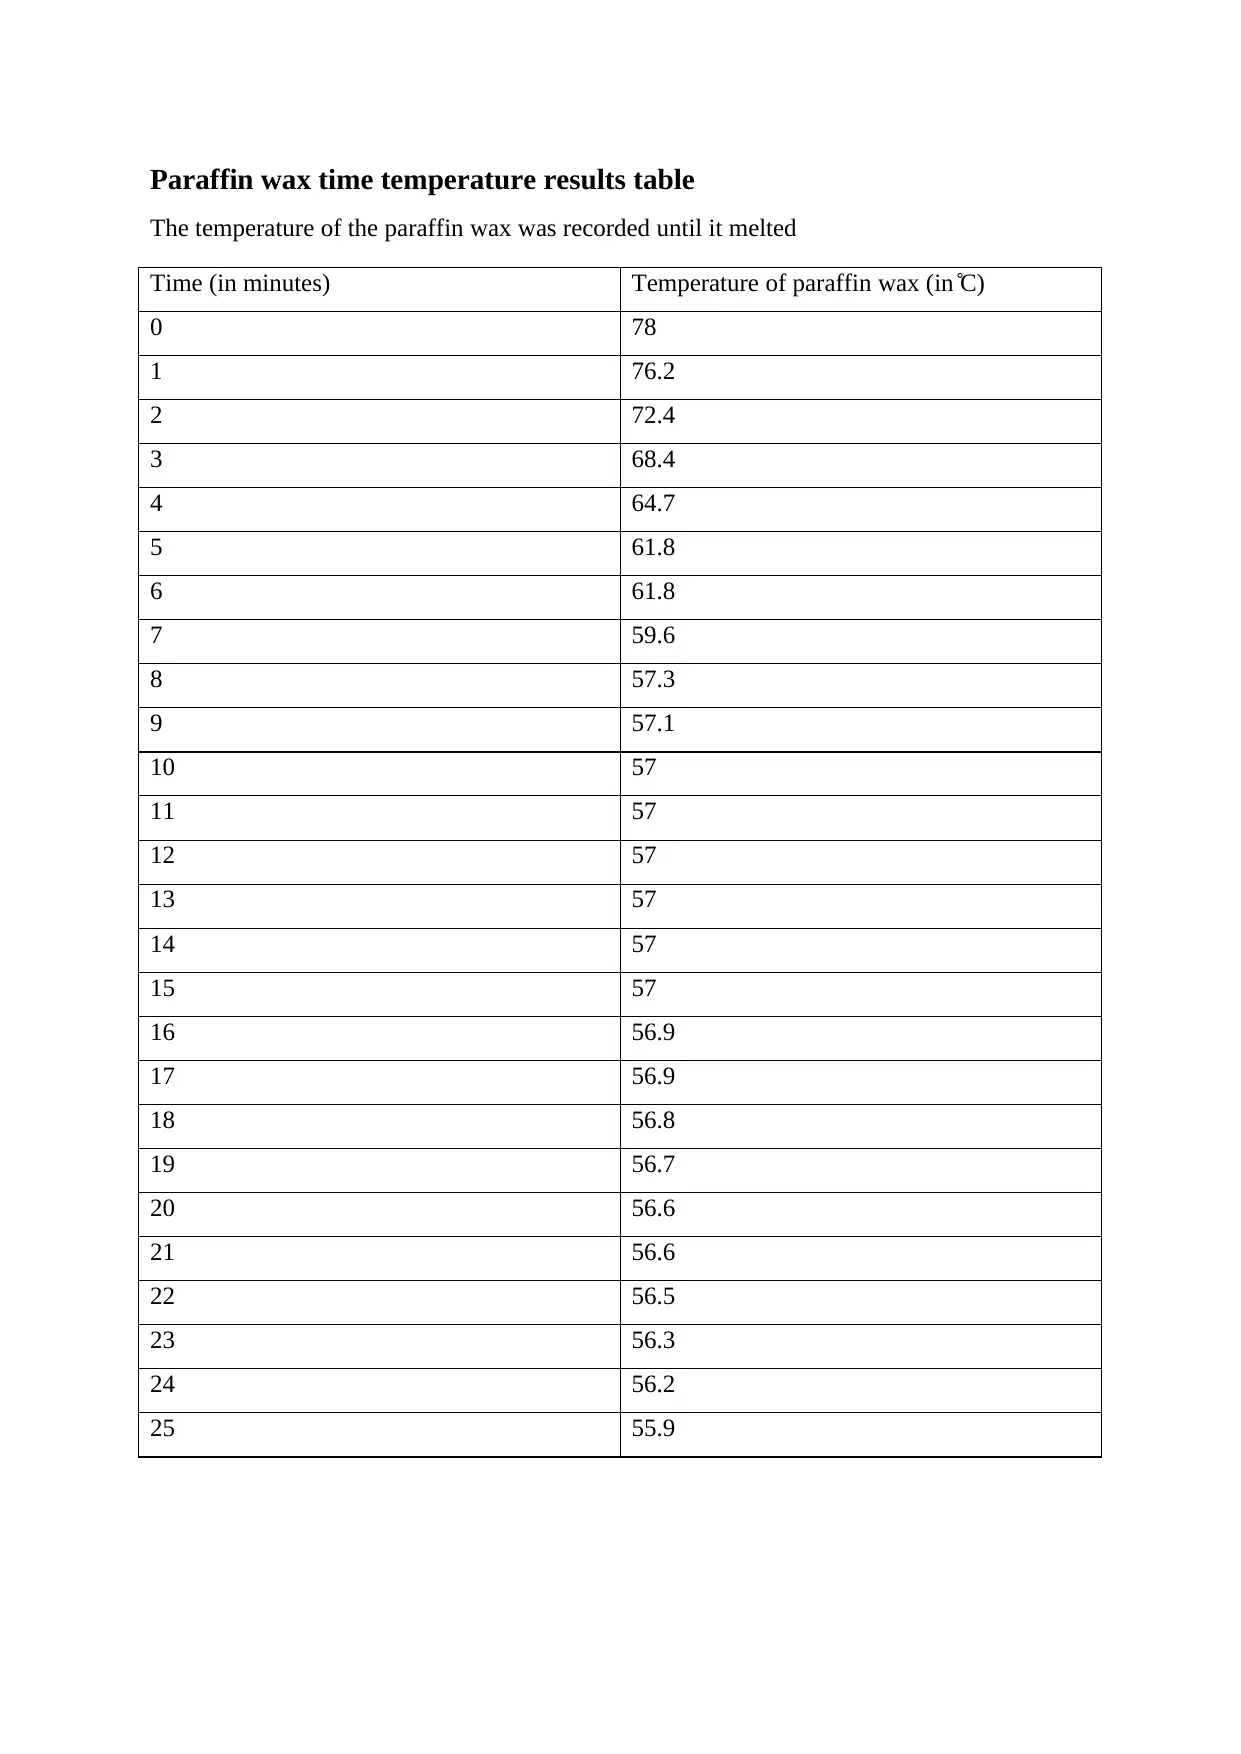
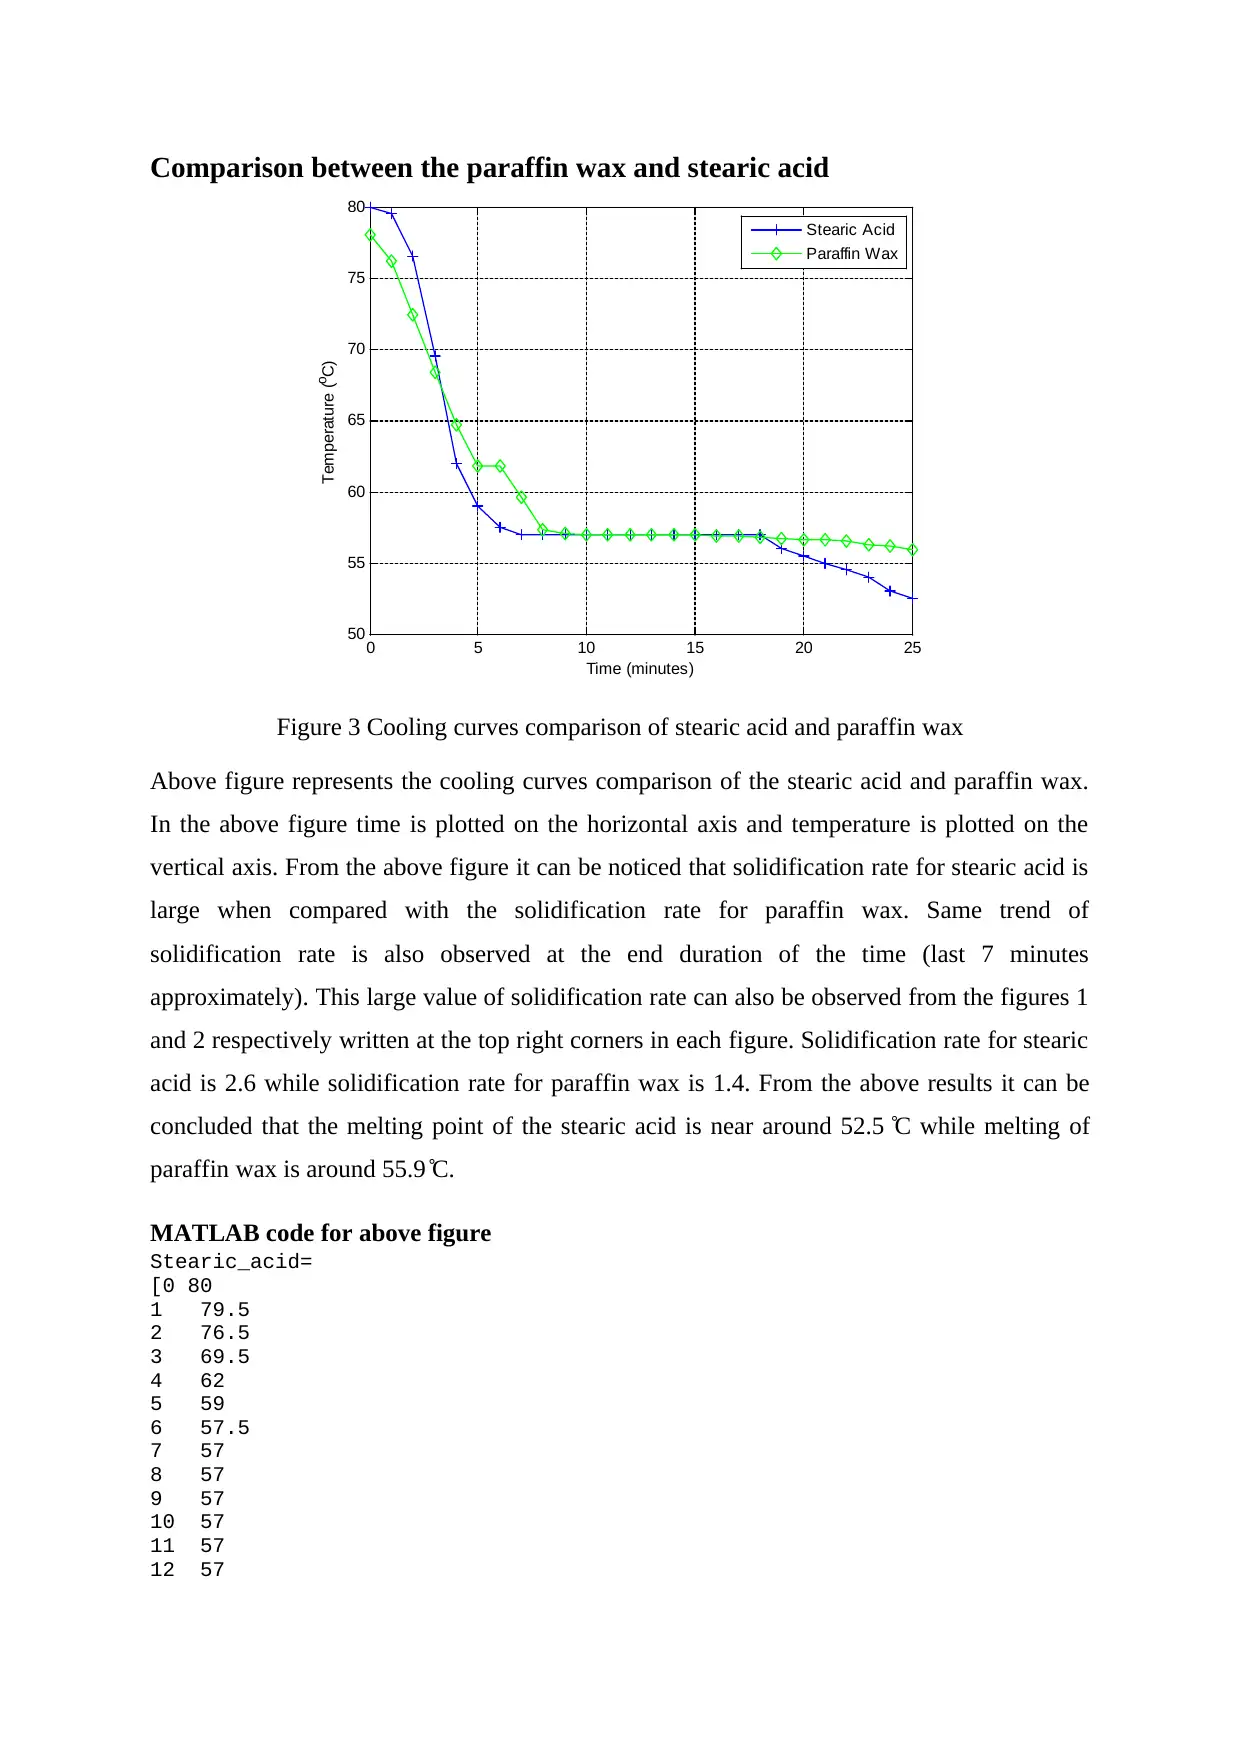
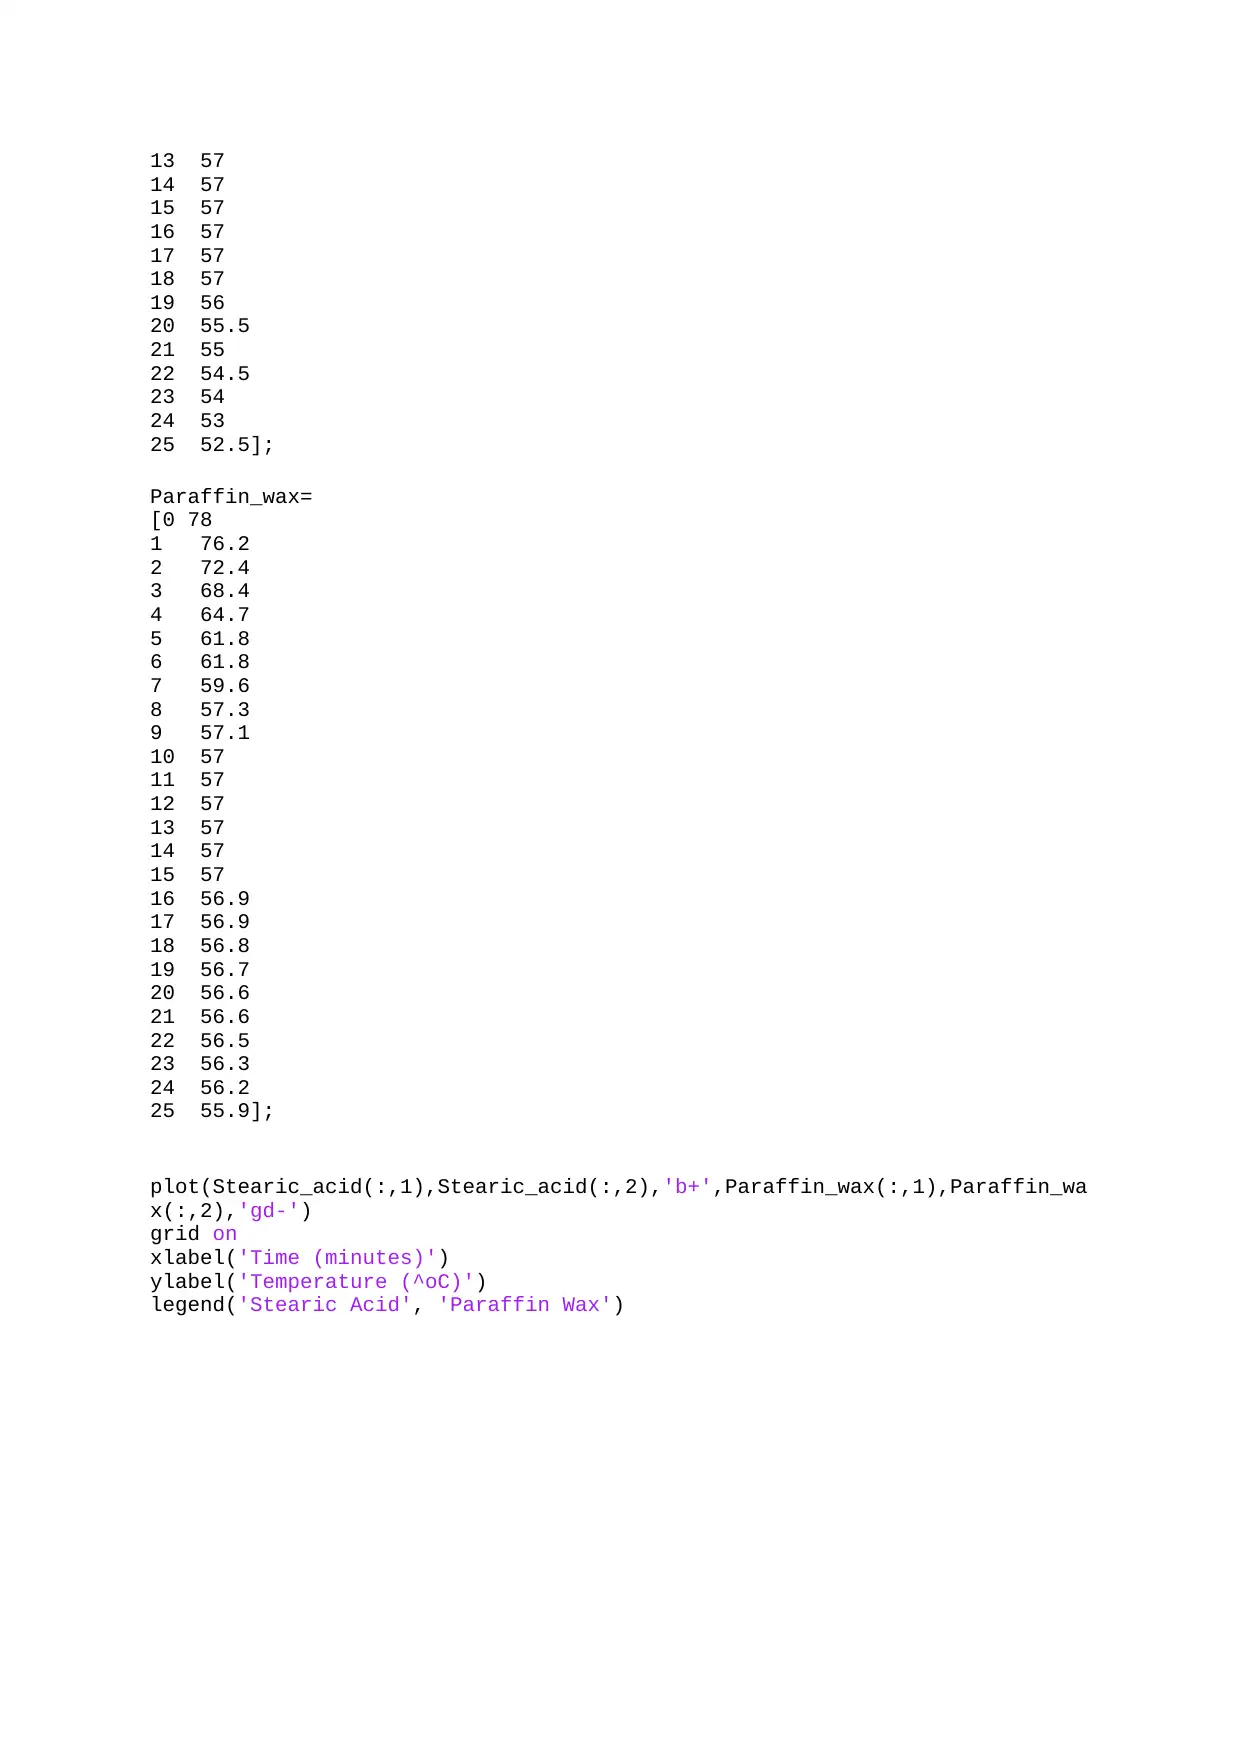
This assignment presents an analysis of the cooling curves of paraffin wax and stearic acid. The assignment includes experimental data presented in tables and graphs, depicting the temperature changes over time for both substances. The cooling curves are analyzed to determine the melting points and solidification rates of each material. A comparative analysis highlights the differences in solidification rates between paraffin wax and stearic acid. The assignment also includes MATLAB code used to generate the comparative cooling curve graph, enabling a visual comparison of the two substances. The results indicate that stearic acid has a higher solidification rate and a lower melting point compared to paraffin wax, as demonstrated by the experimental data and graphical representations.
Document Page
Paraffin wax time temperature results table
The temperature of the paraffin wax was recorded until it melted
Time (in minutes) Temperature of paraffin wax (in ̊ C)
0 78
1 76.2
2 72.4
3 68.4
4 64.7
5 61.8
6 61.8
7 59.6
8 57.3
9 57.1
10 57
11 57
12 57
13 57
14 57
15 57
16 56.9
17 56.9
18 56.8
19 56.7
20 56.6
21 56.6
22 56.5
23 56.3
24 56.2
25 55.9
tabler-icon-diamond-filled.svg

Paraphrase This Document

Need a fresh take? Get an instant paraphrase of this document with our AI Paraphraser
Document Page
Figure 1 Cooling curve of paraffin wax
Above figure represents the cooling curve of the paraffin wax it represents the variation of
temperature with respect to time. Above figure is also called as time-temperature history
curve, it shows the phenomenon of a phase change process. This happens due to the
conversion of solid phase into liquid phase. In the above figure time is plotted on the
horizontal axis and temperature is plotted on the vertical axis. From the above cooling curve
it can be noticed that temperature decreases continuously with increment in the time. It can be
noticed that, initially the temperature decreases sharply from 78 ̊ C to 57 ̊ C within a duration
of 9 minutes (approximately). In the later part temperature decreases very slowly showing a
decrement in the solidification rate, cooling curve in the later duration is steeper compared to
the cooling curve in the initial duration. From the above results it can be concluded that the
melting point of paraffin wax is around 55.9 ̊ C.
Document Page
Stearic acid time temperature results table
The temperature of the stearic acid was recorded until it melted
Time (in minutes) Temperature of stearic acid (in ̊ C)
0 80
1 79.5
2 76.5
3 69.5
4 62
5 59
6 57.5
7 57
8 57
9 57
10 57
11 57
12 57
13 57
14 57
15 57
16 57
17 57
18 57
19 56
20 55.5
21 55
22 54.5
23 54
24 53
25 52.5
Document Page
Figure 2 Cooling curve of stearic acid
Above figure represents the cooling curve of the stearic acid it represents the variation of
temperature with respect to time. Above figure is also called as time-temperature history
curve, it shows the phenomenon of a phase change process. This happens due to the
conversion of solid phase into liquid phase. In the above figure time is plotted on the
horizontal axis and temperature is plotted on the vertical axis. From the above cooling curve
it can be noticed that temperature decreases continuously with increment in the time. It can be
noticed that, initially the temperature decreases sharply from 80 ̊ C to 57 ̊ C within a duration
of 7 minutes (approximately). In the later part temperature decreases very slowly showing a
decrement in the solidification rate, cooling curve in the later duration is steeper compared to
the cooling curve in the initial duration. From the above results it can be concluded that the
melting point of the stearic acid is near around 52.5 ̊ C.
tabler-icon-diamond-filled.svg

Paraphrase This Document

Need a fresh take? Get an instant paraphrase of this document with our AI Paraphraser
Document Page
Comparison between the paraffin wax and stearic acid
0 5 10 15 20 25
50
55
60
65
70
75
80
Time (minutes)
Temperature (oC)
Stearic Acid
Paraffin Wax
Figure 3 Cooling curves comparison of stearic acid and paraffin wax
Above figure represents the cooling curves comparison of the stearic acid and paraffin wax.
In the above figure time is plotted on the horizontal axis and temperature is plotted on the
vertical axis. From the above figure it can be noticed that solidification rate for stearic acid is
large when compared with the solidification rate for paraffin wax. Same trend of
solidification rate is also observed at the end duration of the time (last 7 minutes
approximately). This large value of solidification rate can also be observed from the figures 1
and 2 respectively written at the top right corners in each figure. Solidification rate for stearic
acid is 2.6 while solidification rate for paraffin wax is 1.4. From the above results it can be
concluded that the melting point of the stearic acid is near around 52.5 ̊ C while melting of
paraffin wax is around 55.9 ̊ C.
MATLAB code for above figure
Stearic_acid=
[0 80
1 79.5
2 76.5
3 69.5
4 62
5 59
6 57.5
7 57
8 57
9 57
10 57
11 57
12 57
Document Page
13 57
14 57
15 57
16 57
17 57
18 57
19 56
20 55.5
21 55
22 54.5
23 54
24 53
25 52.5];
Paraffin_wax=
[0 78
1 76.2
2 72.4
3 68.4
4 64.7
5 61.8
6 61.8
7 59.6
8 57.3
9 57.1
10 57
11 57
12 57
13 57
14 57
15 57
16 56.9
17 56.9
18 56.8
19 56.7
20 56.6
21 56.6
22 56.5
23 56.3
24 56.2
25 55.9];
plot(Stearic_acid(:,1),Stearic_acid(:,2),'b+',Paraffin_wax(:,1),Paraffin_wa
x(:,2),'gd-')
grid on
xlabel('Time (minutes)')
ylabel('Temperature (^oC)')
legend('Stearic Acid', 'Paraffin Wax')
chevron_up_icon
1 out of 6
circle_padding
hide_on_mobile
zoom_out_icon
[object Object]