Numeracy and Data Analysis Assignment: Blair Atholl Passenger Data

Verified

Added on  2021/02/21

|10
|1543
|189
Homework Assignment
AI Summary
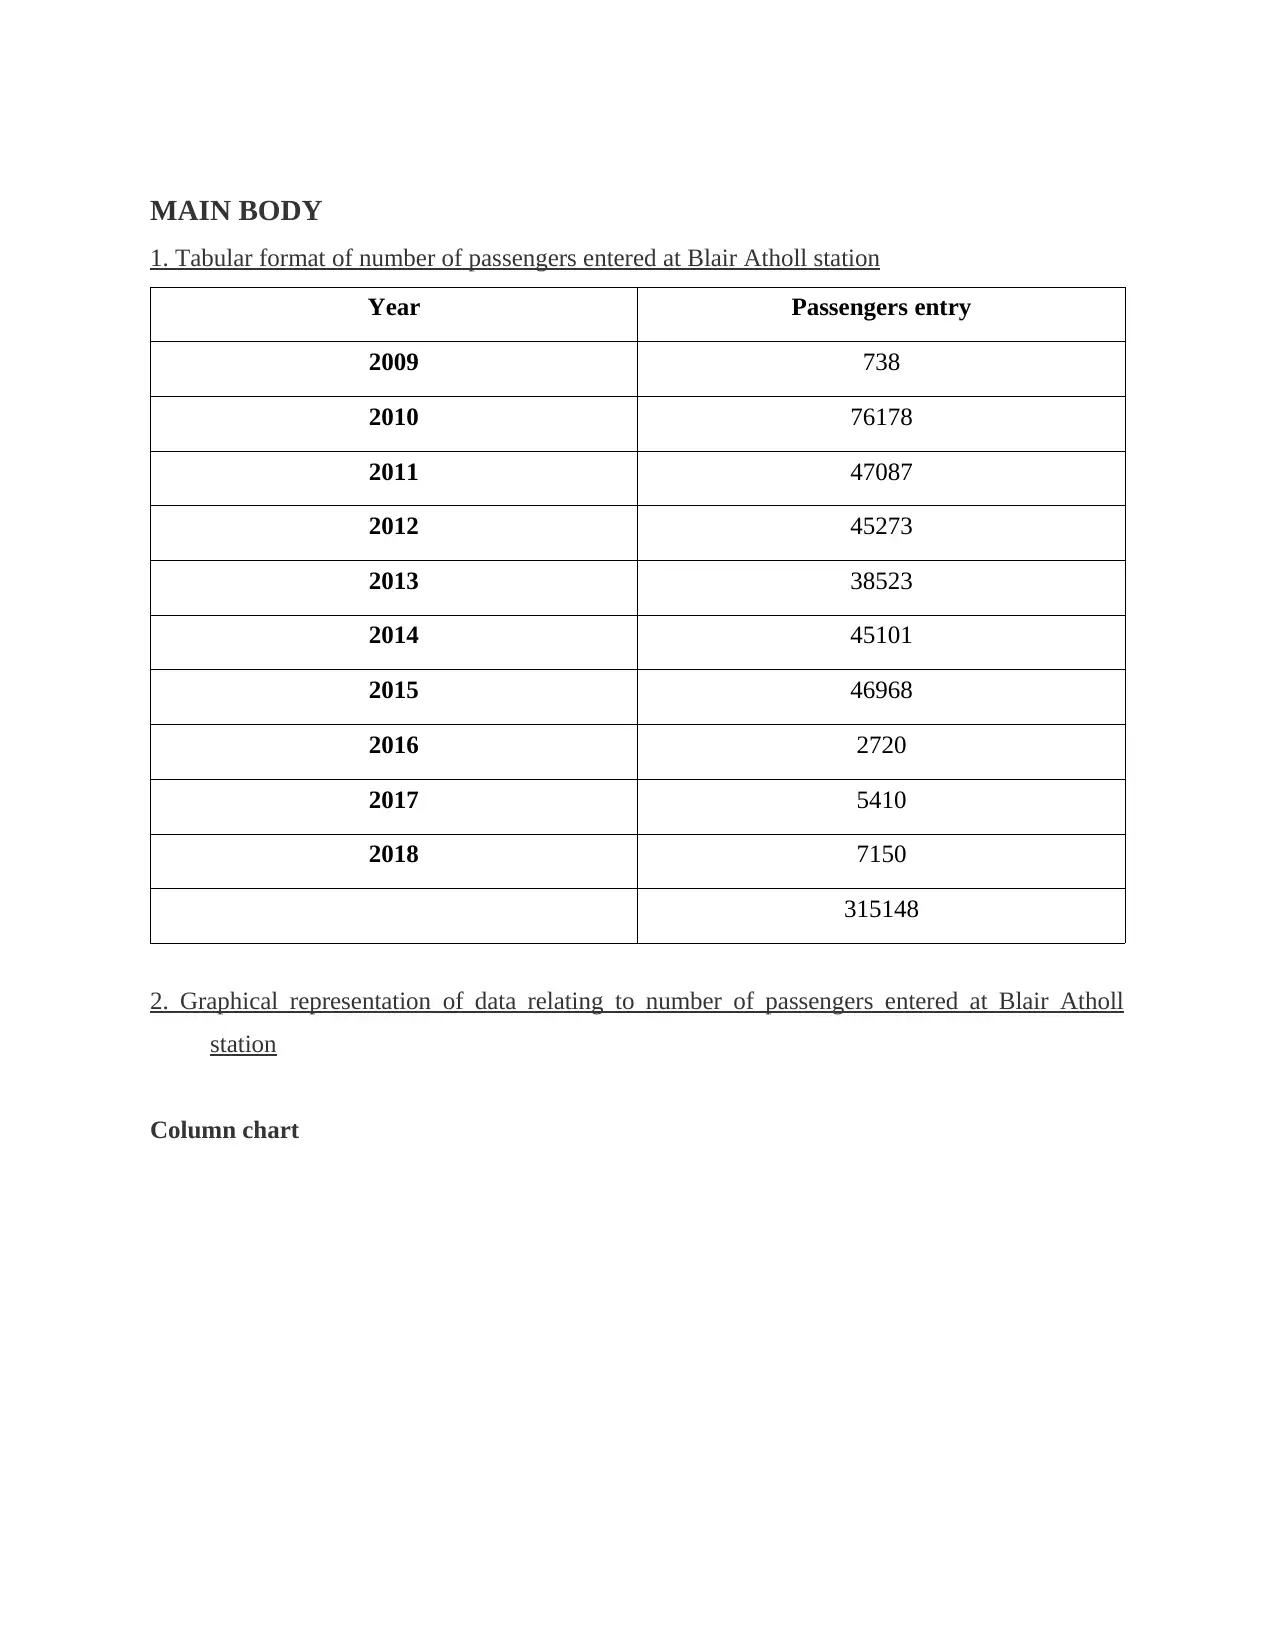
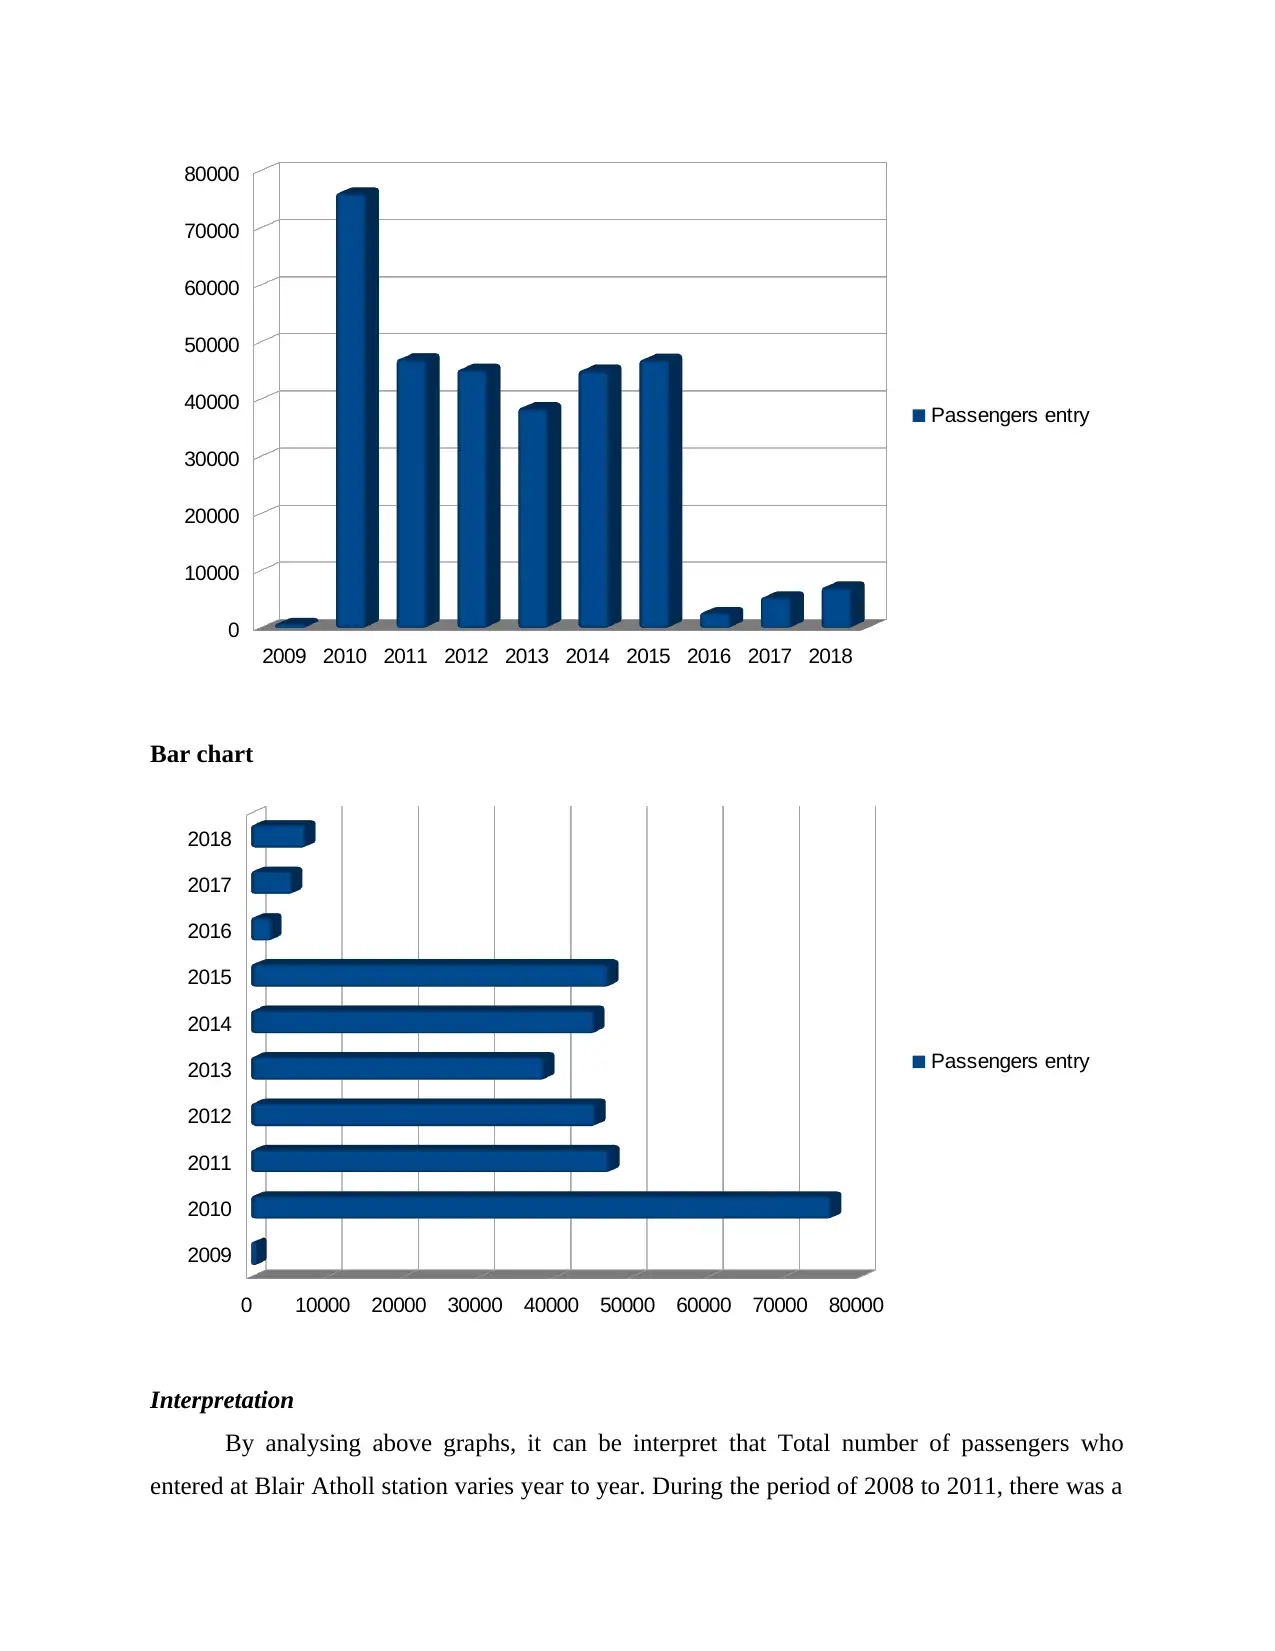
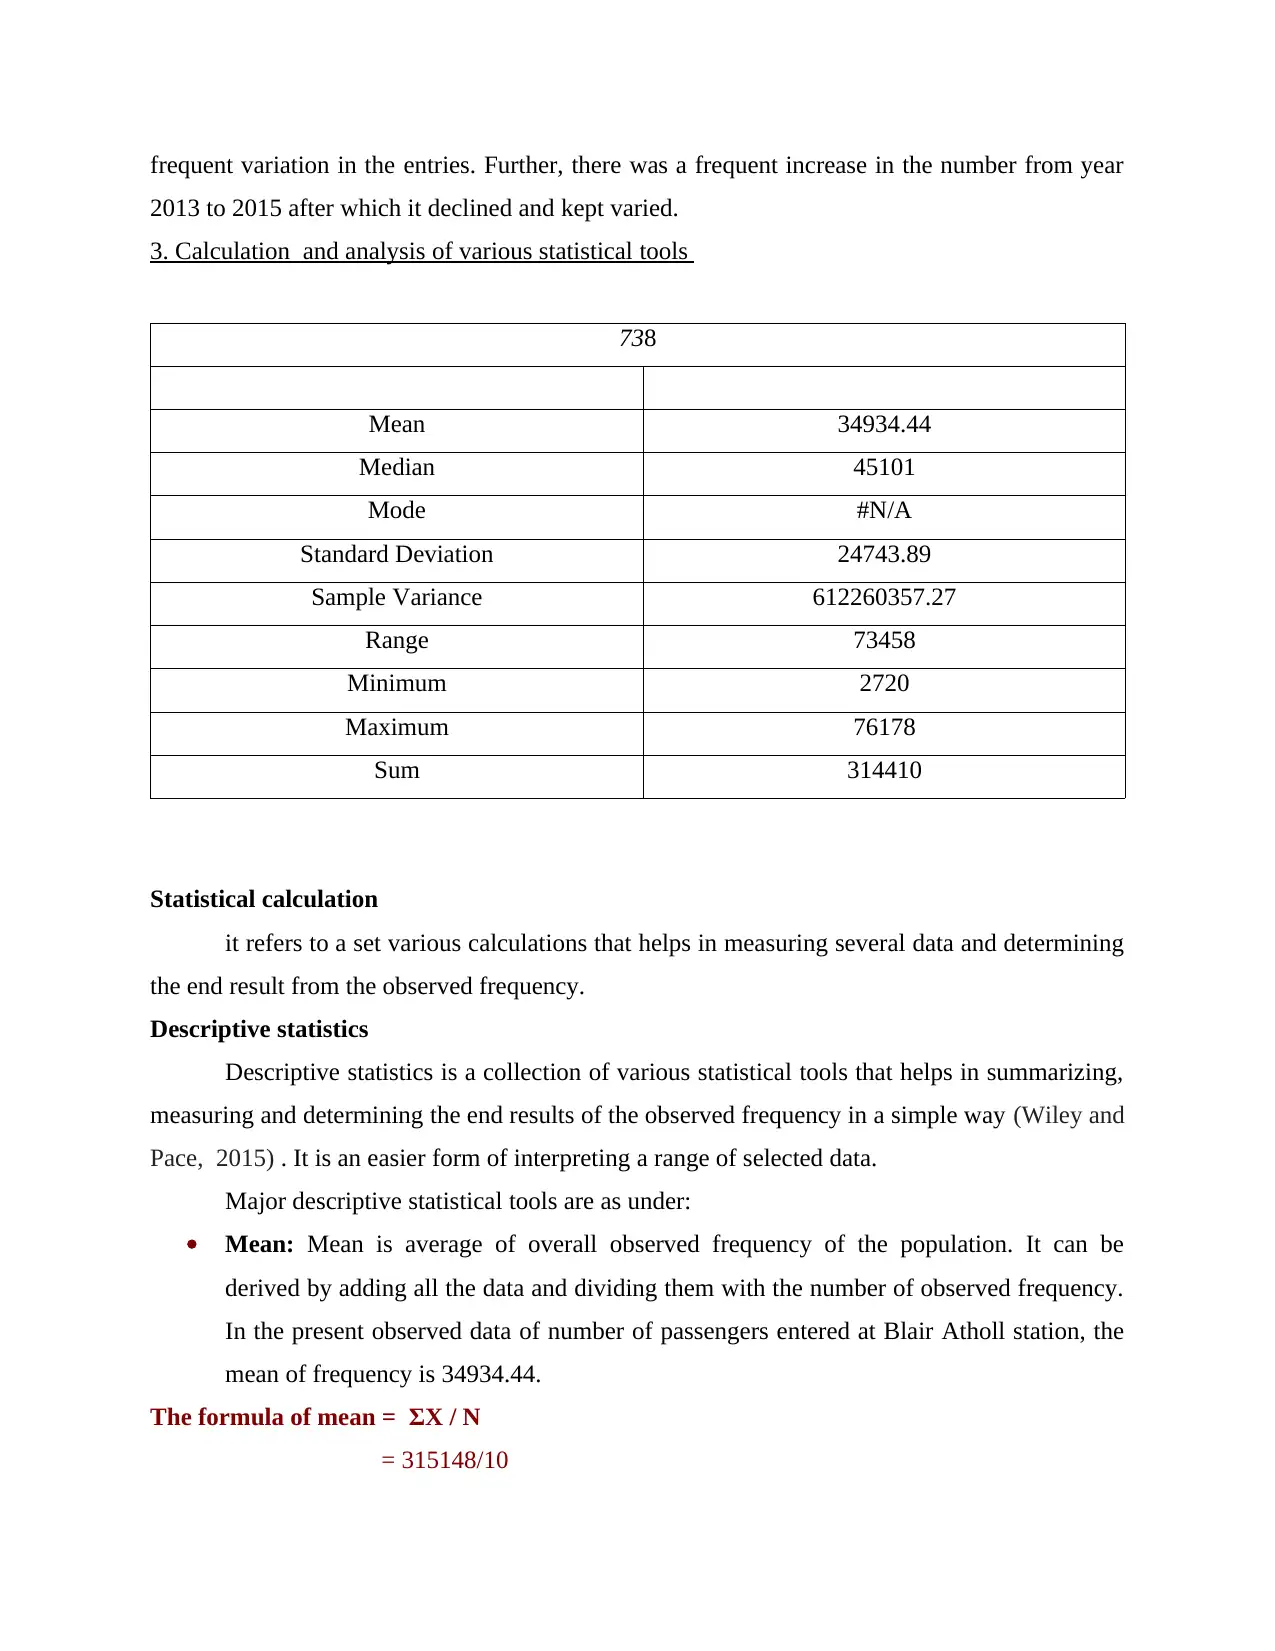
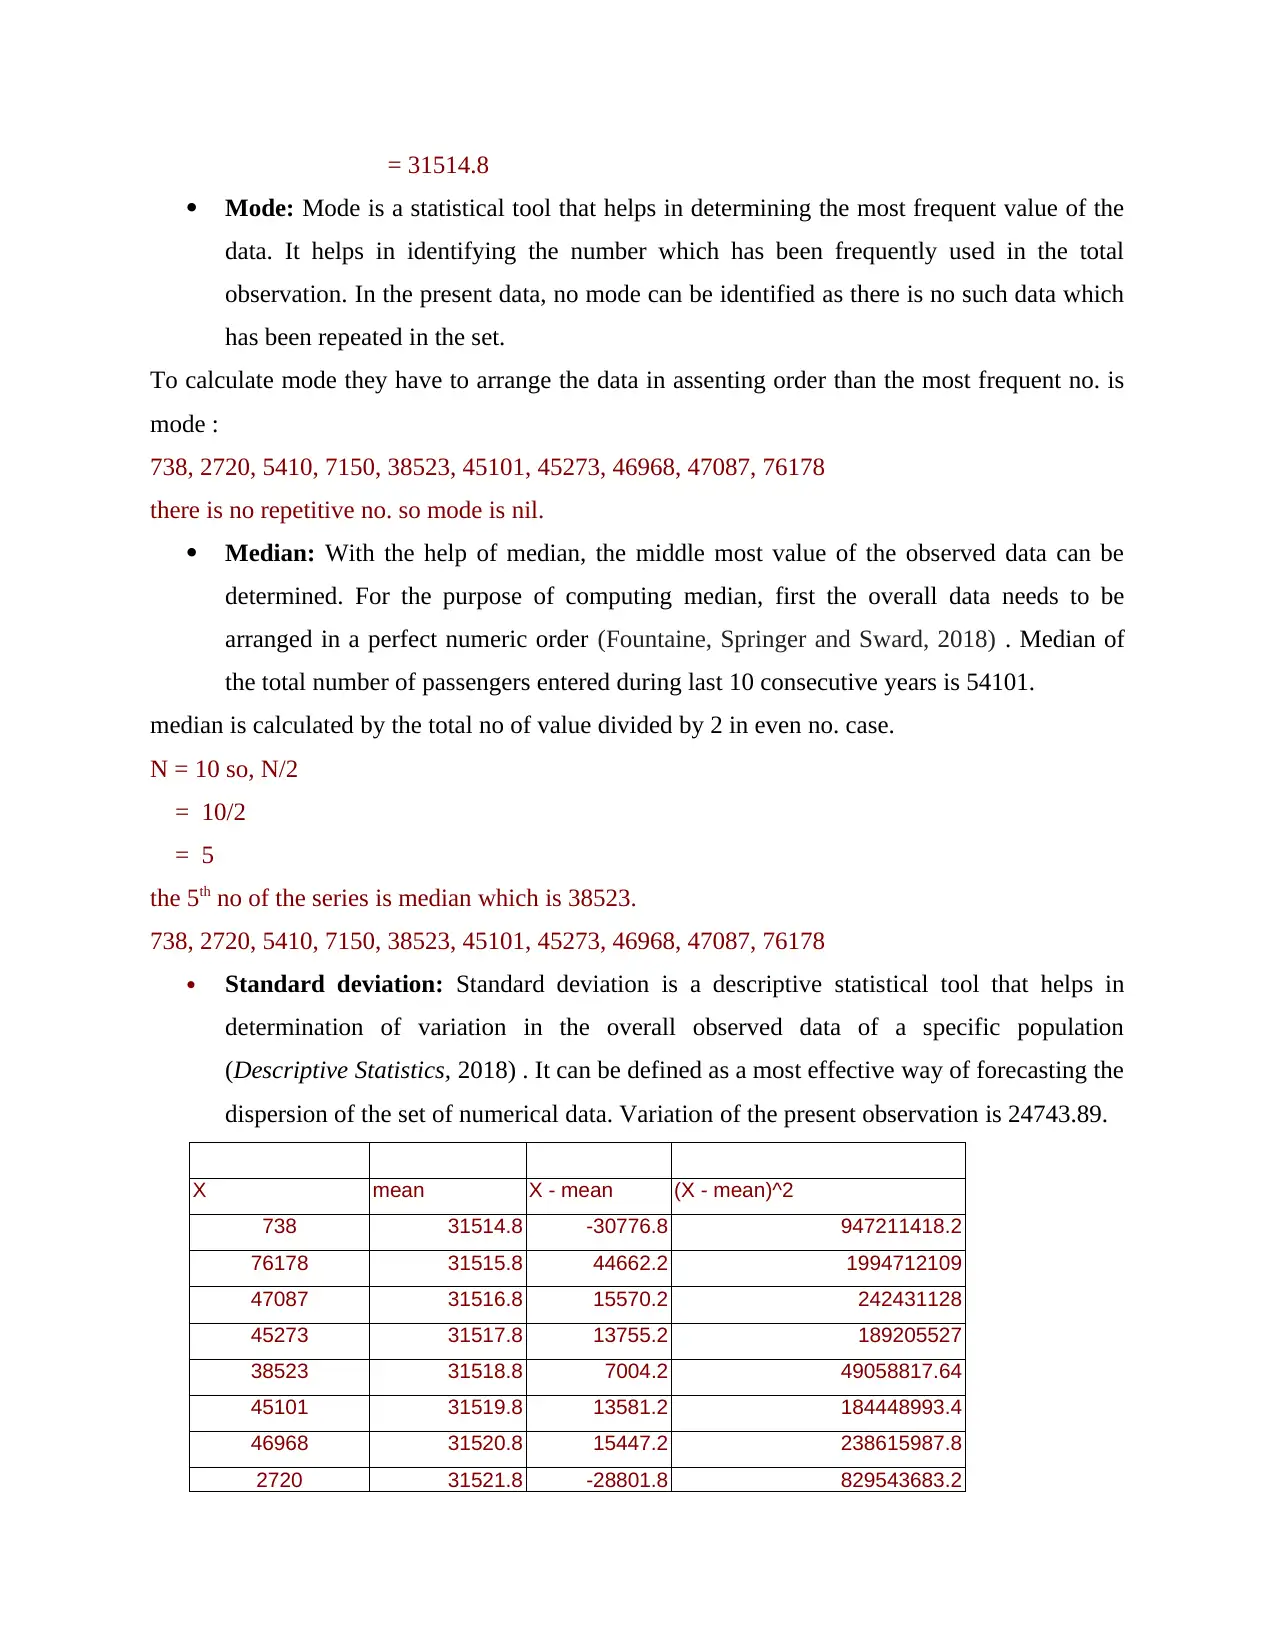
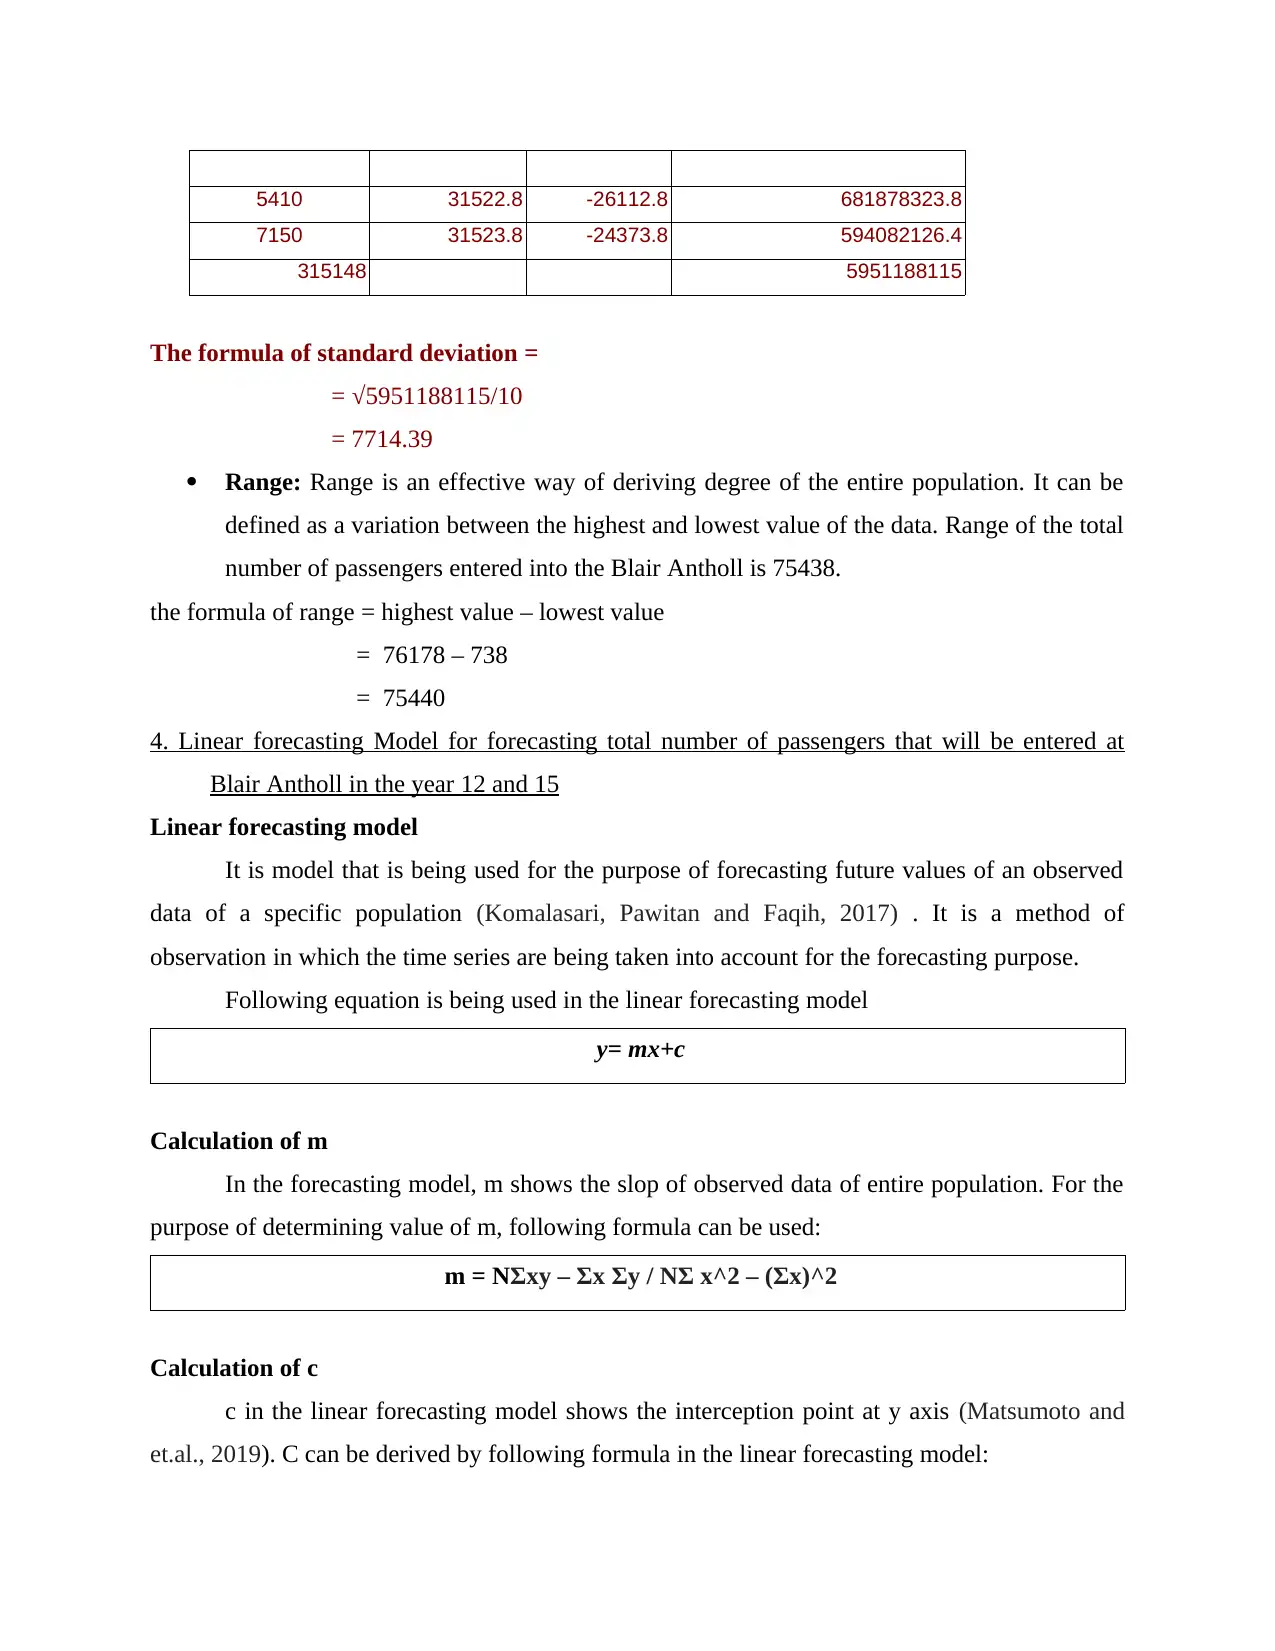
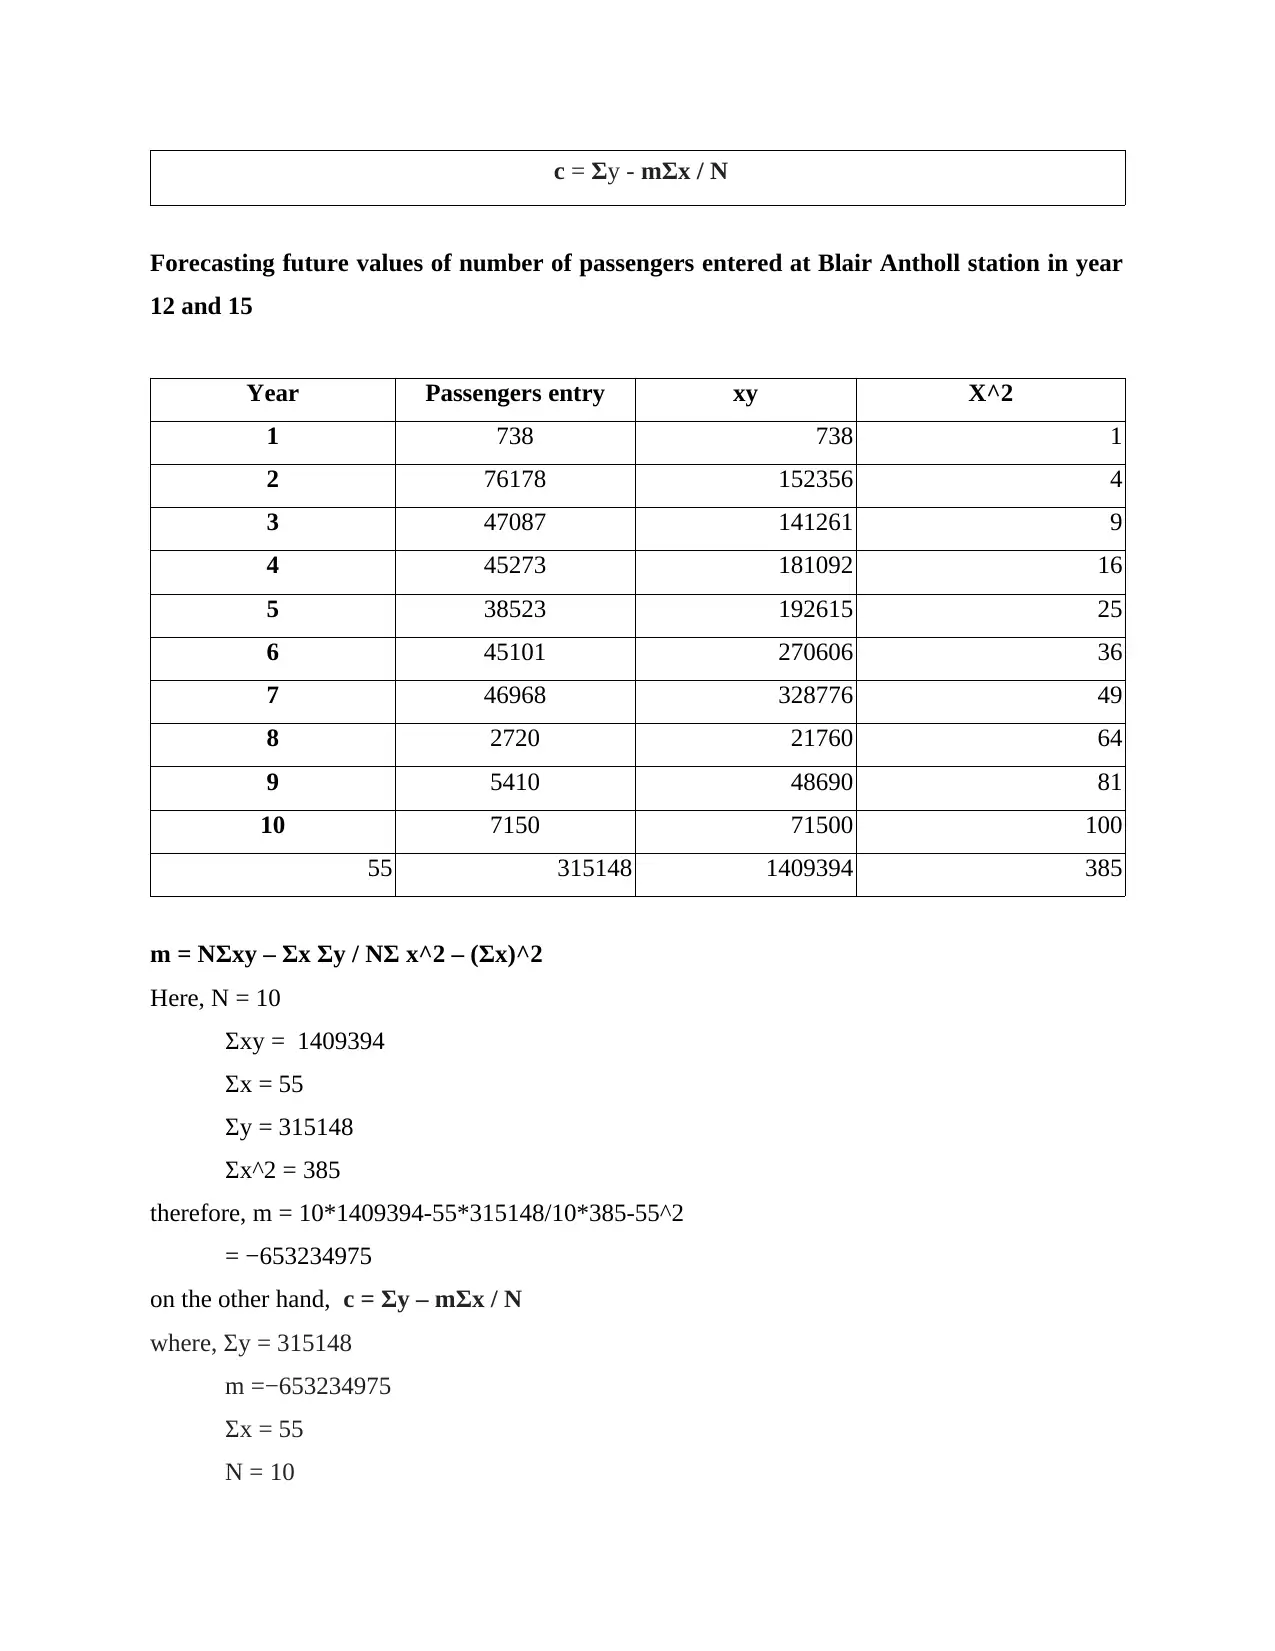
This assignment focuses on the analysis of passenger entry data at Blair Atholl station. It begins with presenting the data in a tabular format, followed by graphical representations (column and bar charts) to visualize trends. The assignment then delves into descriptive statistics, calculating and interpreting the mean, median, mode, standard deviation, and range. A key component involves the application of a linear forecasting model to predict the number of passengers for future years (years 12 and 15). The student calculates the necessary components of the model (m and c) and uses them to forecast passenger entries. The assignment concludes with a list of references. The analysis provides valuable insights into passenger traffic patterns and demonstrates the application of statistical techniques for data interpretation and forecasting. The student has contributed the assignment to Desklib, a platform which provides AI based study tools for students.
Document Page
Numeracy and Data Analysis
tabler-icon-diamond-filled.svg

Secure Best Marks with AI Grader

Need help grading? Try our AI Grader for instant feedback on your assignments.
Document Page
Table of Contents
`MAIN BODY.................................................................................................................................3
1. Tabular format of number of passengers entered at Blair Atholl station.................................3
2. Graphical representation of data relating to number of passengers entered at Blair Atholl
station...........................................................................................................................................3
3. Calculation and analysis of various statistical tools ..............................................................5
4. Linear forecasting Model for forecasting total number of passengers that will be entered at
Blair Antholl in the year 12 and 15..............................................................................................7
REFERENCES..............................................................................................................................10
Document Page
MAIN BODY
1. Tabular format of number of passengers entered at Blair Atholl station
Year Passengers entry
2009 738
2010 76178
2011 47087
2012 45273
2013 38523
2014 45101
2015 46968
2016 2720
2017 5410
2018 7150
315148
2. Graphical representation of data relating to number of passengers entered at Blair Atholl
station
Column chart
Document Page
Bar chart
Interpretation
By analysing above graphs, it can be interpret that Total number of passengers who
entered at Blair Atholl station varies year to year. During the period of 2008 to 2011, there was a
2009 2010 2011 2012 2013 2014 2015 2016 2017 2018
0
10000
20000
30000
40000
50000
60000
70000
80000
Passengers entry
2009
2010
2011
2012
2013
2014
2015
2016
2017
2018
0 10000 20000 30000 40000 50000 60000 70000 80000
Passengers entry
tabler-icon-diamond-filled.svg

Secure Best Marks with AI Grader

Need help grading? Try our AI Grader for instant feedback on your assignments.
Document Page
frequent variation in the entries. Further, there was a frequent increase in the number from year
2013 to 2015 after which it declined and kept varied.
3. Calculation and analysis of various statistical tools
738
Mean 34934.44
Median 45101
Mode #N/A
Standard Deviation 24743.89
Sample Variance 612260357.27
Range 73458
Minimum 2720
Maximum 76178
Sum 314410
Statistical calculation
it refers to a set various calculations that helps in measuring several data and determining
the end result from the observed frequency.
Descriptive statistics
Descriptive statistics is a collection of various statistical tools that helps in summarizing,
measuring and determining the end results of the observed frequency in a simple way (Wiley and
Pace, 2015) . It is an easier form of interpreting a range of selected data.
Major descriptive statistical tools are as under:
Mean: Mean is average of overall observed frequency of the population. It can be
derived by adding all the data and dividing them with the number of observed frequency.
In the present observed data of number of passengers entered at Blair Atholl station, the
mean of frequency is 34934.44.
The formula of mean = ΣX / N
= 315148/10
Document Page
= 31514.8
Mode: Mode is a statistical tool that helps in determining the most frequent value of the
data. It helps in identifying the number which has been frequently used in the total
observation. In the present data, no mode can be identified as there is no such data which
has been repeated in the set.
To calculate mode they have to arrange the data in assenting order than the most frequent no. is
mode :
738, 2720, 5410, 7150, 38523, 45101, 45273, 46968, 47087, 76178
there is no repetitive no. so mode is nil.
Median: With the help of median, the middle most value of the observed data can be
determined. For the purpose of computing median, first the overall data needs to be
arranged in a perfect numeric order (Fountaine, Springer and Sward, 2018) . Median of
the total number of passengers entered during last 10 consecutive years is 54101.
median is calculated by the total no of value divided by 2 in even no. case.
N = 10 so, N/2
= 10/2
= 5
the 5th no of the series is median which is 38523.
738, 2720, 5410, 7150, 38523, 45101, 45273, 46968, 47087, 76178
Standard deviation: Standard deviation is a descriptive statistical tool that helps in
determination of variation in the overall observed data of a specific population
(Descriptive Statistics, 2018) . It can be defined as a most effective way of forecasting the
dispersion of the set of numerical data. Variation of the present observation is 24743.89.
X mean X - mean (X - mean)^2
738 31514.8 -30776.8 947211418.2
76178 31515.8 44662.2 1994712109
47087 31516.8 15570.2 242431128
45273 31517.8 13755.2 189205527
38523 31518.8 7004.2 49058817.64
45101 31519.8 13581.2 184448993.4
46968 31520.8 15447.2 238615987.8
2720 31521.8 -28801.8 829543683.2
Document Page
5410 31522.8 -26112.8 681878323.8
7150 31523.8 -24373.8 594082126.4
315148 5951188115
The formula of standard deviation =
= 5951188115/10
= 7714.39
Range: Range is an effective way of deriving degree of the entire population. It can be
defined as a variation between the highest and lowest value of the data. Range of the total
number of passengers entered into the Blair Antholl is 75438.
the formula of range = highest value – lowest value
= 76178 – 738
= 75440
4. Linear forecasting Model for forecasting total number of passengers that will be entered at
Blair Antholl in the year 12 and 15
Linear forecasting model
It is model that is being used for the purpose of forecasting future values of an observed
data of a specific population (Komalasari, Pawitan and Faqih, 2017) . It is a method of
observation in which the time series are being taken into account for the forecasting purpose.
Following equation is being used in the linear forecasting model
y= mx+c
Calculation of m
In the forecasting model, m shows the slop of observed data of entire population. For the
purpose of determining value of m, following formula can be used:
m = NΣxy – Σx Σy / NΣ x^2 – (Σx)^2
Calculation of c
c in the linear forecasting model shows the interception point at y axis (Matsumoto and
et.al., 2019). C can be derived by following formula in the linear forecasting model:
tabler-icon-diamond-filled.svg

Paraphrase This Document

Need a fresh take? Get an instant paraphrase of this document with our AI Paraphraser
Document Page
c = Σy - mΣx / N
Forecasting future values of number of passengers entered at Blair Antholl station in year
12 and 15
Year Passengers entry xy X^2
1 738 738 1
2 76178 152356 4
3 47087 141261 9
4 45273 181092 16
5 38523 192615 25
6 45101 270606 36
7 46968 328776 49
8 2720 21760 64
9 5410 48690 81
10 7150 71500 100
55 315148 1409394 385
m = NΣxy – Σx Σy / NΣ x^2 – (Σx)^2
Here, N = 10
Σxy = 1409394
Σx = 55
Σy = 315148
Σx^2 = 385
therefore, m = 10*1409394-55*315148/10*385-55^2
= −653234975
on the other hand, c = Σy – mΣx / N
where, Σy = 315148
m =−653234975
Σx = 55
N = 10
Document Page
therefore, c = 315148-(−653234975*55)/10
= 3593107510.5
12 year forecasting of number of passengers entered at Blair Antholl station
Y = mX + c
m = −653234975
X = 12
c = 3593107510.5
therefore, Y= −653234975*12+3593107510.5
= −4245712189.5
15 year forecasting of number of passengers entered at Blair Antholl station
Y = mX + c
here, m = −653234975
X = 15
c = 3593107510.5
therefore, Y = −653234975*15+3593107510.5
= −6205417114.5
in this regard, it can be evaluated that the total number of passengers entered at Blair Antholl
station for year 12 will be −4245712189.5. on the other hand, it will be −6205417114.5 for the
year 15
Document Page
REFERENCES
Books and Journals
Ogdie, A., and et.al, 2019. SAT0397 DESCRIPTIVE COMPARISONS OF THE IMPACT OF
APREMILAST AND METHOTREXATE MONOTHERAPY ON PATIENTS WITH
OLIGOARTICULAR PSORIATIC ARTHRITIS IN THE CORRONA PSORIATIC
ARTHRITIS/SPONDYLOARTHRITIS REGISTRY.
Wiley, J. F. and Pace, L. A., 2015. Descriptive statistics and exploratory data analysis.
In Beginning R (pp. 73-80). Apress, Berkeley, CA.
Fountaine, C. J., Springer, E. J. and Sward, J. R., 2018. A descriptive study of objectively
measured Pokémon GO playtime in college students. International journal of exercise
science, 11(7), p.526.
Komalasari, K. E., Pawitan, H. and Faqih, A., 2017, March. Descriptive Statistics and Cluster
Analysis for Extreme Rainfall in Java Island. In IOP Conference Series: Earth and
Environmental Science (Vol. 58, No. 1, p. 012039). IOP Publishing.
Matsumoto, S. and et.al., 2019. Resuscitative Endovascular Balloon Occlusion of the Aorta
(REBOA) for Severe Torso Trauma in Japan: A Descriptive Study. World journal of
surgery, pp.1-8.
Online
Descriptive Statistics. 2018. [Online]. Available through :
<https://socialresearchmethods.net/kb/statdesc.php>
chevron_up_icon
1 out of 10
circle_padding
hide_on_mobile
zoom_out_icon
[object Object]