Health Services Planning: Analysis of Patient Reported Complications
VerifiedAdded on 2023/06/11
|27
|5715
|378
Report
AI Summary
This report analyzes patient-reported complications from Liverpool, Gosford, and St. George hospitals to inform health service planning and reduce complication rates. Data from 2015 and 2016 were analyzed, considering patient age, country of birth, and pre-existing conditions. Common complications included infections, surgical issues, and medication reactions. Liverpool Hospital had the highest infection rates, and all three hospitals exceeded the New South Wales state average for complications. The report compares data with external research and suggests strategies such as improved hygiene, pre-operative risk assessments, post-operative care, surgical safety checklists, and self-reporting systems to mitigate complications and improve patient outcomes. The goal is to provide evidence-based advice to the Health Minister for effective intervention and improved quality of care.
Planning and Evaluation Health Services
Author
Institutional Affiliations
Author
Institutional Affiliations
Paraphrase This Document
Need a fresh take? Get an instant paraphrase of this document with our AI Paraphraser
PLANNING AND EVALUATION HEALTH SERVICES 2
Executive Summary
In this assignment, the focus was on three hospitals namely Liverpool hospital, Gosford
hospital and St. George hospital. The assignment involved collecting data about the six worst
patient complications from the three hospitals. The patient's age, country of birth and the long-
standing health condition were some of the important details that the patient’s data included.
Data was analyzed using Excel and presented in form of graphs and table. The data was then
compared with that from New South Wales state averages. The common complications in the
study included infection, surgery complications, and negative reaction to medication,
uncontrolled bleeding, blood clots, pressure wounds and X-ray and tests complications.
Infections were the most common complications with Liverpool having the highest prevalence.
The complications rate was high in all the three hospitals as compared to the New South Wales
State averages (15%). The analyzed data was then compared with results from other published
research papers and other professional reports. Advice was generated to reduce the cases of
complication based on the evidence about what could be causing the complications. Proper
hygiene, patient assessment for risk of surgery complications prior to surgery, post operative
care, surgical safety checklist and self reporting system were found to be some of the most
effective strategies to the complication problems.
Introduction
Hospital reported patient complication refers to the health-related problems that patients
develop while undergoing care in the hospital. These complications can be reduced through
strategies for clinical risk mitigation. These complications result from care services such as
surgeries causing patients to spend a long time in the hospital and also increase the rate of
PLANNING AND EVALUATION HEALTH SERVICES 3
readmission. Hospitals in Australia have had strikingly high rates of hospital complications and
have been trying to reduce them with no success. The rates at which the complications occur
vary across the different hospitals.
Some hospitals succeed in lowering some complications but fail in others. In order to
come up with effective strategies to reduce these complications, data from across different
hospitals should be collected and compared. The success of a certain hospital in reducing a
certain complication should act as a guide for other hospitals to emulate. Such complications
include infection during the time of admission or after, adverse medication reactions,
uncontrolled bleeding during the stay in hospital or a short time after discharge from the hospital,
x-ray or test complications, surgery complications, bed sore or pressure wounds, blood clots
among others. The hospitals set a target to reduce the instance of complications and improve the
quality of care in the hospital. The health ministry should be at the forefront to ensure a reduction
in the cases of patient-reported hospital complications.
Data
In the study, the first hospital to be explored is Liverpool. In this exploration patient’s
variables such as nation of birth, age and preexisting medical condition will be used to collect the
data. On the age, the respondent population is stratified into four age groups. The first age group
comprises of patients between the age of 18 to 35 followed by 35-54, 55-74 and finally those
above the age of 75. According to the country of birth, respondent is categorized as either born in
Australia or not born in Australia. The final category is the presence of preexisting medical
condition where the respondent either has any of the condition or does not have. The data for
both the year 2015 and 2016 were analyzed.
⊘ This is a preview!⊘
Do you want full access?
Subscribe today to unlock all pages.
Trusted by 1+ million students worldwide
PLANNING AND EVALUATION HEALTH SERVICES 4
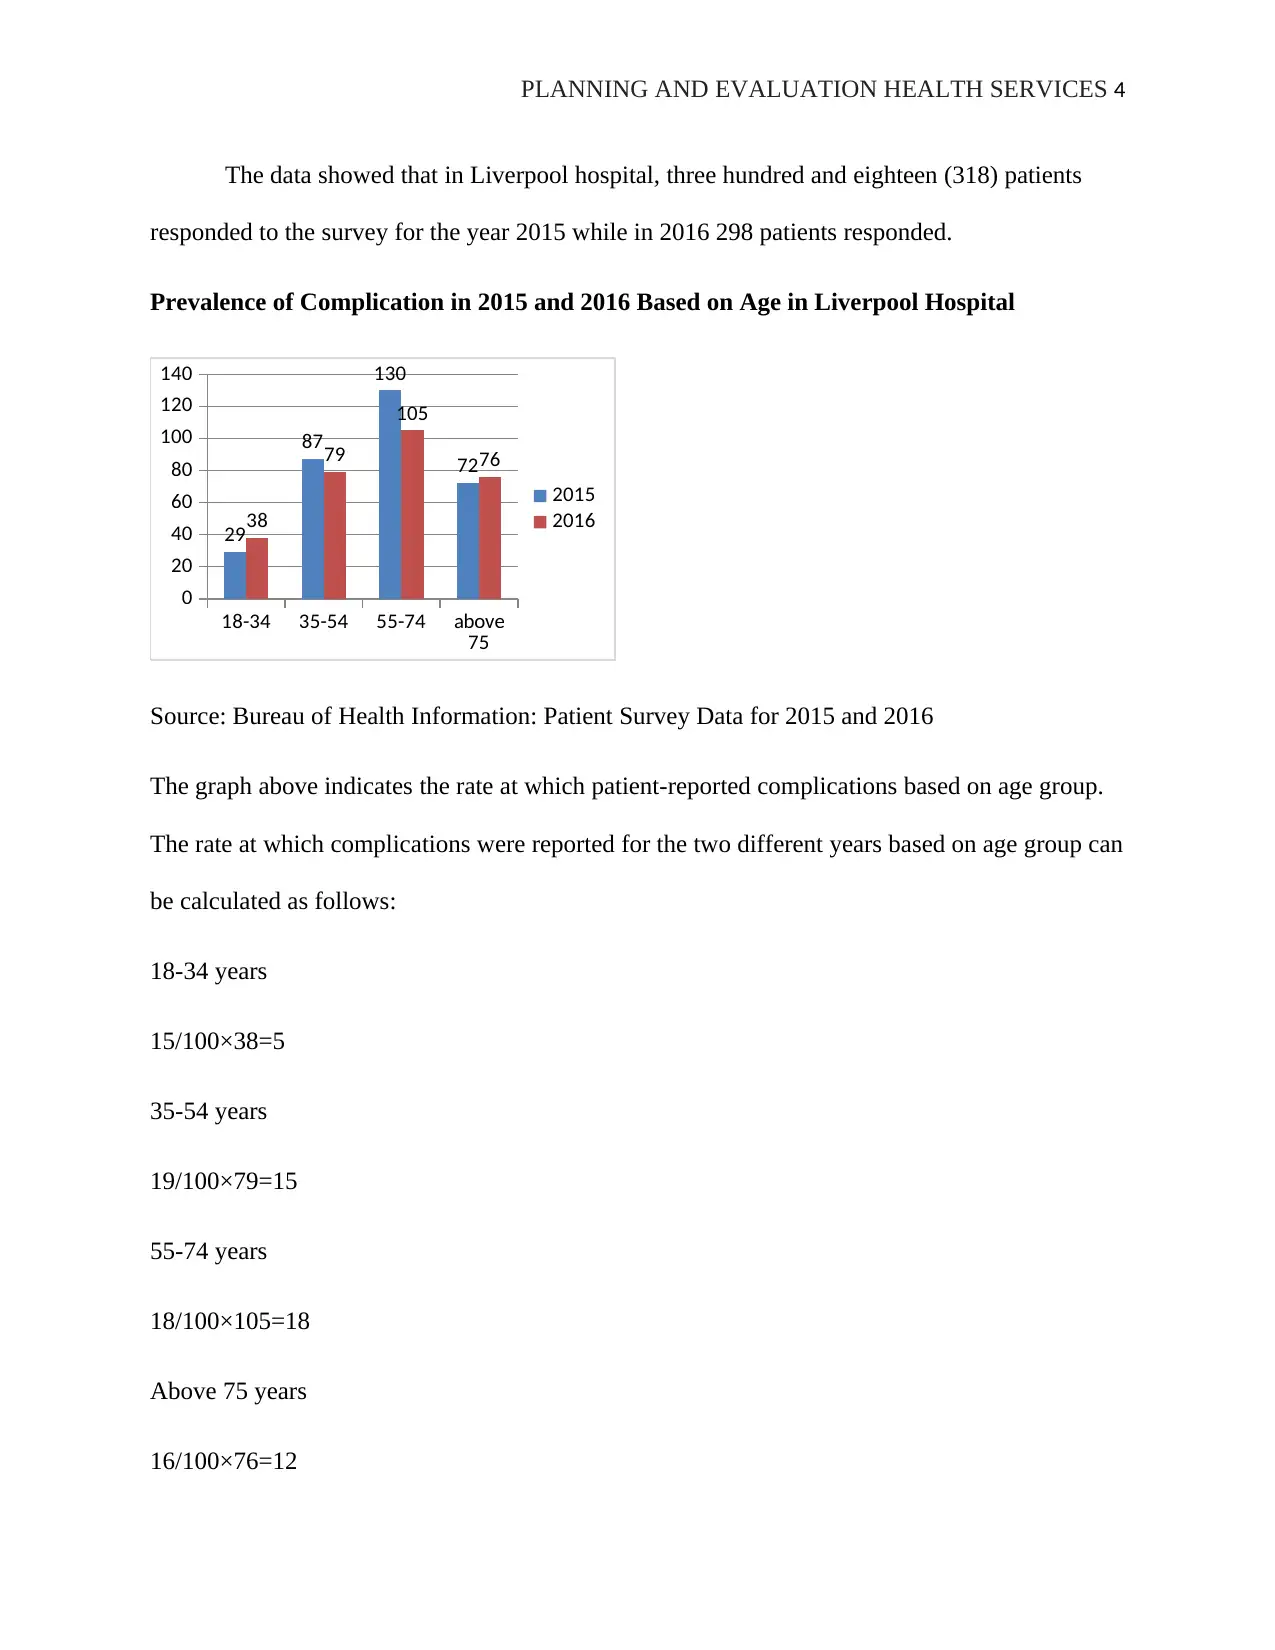
The data showed that in Liverpool hospital, three hundred and eighteen (318) patients
responded to the survey for the year 2015 while in 2016 298 patients responded.
Prevalence of Complication in 2015 and 2016 Based on Age in Liverpool Hospital
18-34 35-54 55-74 above
75
0
20
40
60
80
100
120
140
29
87
130
72
38
79
105
76
2015
2016
Source: Bureau of Health Information: Patient Survey Data for 2015 and 2016
The graph above indicates the rate at which patient-reported complications based on age group.
The rate at which complications were reported for the two different years based on age group can
be calculated as follows:
18-34 years
15/100×38=5
35-54 years
19/100×79=15
55-74 years
18/100×105=18
Above 75 years
16/100×76=12
Paraphrase This Document
Need a fresh take? Get an instant paraphrase of this document with our AI Paraphraser
PLANNING AND EVALUATION HEALTH SERVICES 5
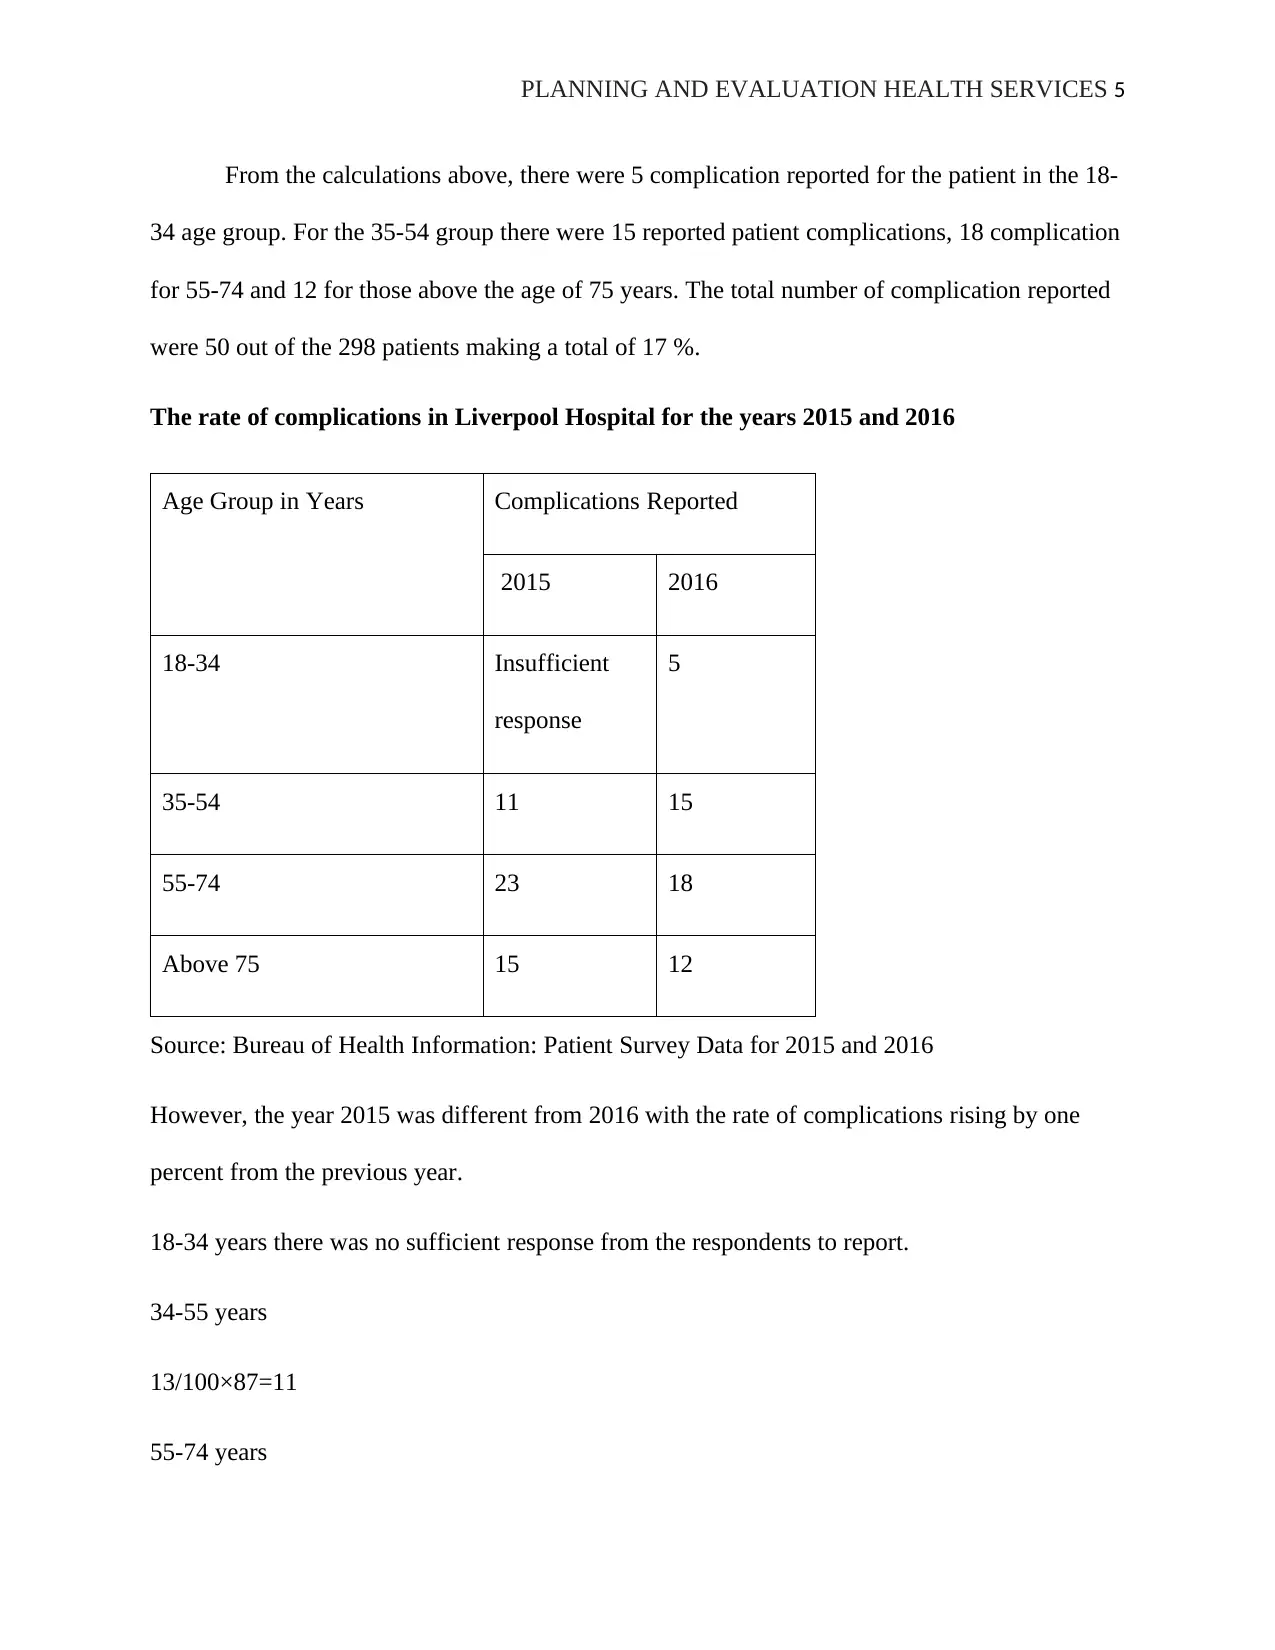
From the calculations above, there were 5 complication reported for the patient in the 18-
34 age group. For the 35-54 group there were 15 reported patient complications, 18 complication
for 55-74 and 12 for those above the age of 75 years. The total number of complication reported
were 50 out of the 298 patients making a total of 17 %.
The rate of complications in Liverpool Hospital for the years 2015 and 2016
Age Group in Years Complications Reported
2015 2016
18-34 Insufficient
response
5
35-54 11 15
55-74 23 18
Above 75 15 12
Source: Bureau of Health Information: Patient Survey Data for 2015 and 2016
However, the year 2015 was different from 2016 with the rate of complications rising by one
percent from the previous year.
18-34 years there was no sufficient response from the respondents to report.
34-55 years
13/100×87=11
55-74 years
PLANNING AND EVALUATION HEALTH SERVICES 6
18/100×130=23
Above 75 years
22/100×72=15
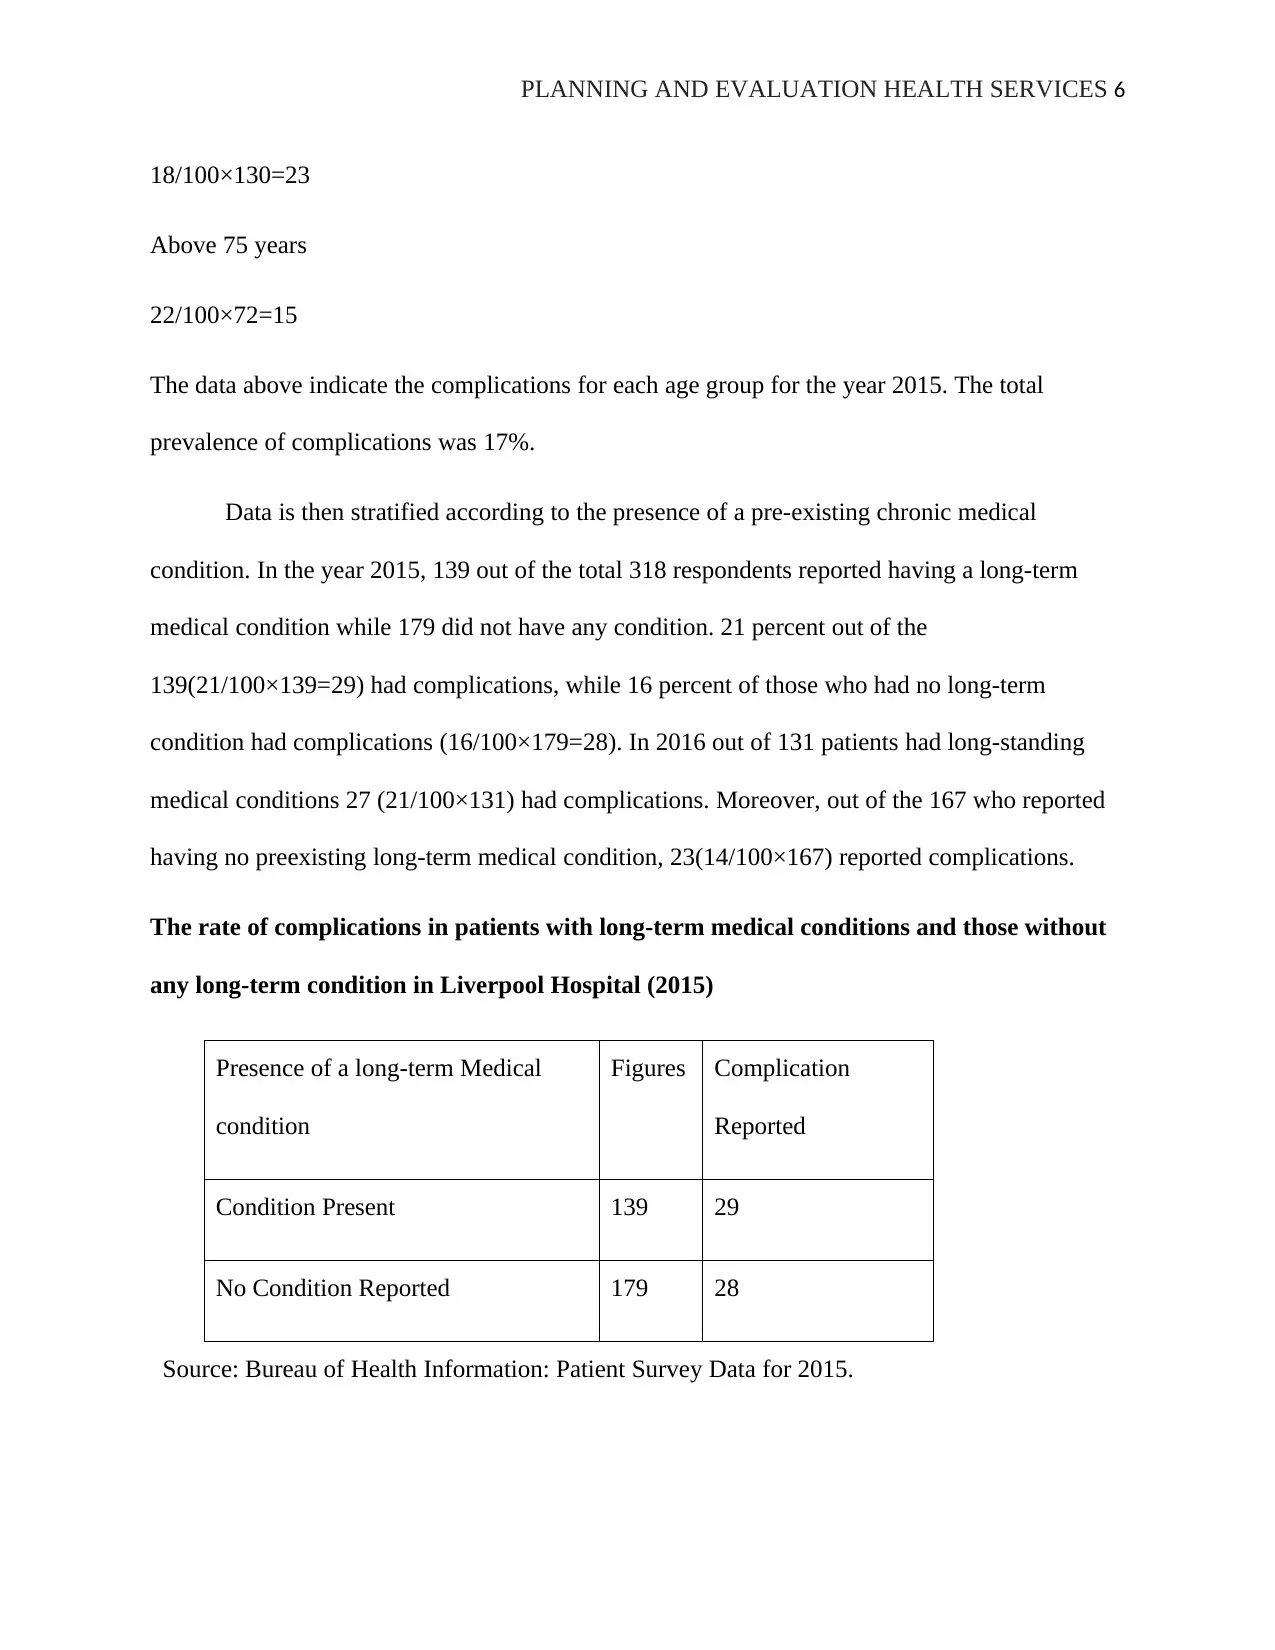
The data above indicate the complications for each age group for the year 2015. The total
prevalence of complications was 17%.
Data is then stratified according to the presence of a pre-existing chronic medical
condition. In the year 2015, 139 out of the total 318 respondents reported having a long-term
medical condition while 179 did not have any condition. 21 percent out of the
139(21/100×139=29) had complications, while 16 percent of those who had no long-term
condition had complications (16/100×179=28). In 2016 out of 131 patients had long-standing
medical conditions 27 (21/100×131) had complications. Moreover, out of the 167 who reported
having no preexisting long-term medical condition, 23(14/100×167) reported complications.
The rate of complications in patients with long-term medical conditions and those without
any long-term condition in Liverpool Hospital (2015)
Presence of a long-term Medical
condition
Figures Complication
Reported
Condition Present 139 29
No Condition Reported 179 28
Source: Bureau of Health Information: Patient Survey Data for 2015.
18/100×130=23
Above 75 years
22/100×72=15
The data above indicate the complications for each age group for the year 2015. The total
prevalence of complications was 17%.
Data is then stratified according to the presence of a pre-existing chronic medical
condition. In the year 2015, 139 out of the total 318 respondents reported having a long-term
medical condition while 179 did not have any condition. 21 percent out of the
139(21/100×139=29) had complications, while 16 percent of those who had no long-term
condition had complications (16/100×179=28). In 2016 out of 131 patients had long-standing
medical conditions 27 (21/100×131) had complications. Moreover, out of the 167 who reported
having no preexisting long-term medical condition, 23(14/100×167) reported complications.
The rate of complications in patients with long-term medical conditions and those without
any long-term condition in Liverpool Hospital (2015)
Presence of a long-term Medical
condition
Figures Complication
Reported
Condition Present 139 29
No Condition Reported 179 28
Source: Bureau of Health Information: Patient Survey Data for 2015.
⊘ This is a preview!⊘
Do you want full access?
Subscribe today to unlock all pages.
Trusted by 1+ million students worldwide
PLANNING AND EVALUATION HEALTH SERVICES 7
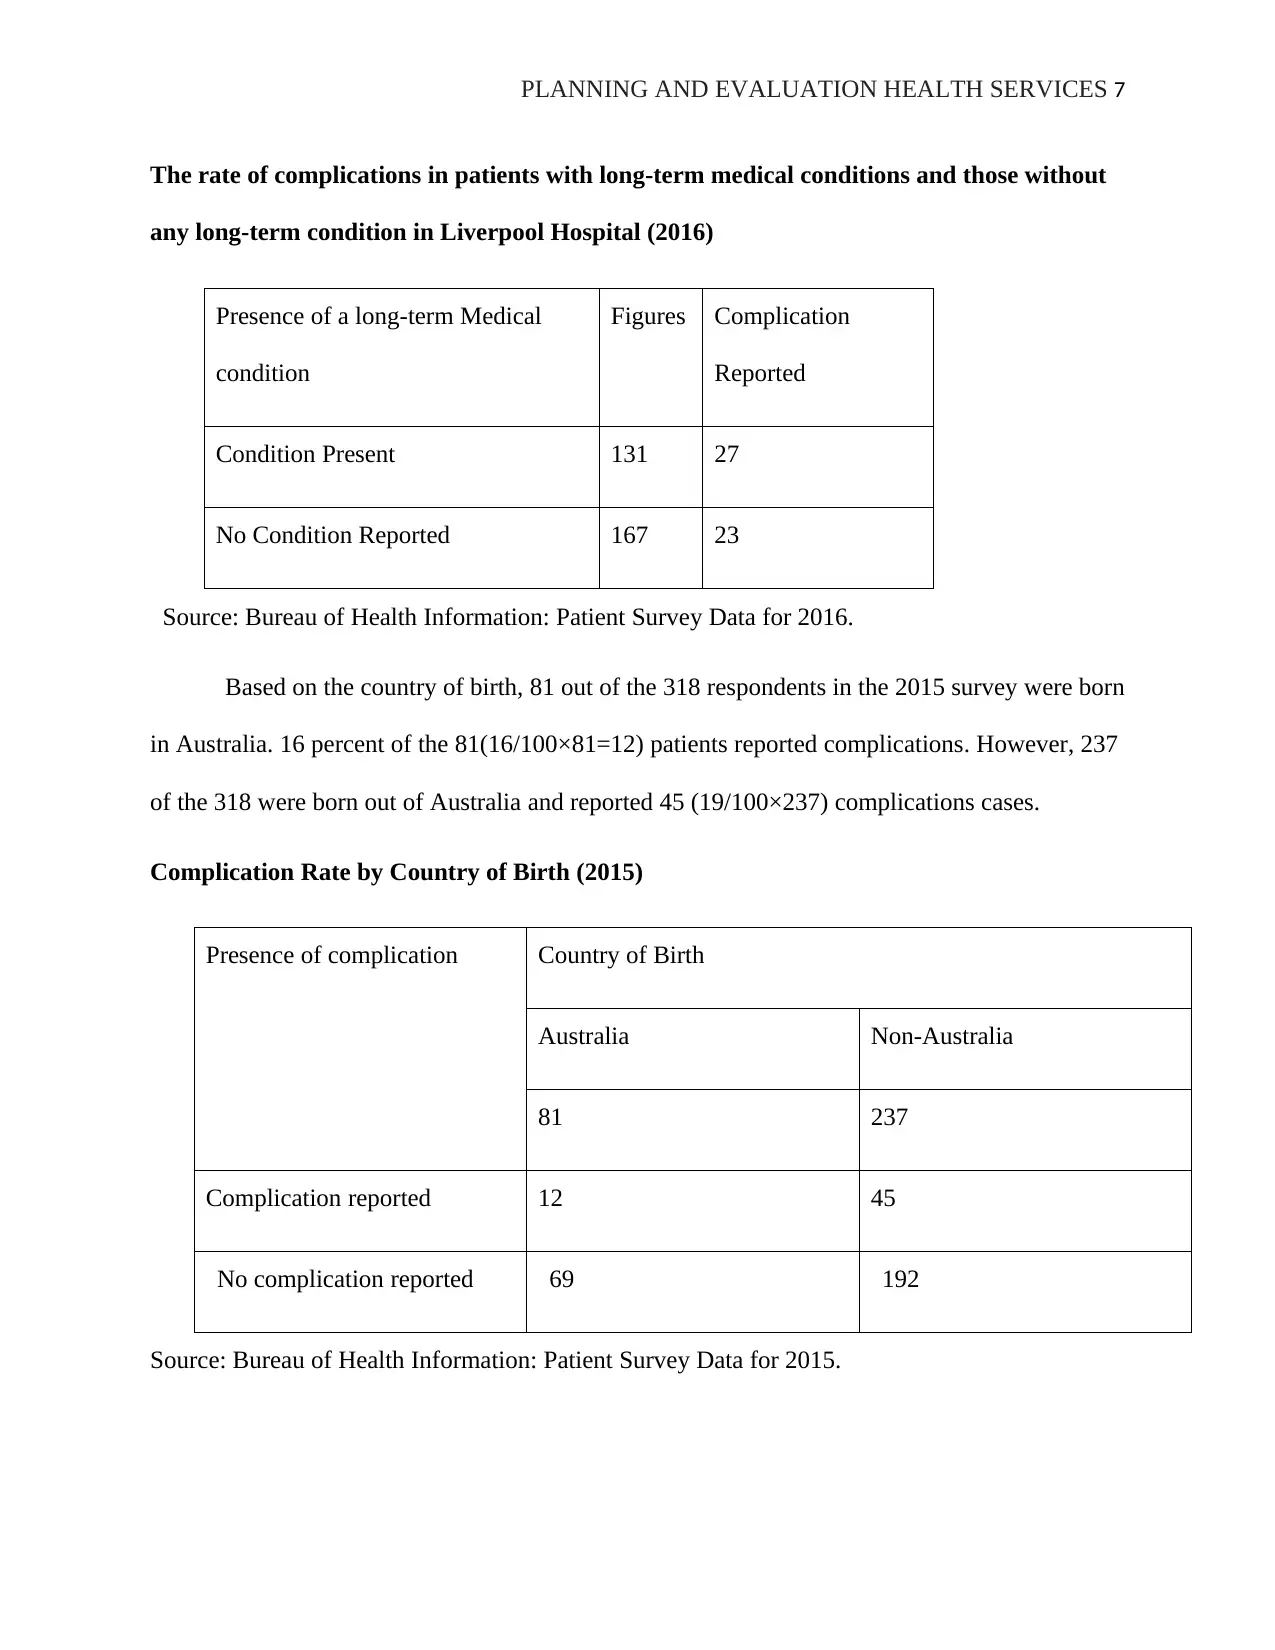
The rate of complications in patients with long-term medical conditions and those without
any long-term condition in Liverpool Hospital (2016)
Presence of a long-term Medical
condition
Figures Complication
Reported
Condition Present 131 27
No Condition Reported 167 23
Source: Bureau of Health Information: Patient Survey Data for 2016.
Based on the country of birth, 81 out of the 318 respondents in the 2015 survey were born
in Australia. 16 percent of the 81(16/100×81=12) patients reported complications. However, 237
of the 318 were born out of Australia and reported 45 (19/100×237) complications cases.
Complication Rate by Country of Birth (2015)
Presence of complication Country of Birth
Australia Non-Australia
81 237
Complication reported 12 45
No complication reported 69 192
Source: Bureau of Health Information: Patient Survey Data for 2015.
Paraphrase This Document
Need a fresh take? Get an instant paraphrase of this document with our AI Paraphraser
PLANNING AND EVALUATION HEALTH SERVICES 8
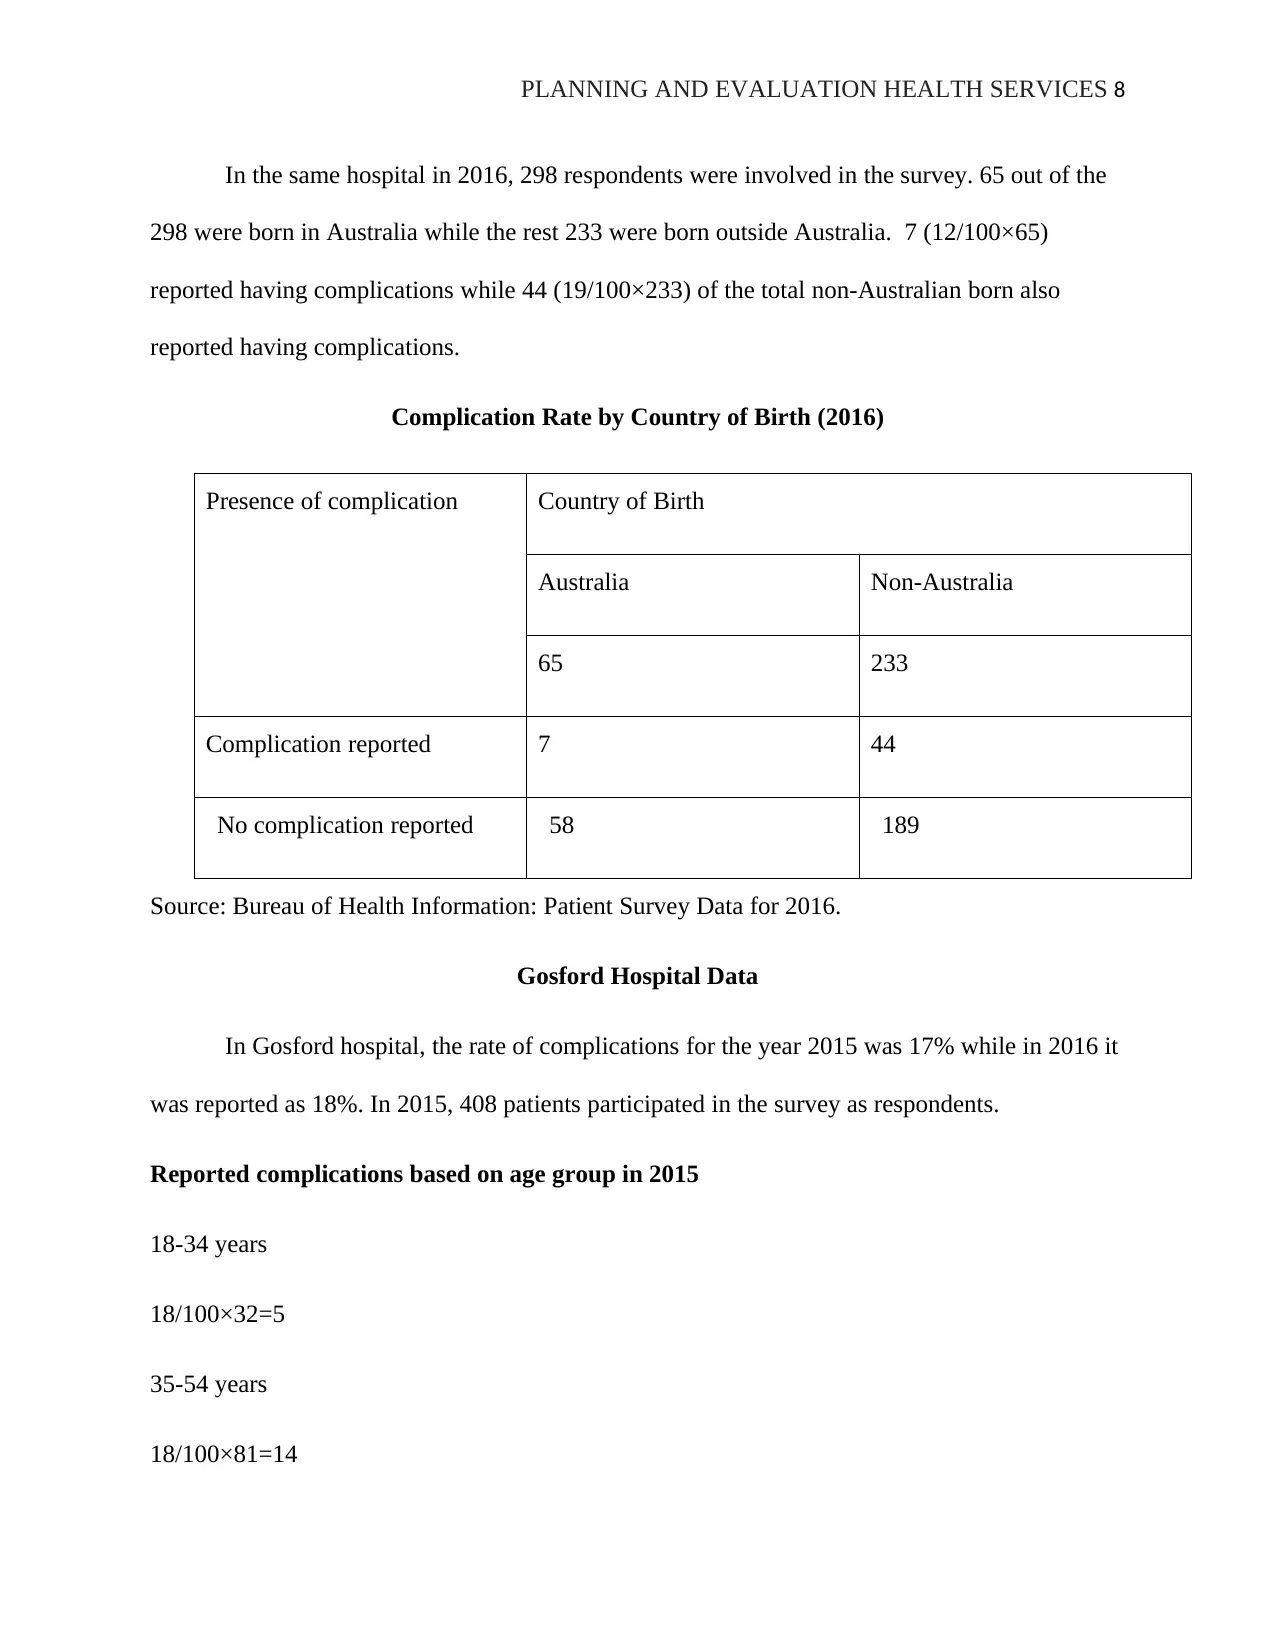
In the same hospital in 2016, 298 respondents were involved in the survey. 65 out of the
298 were born in Australia while the rest 233 were born outside Australia. 7 (12/100×65)
reported having complications while 44 (19/100×233) of the total non-Australian born also
reported having complications.
Complication Rate by Country of Birth (2016)
Presence of complication Country of Birth
Australia Non-Australia
65 233
Complication reported 7 44
No complication reported 58 189
Source: Bureau of Health Information: Patient Survey Data for 2016.
Gosford Hospital Data
In Gosford hospital, the rate of complications for the year 2015 was 17% while in 2016 it
was reported as 18%. In 2015, 408 patients participated in the survey as respondents.
Reported complications based on age group in 2015
18-34 years
18/100×32=5
35-54 years
18/100×81=14
PLANNING AND EVALUATION HEALTH SERVICES 9
55-74 years
17/100×157=26
Above 75 years
14/100×138=19
32 of the respondent were between the age of 18-34, 81 between 35-54, 157 between 55-74 and
138 above the age of 75 years. In the 18-34 age group 5 reported complications. In 35-54 age
group 14 reported experiencing complications. On the other hand the 55-74 age group had 157
respondent and only 26 reported experiencing complications. The final category of those above
75 years of age only 19 reported complications.
Reported complications based on age group in 2016
18-34 years
Insufficient response
35-54 years
20/100×69=13
55-74 years
15/100×150=22
Above 75 years
14/100×159=22
As the calculations above show, in 2016, there 404 respondents of which 26 of the
respondent were between the age of 18-34, 69 between 35-54, 150 between 55-74 and 159 above
55-74 years
17/100×157=26
Above 75 years
14/100×138=19
32 of the respondent were between the age of 18-34, 81 between 35-54, 157 between 55-74 and
138 above the age of 75 years. In the 18-34 age group 5 reported complications. In 35-54 age
group 14 reported experiencing complications. On the other hand the 55-74 age group had 157
respondent and only 26 reported experiencing complications. The final category of those above
75 years of age only 19 reported complications.
Reported complications based on age group in 2016
18-34 years
Insufficient response
35-54 years
20/100×69=13
55-74 years
15/100×150=22
Above 75 years
14/100×159=22
As the calculations above show, in 2016, there 404 respondents of which 26 of the
respondent were between the age of 18-34, 69 between 35-54, 150 between 55-74 and 159 above
⊘ This is a preview!⊘
Do you want full access?
Subscribe today to unlock all pages.
Trusted by 1+ million students worldwide
PLANNING AND EVALUATION HEALTH SERVICES 10
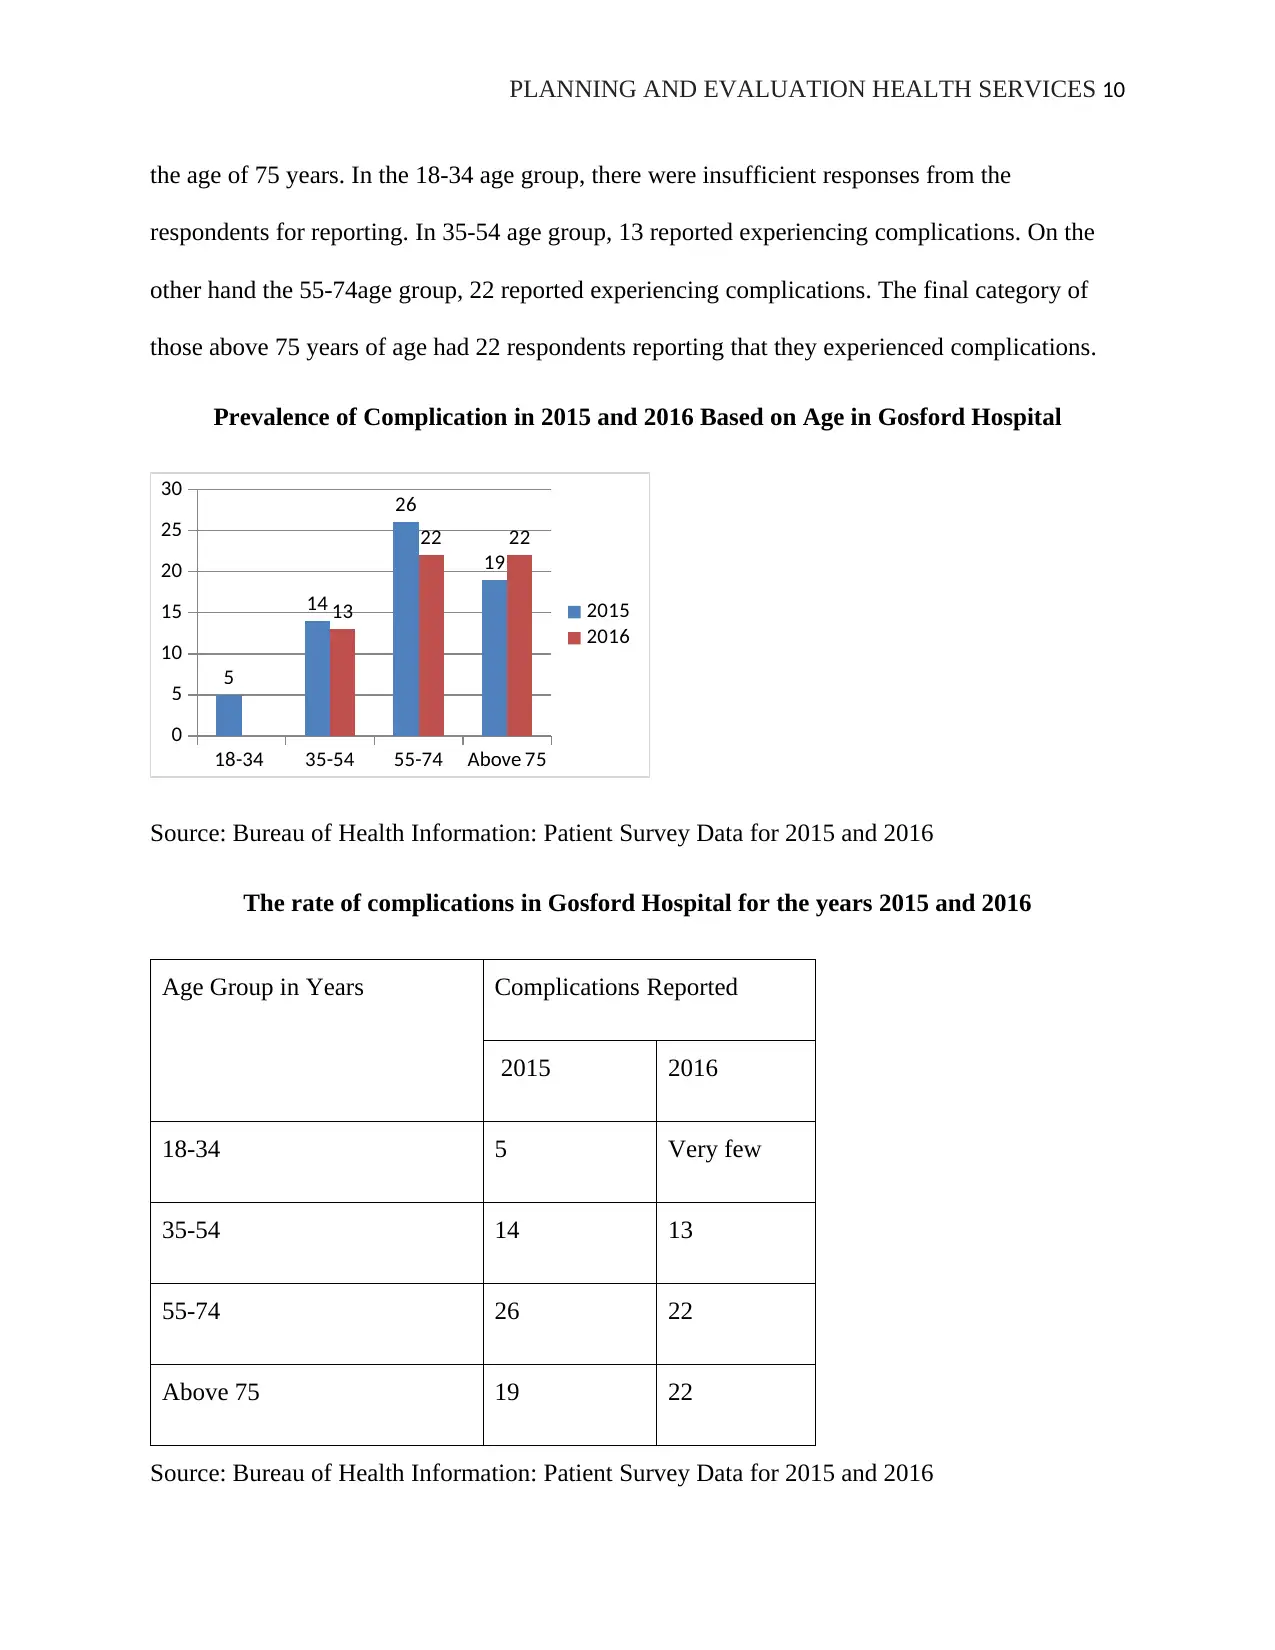
the age of 75 years. In the 18-34 age group, there were insufficient responses from the
respondents for reporting. In 35-54 age group, 13 reported experiencing complications. On the
other hand the 55-74age group, 22 reported experiencing complications. The final category of
those above 75 years of age had 22 respondents reporting that they experienced complications.
Prevalence of Complication in 2015 and 2016 Based on Age in Gosford Hospital
18-34 35-54 55-74 Above 75
0
5
10
15
20
25
30
5
14
26
19
13
22 22
2015
2016
Source: Bureau of Health Information: Patient Survey Data for 2015 and 2016
The rate of complications in Gosford Hospital for the years 2015 and 2016
Age Group in Years Complications Reported
2015 2016
18-34 5 Very few
35-54 14 13
55-74 26 22
Above 75 19 22
Source: Bureau of Health Information: Patient Survey Data for 2015 and 2016
Paraphrase This Document
Need a fresh take? Get an instant paraphrase of this document with our AI Paraphraser
PLANNING AND EVALUATION HEALTH SERVICES 11
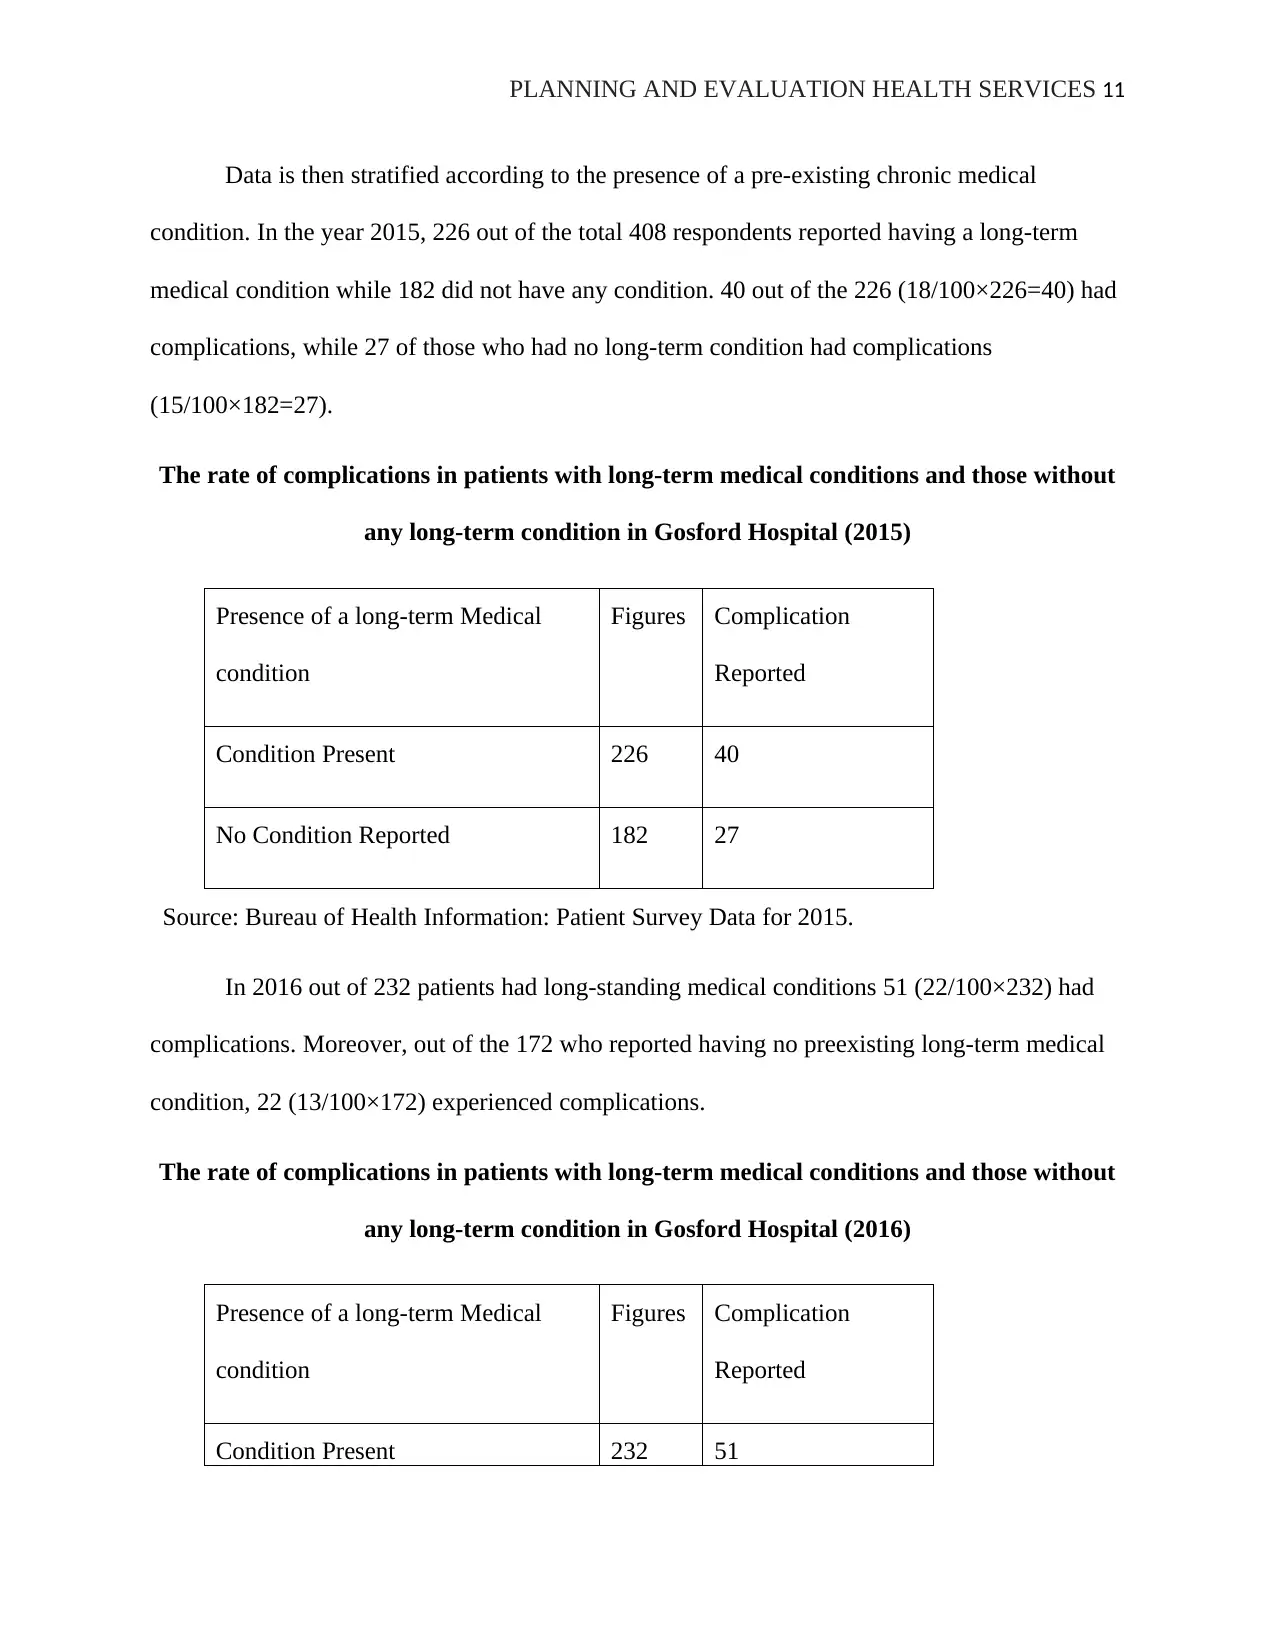
Data is then stratified according to the presence of a pre-existing chronic medical
condition. In the year 2015, 226 out of the total 408 respondents reported having a long-term
medical condition while 182 did not have any condition. 40 out of the 226 (18/100×226=40) had
complications, while 27 of those who had no long-term condition had complications
(15/100×182=27).
The rate of complications in patients with long-term medical conditions and those without
any long-term condition in Gosford Hospital (2015)
Presence of a long-term Medical
condition
Figures Complication
Reported
Condition Present 226 40
No Condition Reported 182 27
Source: Bureau of Health Information: Patient Survey Data for 2015.
In 2016 out of 232 patients had long-standing medical conditions 51 (22/100×232) had
complications. Moreover, out of the 172 who reported having no preexisting long-term medical
condition, 22 (13/100×172) experienced complications.
The rate of complications in patients with long-term medical conditions and those without
any long-term condition in Gosford Hospital (2016)
Presence of a long-term Medical
condition
Figures Complication
Reported
Condition Present 232 51
PLANNING AND EVALUATION HEALTH SERVICES 12
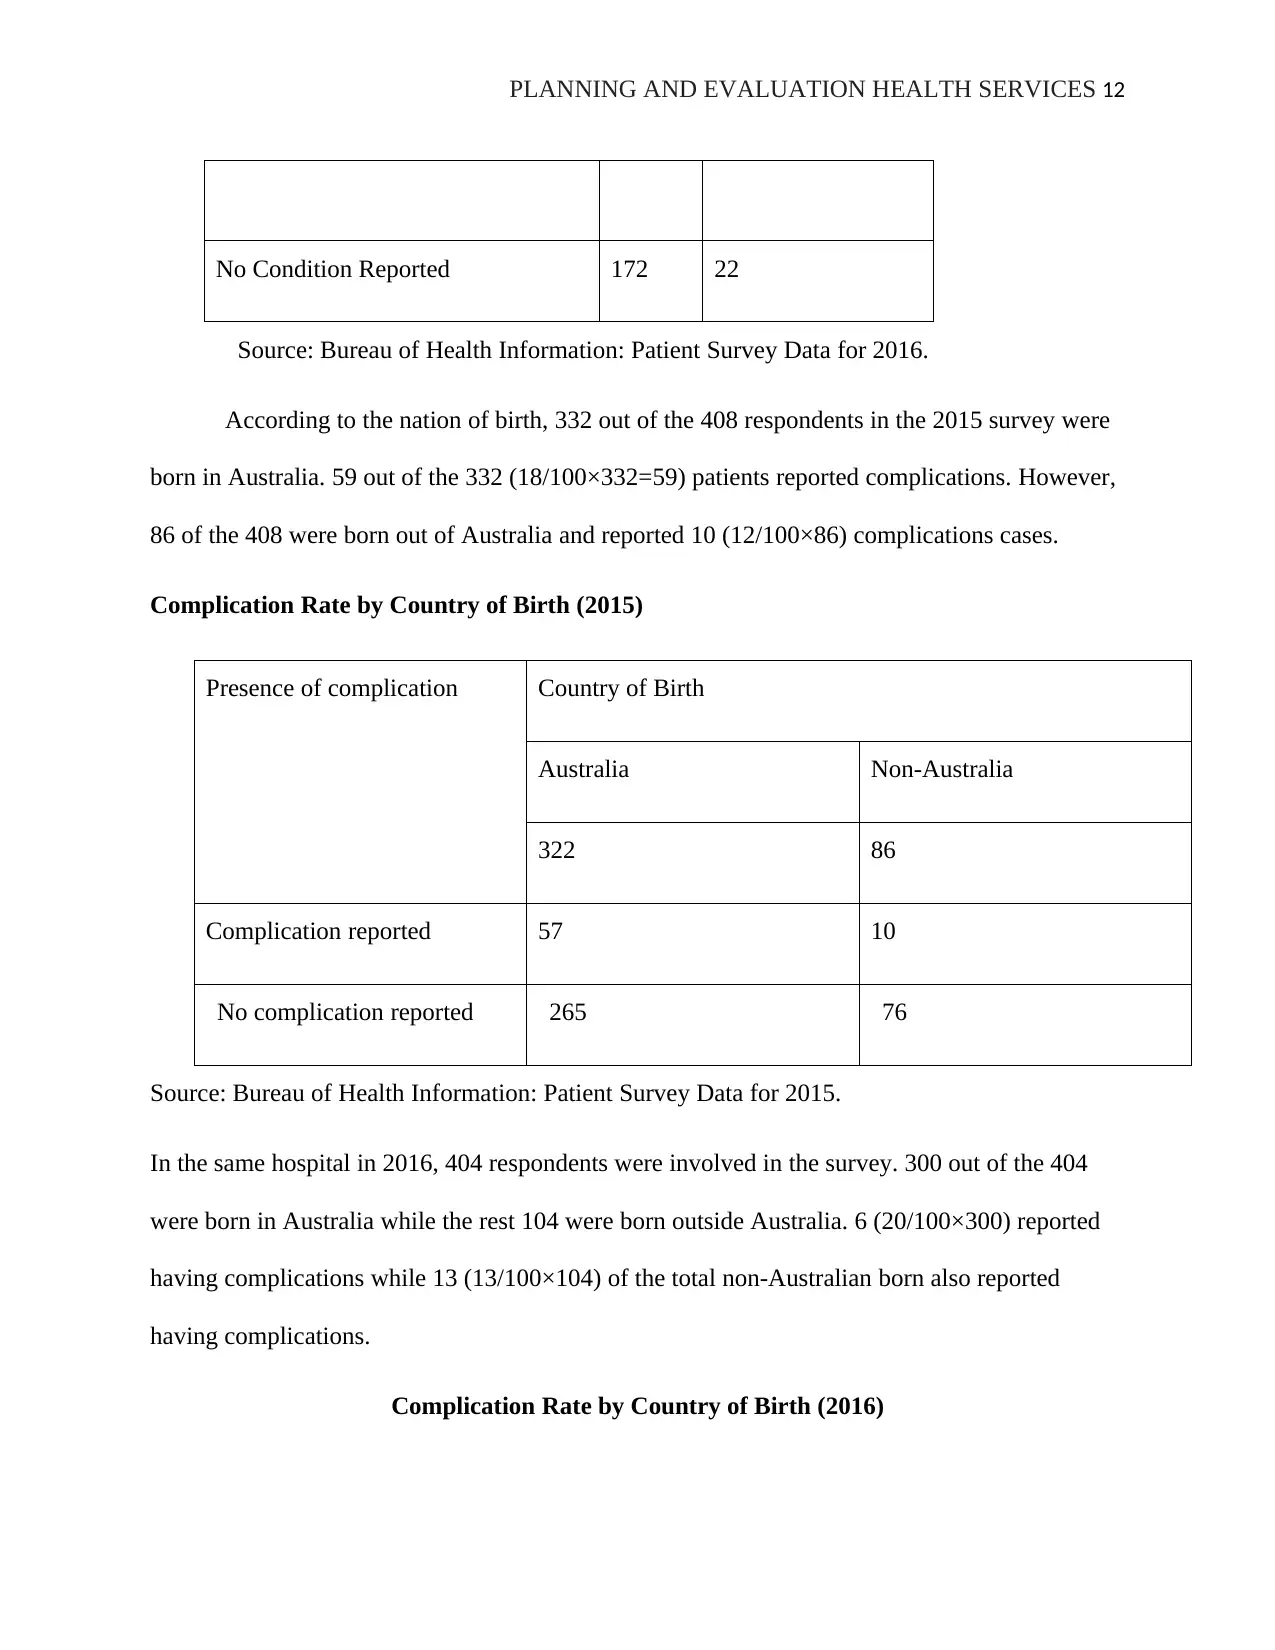
No Condition Reported 172 22
Source: Bureau of Health Information: Patient Survey Data for 2016.
According to the nation of birth, 332 out of the 408 respondents in the 2015 survey were
born in Australia. 59 out of the 332 (18/100×332=59) patients reported complications. However,
86 of the 408 were born out of Australia and reported 10 (12/100×86) complications cases.
Complication Rate by Country of Birth (2015)
Presence of complication Country of Birth
Australia Non-Australia
322 86
Complication reported 57 10
No complication reported 265 76
Source: Bureau of Health Information: Patient Survey Data for 2015.
In the same hospital in 2016, 404 respondents were involved in the survey. 300 out of the 404
were born in Australia while the rest 104 were born outside Australia. 6 (20/100×300) reported
having complications while 13 (13/100×104) of the total non-Australian born also reported
having complications.
Complication Rate by Country of Birth (2016)
⊘ This is a preview!⊘
Do you want full access?
Subscribe today to unlock all pages.
Trusted by 1+ million students worldwide
1 out of 27
Related Documents


Your All-in-One AI-Powered Toolkit for Academic Success.
+13062052269
info@desklib.com
Available 24*7 on WhatsApp / Email
![[object Object]](/_next/static/media/star-bottom.7253800d.svg)
Unlock your academic potential
Copyright © 2020–2026 A2Z Services. All Rights Reserved. Developed and managed by ZUCOL.