Energy Use Patterns: Comparison of Energy Sources in the UK
VerifiedAdded on 2023/01/12
|12
|2427
|87
Report
AI Summary
This report examines the patterns of energy use in the UK, comparing primary energy sources from 2018 and 2020, based on data from the BP statistical review and an Ion 1975 document. It analyzes the consumption of coal, natural gas, nuclear, hydro, and crude oil, highlighting significant shifts and trends. The report suggests reasons for observed differences and similarities in the data, attributing changes to factors like the adoption of renewable energy sources and policy frameworks. It further discusses the main uses of various energy sources such as oil, coal, nuclear, wind, and natural gas, and provides an estimate of fuel use in 2020, based on the BP report and relevant assumptions. The analysis emphasizes the increasing importance of renewable energy and technological advancements in shaping energy consumption patterns. The report concludes by summarizing key findings and highlighting the evolving energy landscape in the UK.

Patterns of energy use
1
1
Paraphrase This Document
Need a fresh take? Get an instant paraphrase of this document with our AI Paraphraser
Table of Contents
INTRODUCTION...........................................................................................................................3
TASK 1............................................................................................................................................3
Comparison of primary energy sources in 2020 from Ion 1975 document and BP statistical
review...........................................................................................................................................3
TASK 2 ...........................................................................................................................................8
Suggest reasons for differences and similarities between 2020 and 2018 data...........................8
TASK 3............................................................................................................................................9
Main use of oil, coal, nuclear and wind today and why they are used in this way......................9
TASK 4..........................................................................................................................................10
Estimate of actual use in 2020 from BP report and assumption involved.................................10
CONCLUSION..............................................................................................................................10
REFERENCES..............................................................................................................................12
2
INTRODUCTION
For human being it is necessary to fulfil their needs. In present times, there is instant change
in energy use. Now, there are different forms of energy and patterns in which they are used.
Generally, energy is divided into 2 groups that is potential and kinetic. Both are used in fulfilling
human needs and for future use (Pensa, Galusha and Redlich, 2016). The patterns are changed
with consumption process. Every country produces and consume energy in different way. There
are many various types of resources which is required to produce energy such as wind, solar,
crude oil, etc.
The report will compare primary energy of Ion 1975 and BP statistical review. also, it will
evaluate difference between them. moreover, use of coal oil, nuclear, etc. will be described and
estimate of energy use in 2020 will be done.
TASK 1
Comparison of primary energy sources in 2020 from Ion 1975 document and BP statistical
review
By reviewing both report it is analysed that use of primary energy sources in UK in 2018
and 2020 the comparison is as follows :-
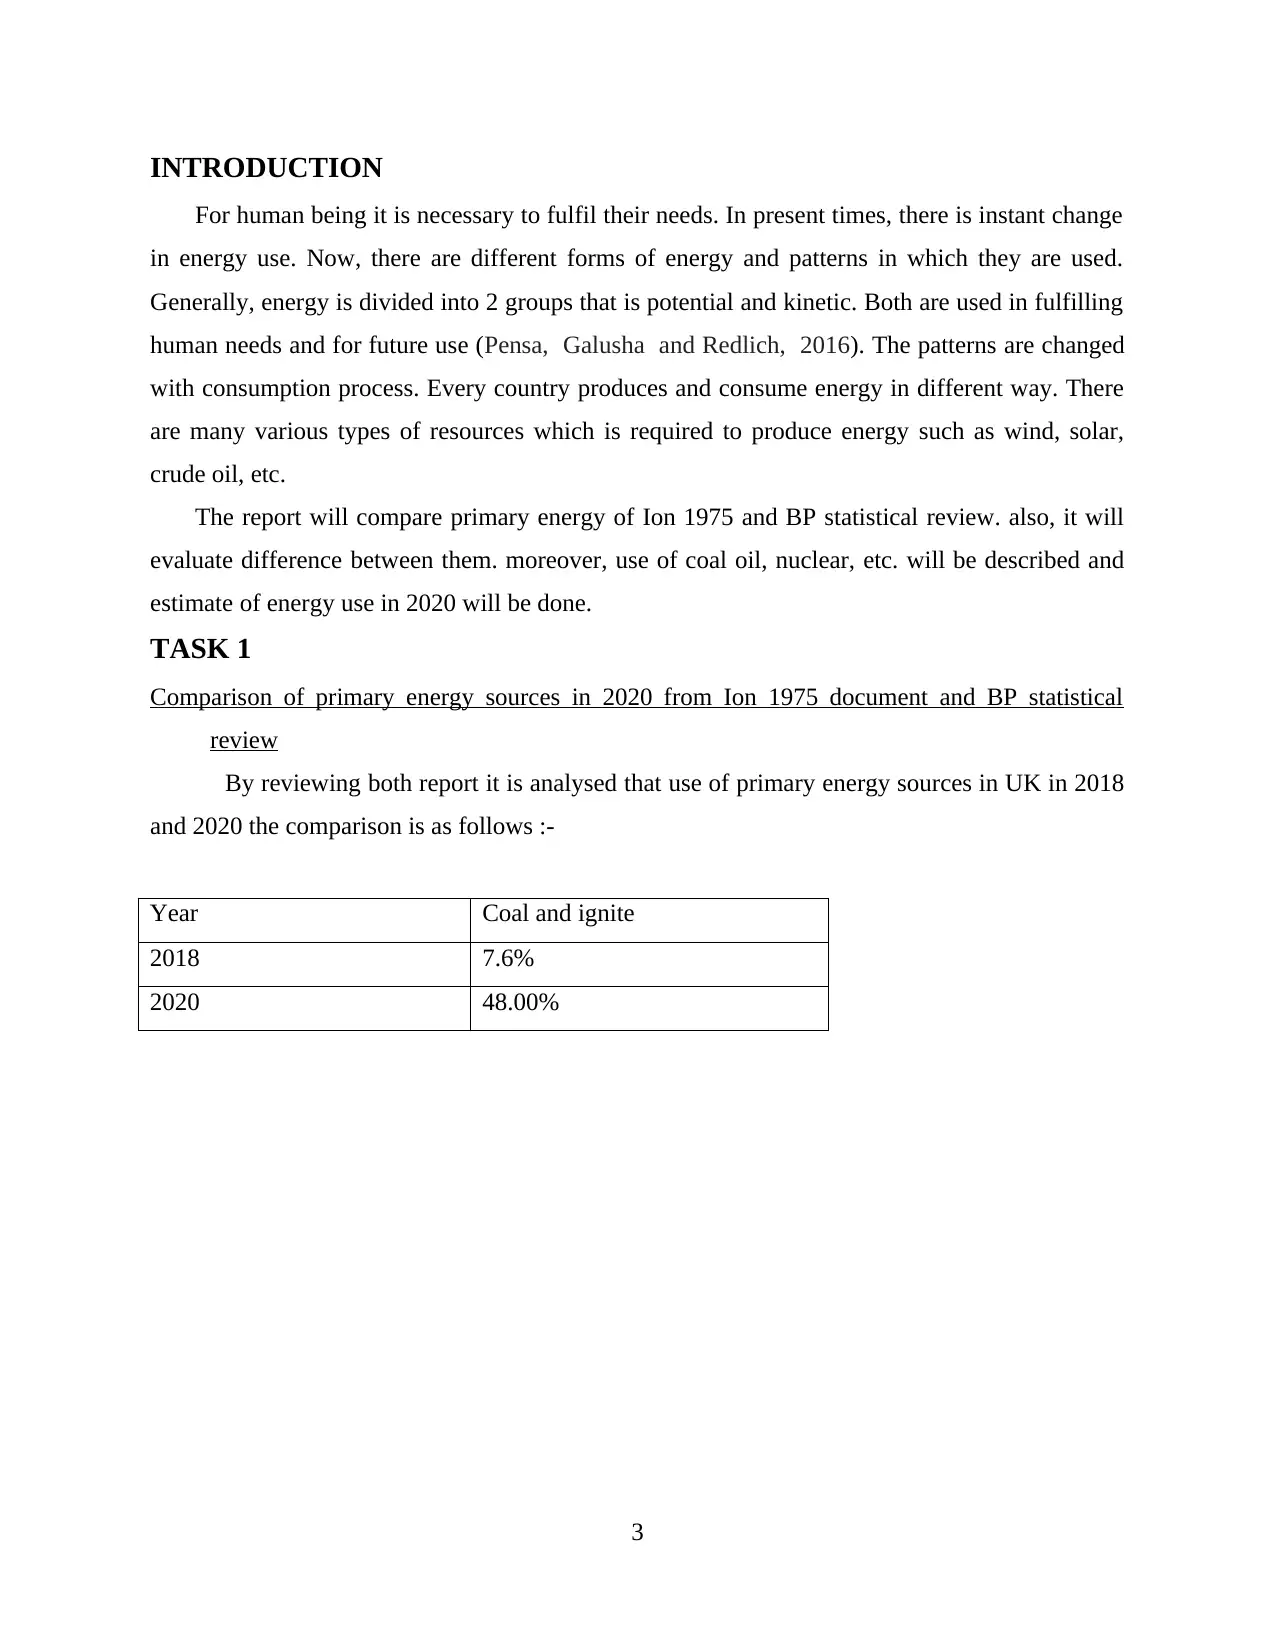
Year Coal and ignite
2018 7.6%
2020 48.00%
3
For human being it is necessary to fulfil their needs. In present times, there is instant change
in energy use. Now, there are different forms of energy and patterns in which they are used.
Generally, energy is divided into 2 groups that is potential and kinetic. Both are used in fulfilling
human needs and for future use (Pensa, Galusha and Redlich, 2016). The patterns are changed
with consumption process. Every country produces and consume energy in different way. There
are many various types of resources which is required to produce energy such as wind, solar,
crude oil, etc.
The report will compare primary energy of Ion 1975 and BP statistical review. also, it will
evaluate difference between them. moreover, use of coal oil, nuclear, etc. will be described and
estimate of energy use in 2020 will be done.
TASK 1
Comparison of primary energy sources in 2020 from Ion 1975 document and BP statistical
review
By reviewing both report it is analysed that use of primary energy sources in UK in 2018
and 2020 the comparison is as follows :-
Year Coal and ignite
2018 7.6%
2020 48.00%
3
⊘ This is a preview!⊘
Do you want full access?
Subscribe today to unlock all pages.
Trusted by 1+ million students worldwide
From above graph it is interpreted that in 2018 use of coal and ignite from BP report is
7.6% in UK while in Ion document in 2020 it shows 48%. Thus, there is high rise in use of coal
in UK till 2020. Generally, it will be used in producing electricity. Furthermore, thermal coal
will be used in it.
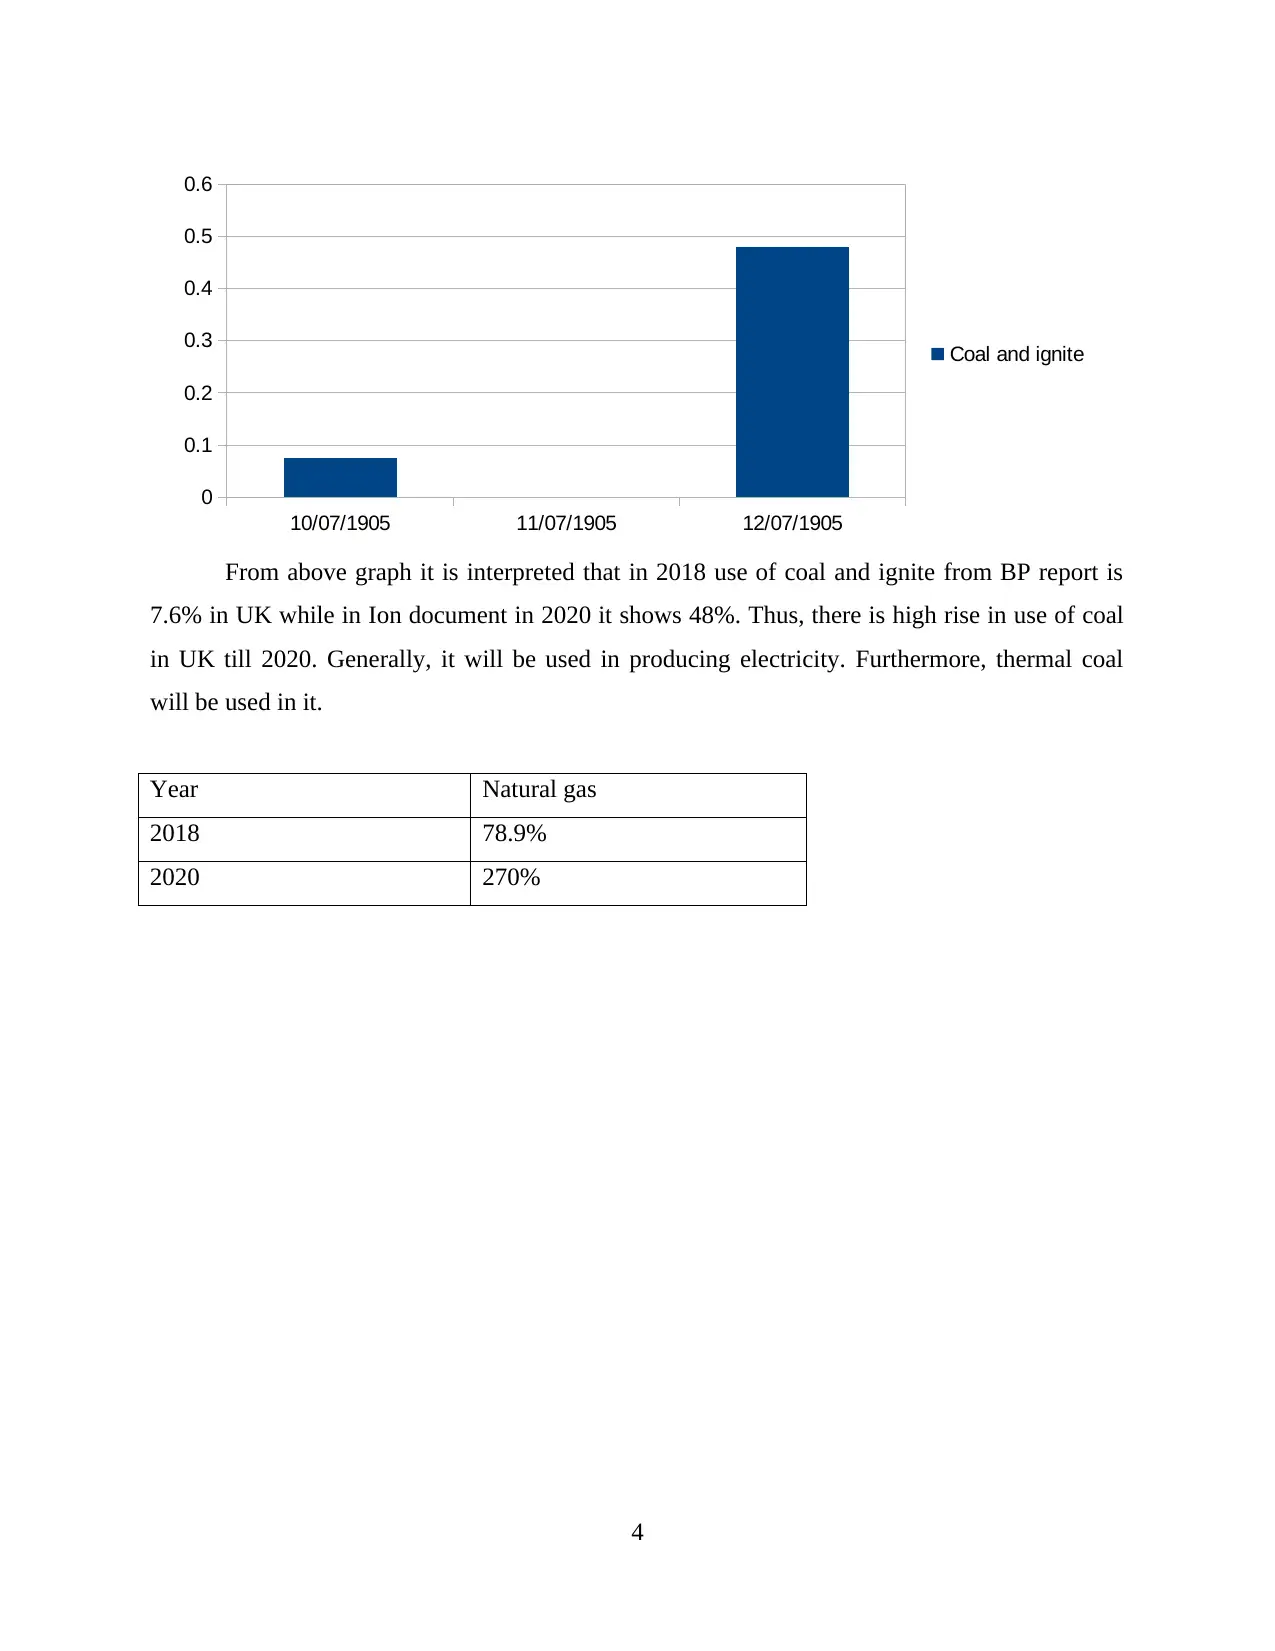
Year Natural gas
2018 78.9%
2020 270%
4
10/07/1905 11/07/1905 12/07/1905
0
0.1
0.2
0.3
0.4
0.5
0.6
Coal and ignite
7.6% in UK while in Ion document in 2020 it shows 48%. Thus, there is high rise in use of coal
in UK till 2020. Generally, it will be used in producing electricity. Furthermore, thermal coal
will be used in it.
Year Natural gas
2018 78.9%
2020 270%
4
10/07/1905 11/07/1905 12/07/1905
0
0.1
0.2
0.3
0.4
0.5
0.6
Coal and ignite
Paraphrase This Document
Need a fresh take? Get an instant paraphrase of this document with our AI Paraphraser
By comparing the table it is said that there in UK use of natural gas in 2018 is 78.9%.
However, in 2020 it shows 270%. so, it s expected that there is high rise in use of natural gas.
This is due to change in pattern of use of NG. Here, they will be used in producing electricity
along with coal and other fossil fuel.
5
10/07/1905 11/07/1905 12/07/1905
0
0.5
1
1.5
2
2.5
3
Natural gas
However, in 2020 it shows 270%. so, it s expected that there is high rise in use of natural gas.
This is due to change in pattern of use of NG. Here, they will be used in producing electricity
along with coal and other fossil fuel.
5
10/07/1905 11/07/1905 12/07/1905
0
0.5
1
1.5
2
2.5
3
Natural gas
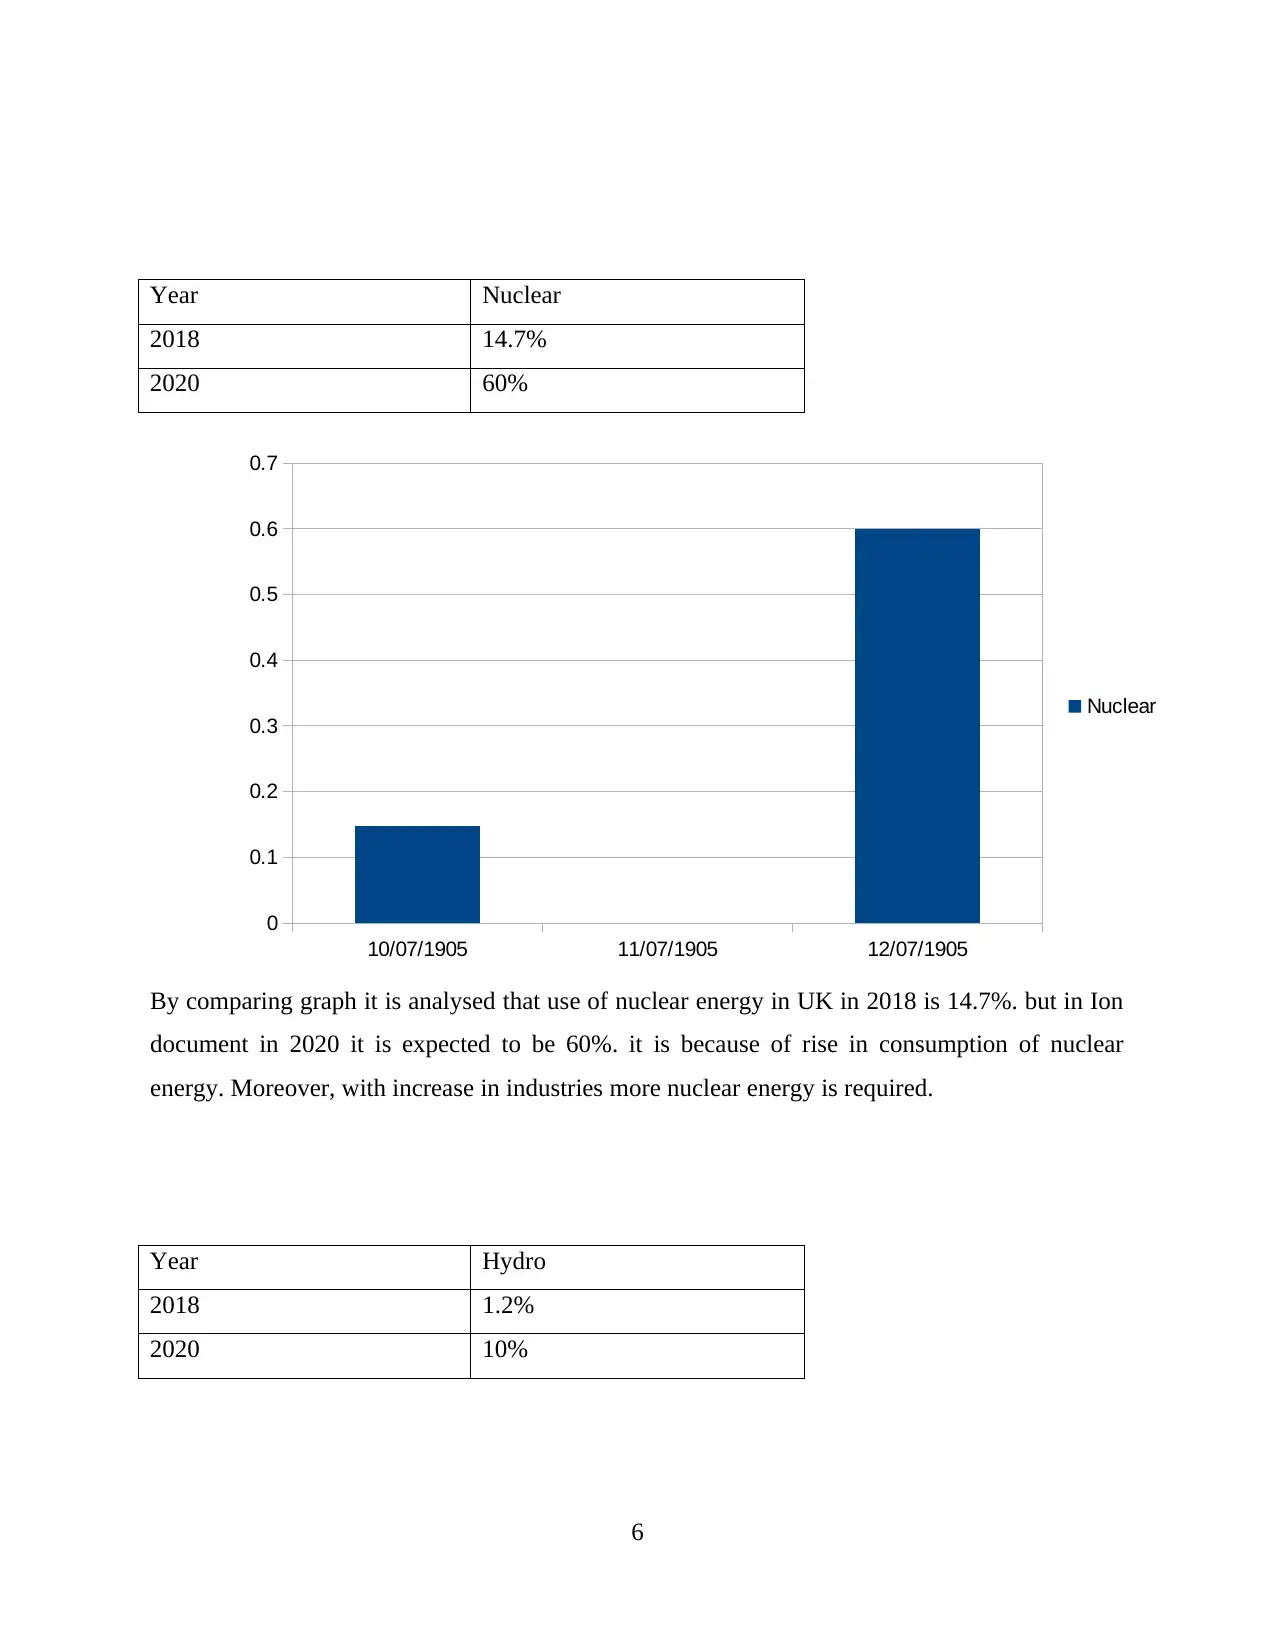
Year Nuclear
2018 14.7%
2020 60%
By comparing graph it is analysed that use of nuclear energy in UK in 2018 is 14.7%. but in Ion
document in 2020 it is expected to be 60%. it is because of rise in consumption of nuclear
energy. Moreover, with increase in industries more nuclear energy is required.
Year Hydro
2018 1.2%
2020 10%
6
10/07/1905 11/07/1905 12/07/1905
0
0.1
0.2
0.3
0.4
0.5
0.6
0.7
Nuclear
⊘ This is a preview!⊘
Do you want full access?
Subscribe today to unlock all pages.
Trusted by 1+ million students worldwide
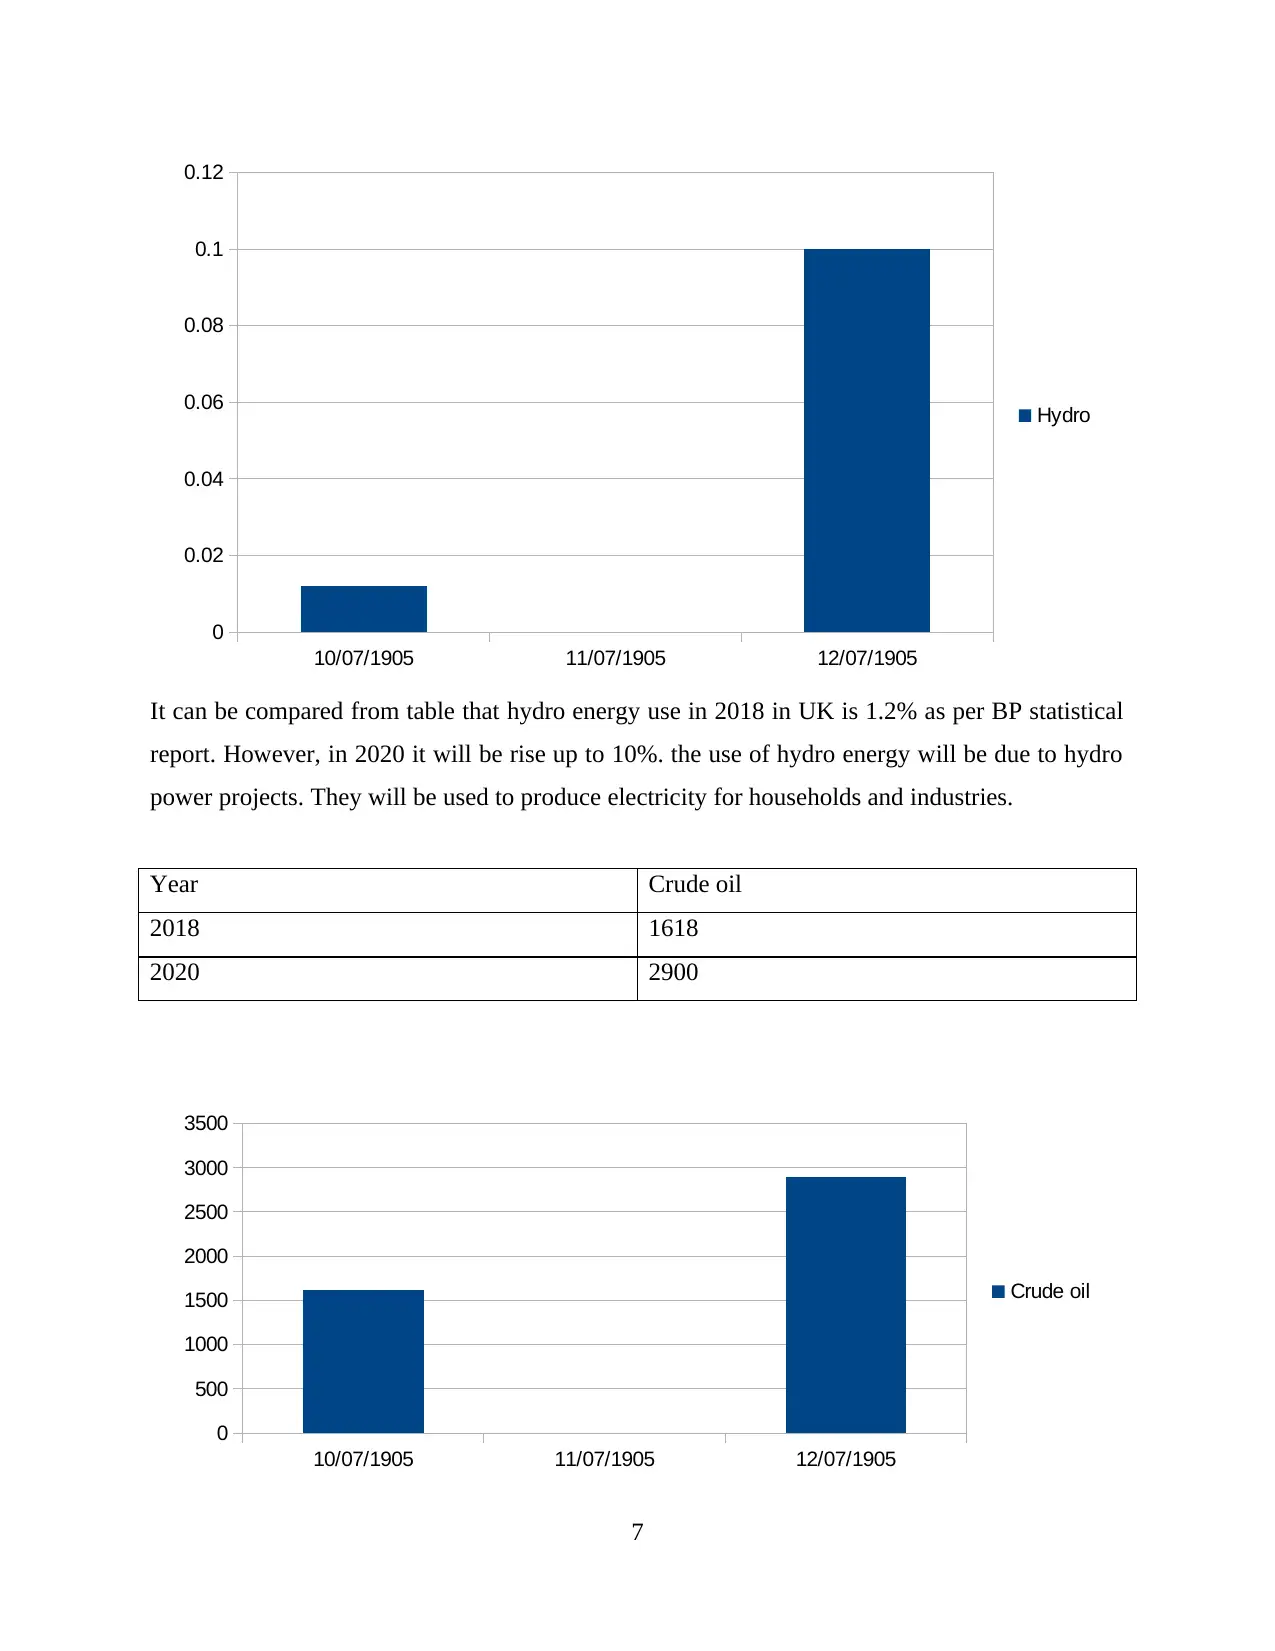
It can be compared from table that hydro energy use in 2018 in UK is 1.2% as per BP statistical
report. However, in 2020 it will be rise up to 10%. the use of hydro energy will be due to hydro
power projects. They will be used to produce electricity for households and industries.
Year Crude oil
2018 1618
2020 2900
7
10/07/1905 11/07/1905 12/07/1905
0
0.02
0.04
0.06
0.08
0.1
0.12
Hydro
10/07/1905 11/07/1905 12/07/1905
0
500
1000
1500
2000
2500
3000
3500
Crude oil
Paraphrase This Document
Need a fresh take? Get an instant paraphrase of this document with our AI Paraphraser
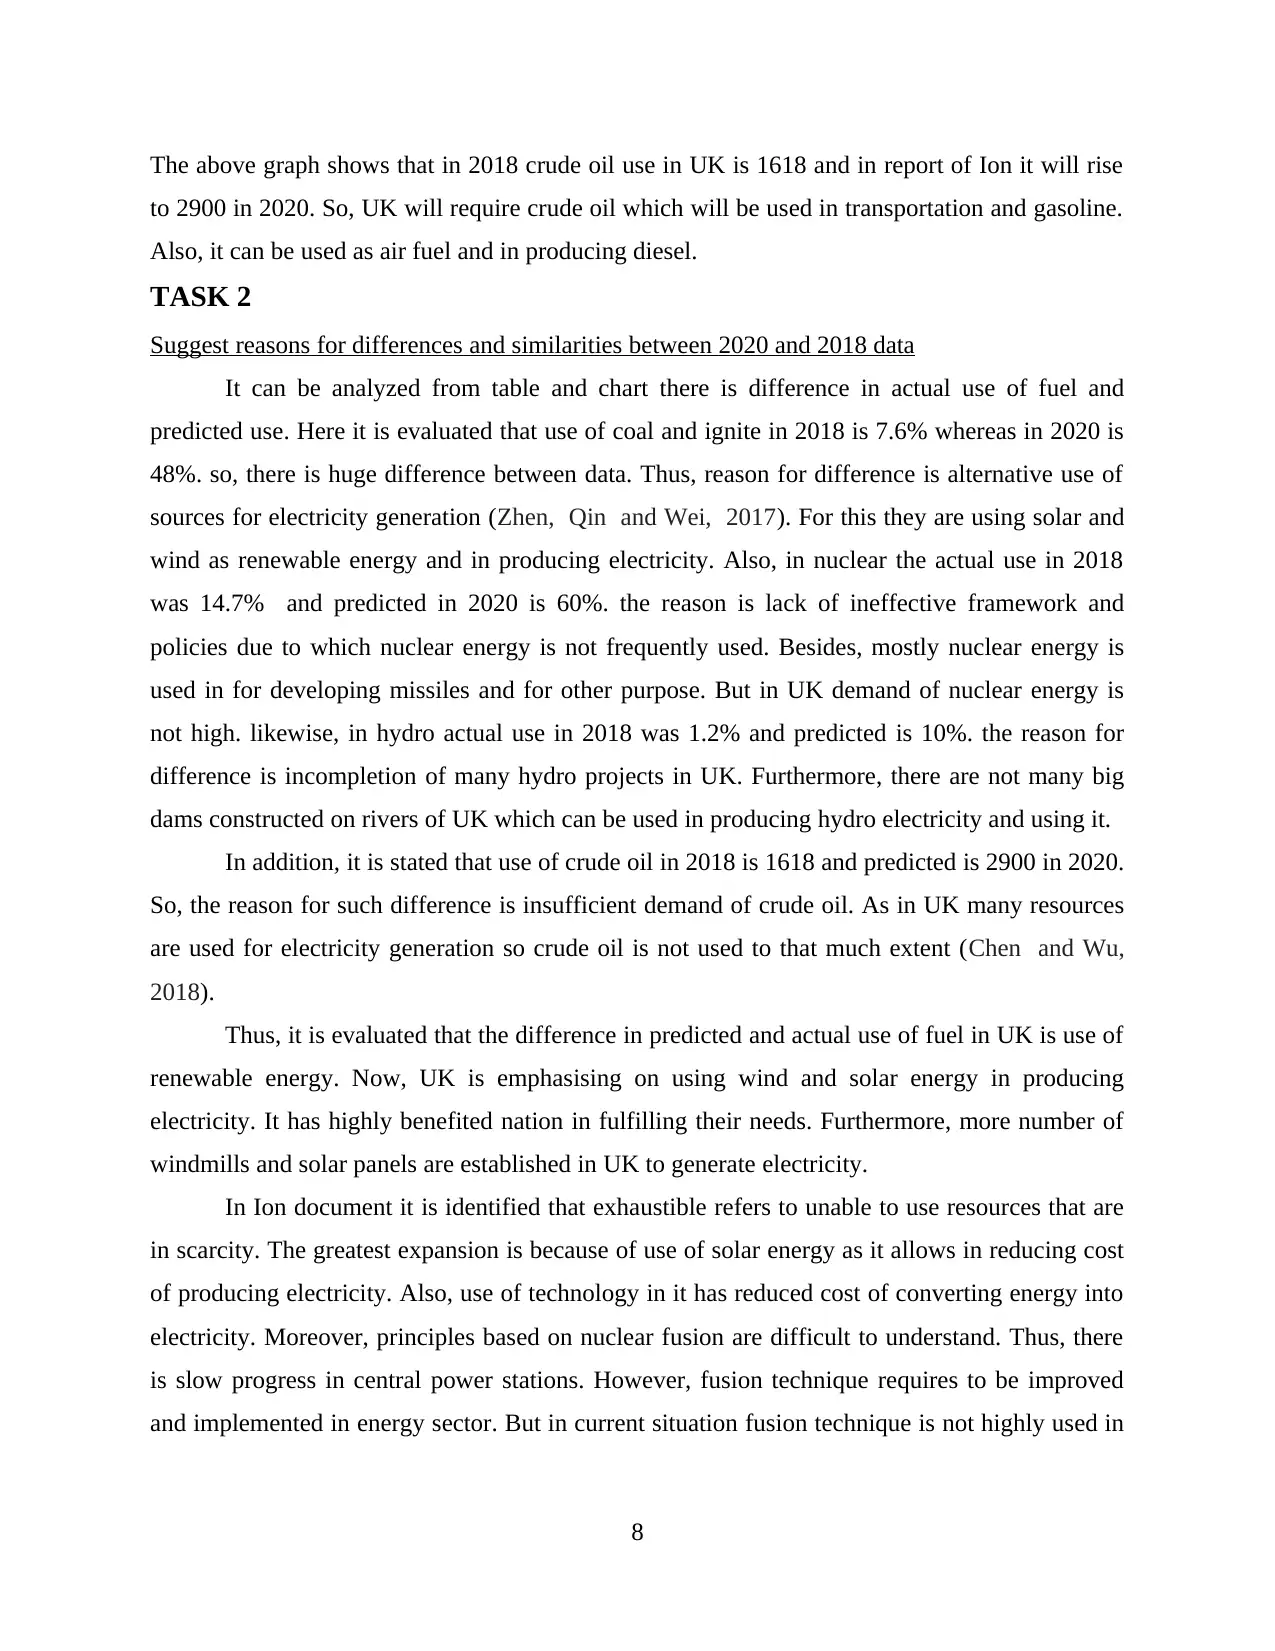
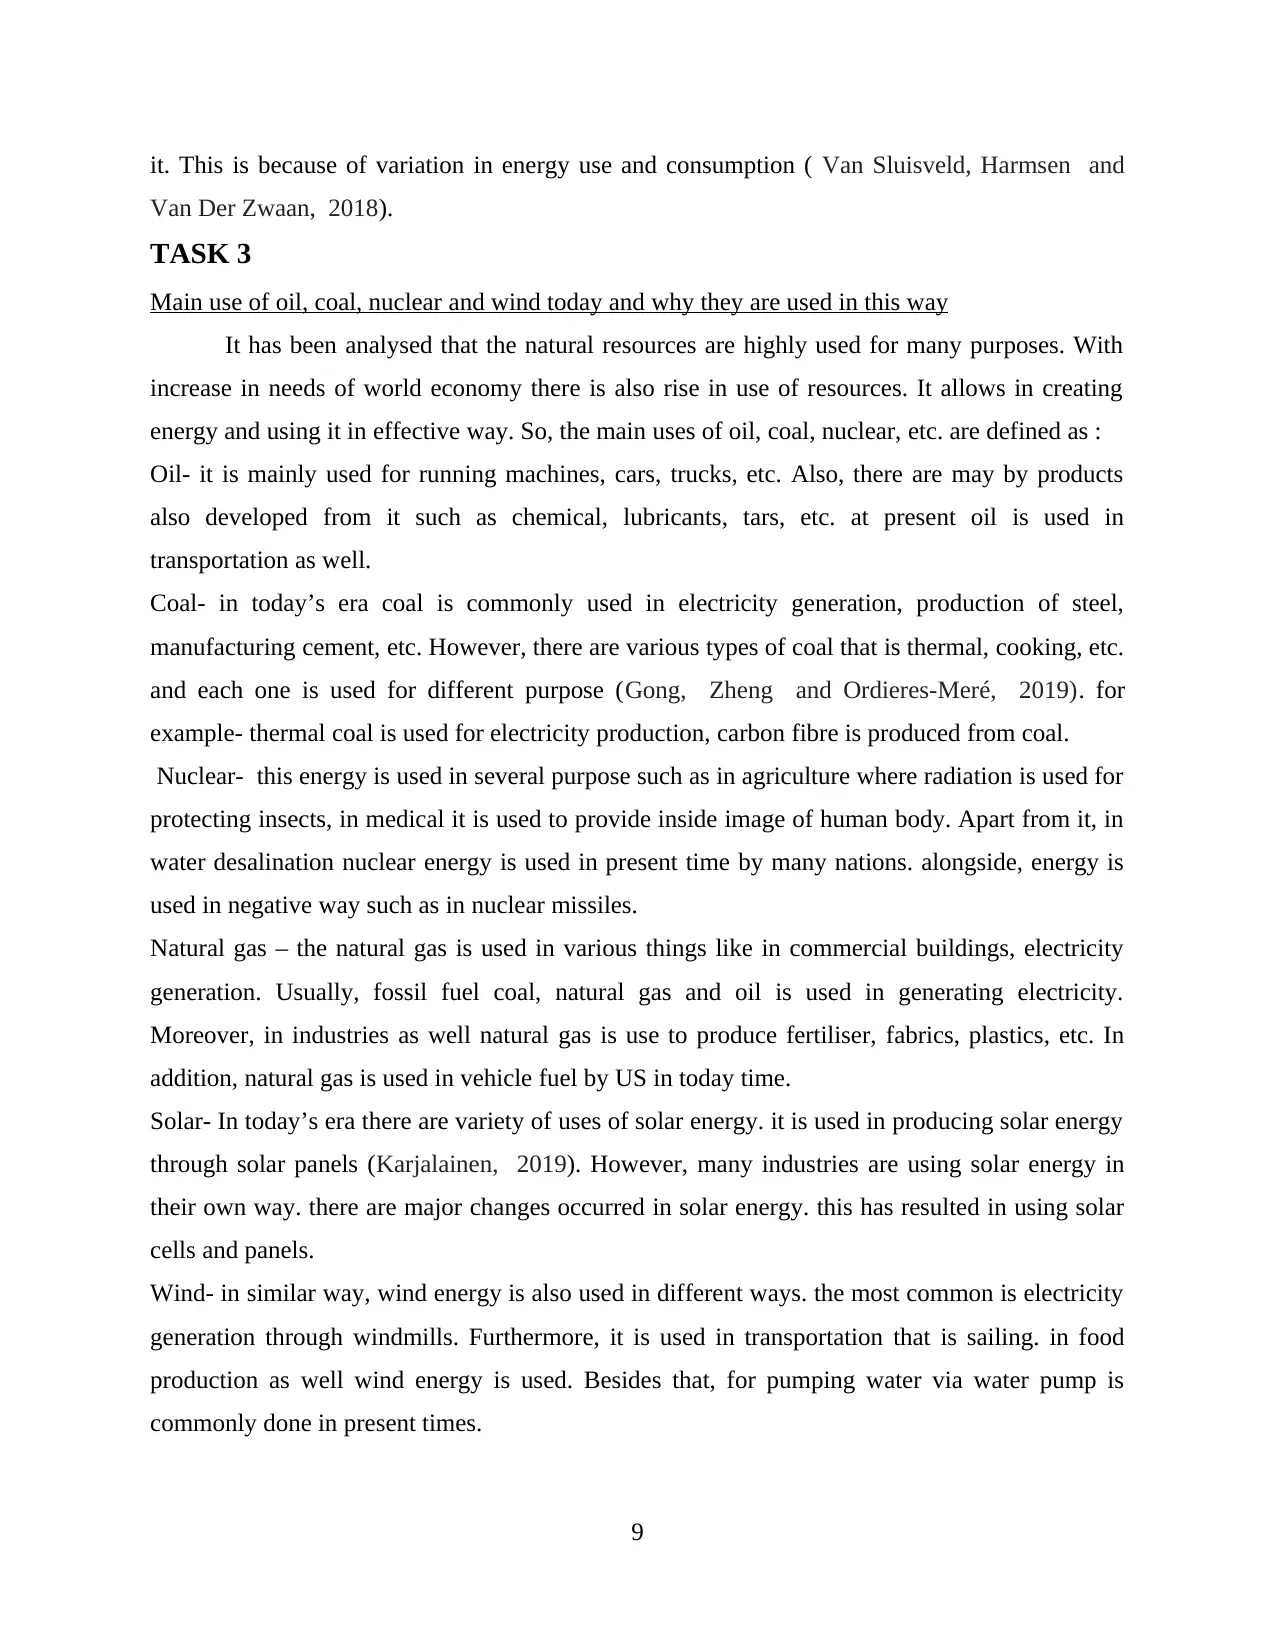
The above graph shows that in 2018 crude oil use in UK is 1618 and in report of Ion it will rise
to 2900 in 2020. So, UK will require crude oil which will be used in transportation and gasoline.
Also, it can be used as air fuel and in producing diesel.
TASK 2
Suggest reasons for differences and similarities between 2020 and 2018 data
It can be analyzed from table and chart there is difference in actual use of fuel and
predicted use. Here it is evaluated that use of coal and ignite in 2018 is 7.6% whereas in 2020 is
48%. so, there is huge difference between data. Thus, reason for difference is alternative use of
sources for electricity generation (Zhen, Qin and Wei, 2017). For this they are using solar and
wind as renewable energy and in producing electricity. Also, in nuclear the actual use in 2018
was 14.7% and predicted in 2020 is 60%. the reason is lack of ineffective framework and
policies due to which nuclear energy is not frequently used. Besides, mostly nuclear energy is
used in for developing missiles and for other purpose. But in UK demand of nuclear energy is
not high. likewise, in hydro actual use in 2018 was 1.2% and predicted is 10%. the reason for
difference is incompletion of many hydro projects in UK. Furthermore, there are not many big
dams constructed on rivers of UK which can be used in producing hydro electricity and using it.
In addition, it is stated that use of crude oil in 2018 is 1618 and predicted is 2900 in 2020.
So, the reason for such difference is insufficient demand of crude oil. As in UK many resources
are used for electricity generation so crude oil is not used to that much extent (Chen and Wu,
2018).
Thus, it is evaluated that the difference in predicted and actual use of fuel in UK is use of
renewable energy. Now, UK is emphasising on using wind and solar energy in producing
electricity. It has highly benefited nation in fulfilling their needs. Furthermore, more number of
windmills and solar panels are established in UK to generate electricity.
In Ion document it is identified that exhaustible refers to unable to use resources that are
in scarcity. The greatest expansion is because of use of solar energy as it allows in reducing cost
of producing electricity. Also, use of technology in it has reduced cost of converting energy into
electricity. Moreover, principles based on nuclear fusion are difficult to understand. Thus, there
is slow progress in central power stations. However, fusion technique requires to be improved
and implemented in energy sector. But in current situation fusion technique is not highly used in
8
it. This is because of variation in energy use and consumption ( Van Sluisveld, Harmsen and
Van Der Zwaan, 2018).
TASK 3
Main use of oil, coal, nuclear and wind today and why they are used in this way
It has been analysed that the natural resources are highly used for many purposes. With
increase in needs of world economy there is also rise in use of resources. It allows in creating
energy and using it in effective way. So, the main uses of oil, coal, nuclear, etc. are defined as :
Oil- it is mainly used for running machines, cars, trucks, etc. Also, there are may by products
also developed from it such as chemical, lubricants, tars, etc. at present oil is used in
transportation as well.
Coal- in today’s era coal is commonly used in electricity generation, production of steel,
manufacturing cement, etc. However, there are various types of coal that is thermal, cooking, etc.
and each one is used for different purpose (Gong, Zheng and Ordieres-Meré, 2019). for
example- thermal coal is used for electricity production, carbon fibre is produced from coal.
Nuclear- this energy is used in several purpose such as in agriculture where radiation is used for
protecting insects, in medical it is used to provide inside image of human body. Apart from it, in
water desalination nuclear energy is used in present time by many nations. alongside, energy is
used in negative way such as in nuclear missiles.
Natural gas – the natural gas is used in various things like in commercial buildings, electricity
generation. Usually, fossil fuel coal, natural gas and oil is used in generating electricity.
Moreover, in industries as well natural gas is use to produce fertiliser, fabrics, plastics, etc. In
addition, natural gas is used in vehicle fuel by US in today time.
Solar- In today’s era there are variety of uses of solar energy. it is used in producing solar energy
through solar panels (Karjalainen, 2019). However, many industries are using solar energy in
their own way. there are major changes occurred in solar energy. this has resulted in using solar
cells and panels.
Wind- in similar way, wind energy is also used in different ways. the most common is electricity
generation through windmills. Furthermore, it is used in transportation that is sailing. in food
production as well wind energy is used. Besides that, for pumping water via water pump is
commonly done in present times.
9
⊘ This is a preview!⊘
Do you want full access?
Subscribe today to unlock all pages.
Trusted by 1+ million students worldwide
It is evaluated that the energies are used in this way because it has provided an alternative
way for industries to use wind, solar, etc. as source for producing energy. through that, it has led
to efficient and effective use of natural resources. Moreover, the integration of technology in
energy generation has given insight on different ways of producing energy. Many innovative
practices are been applied in solar and wind energy (Ben and Steemers, 2018). Basically, for
electricity generation coal natural gas and oil is used.
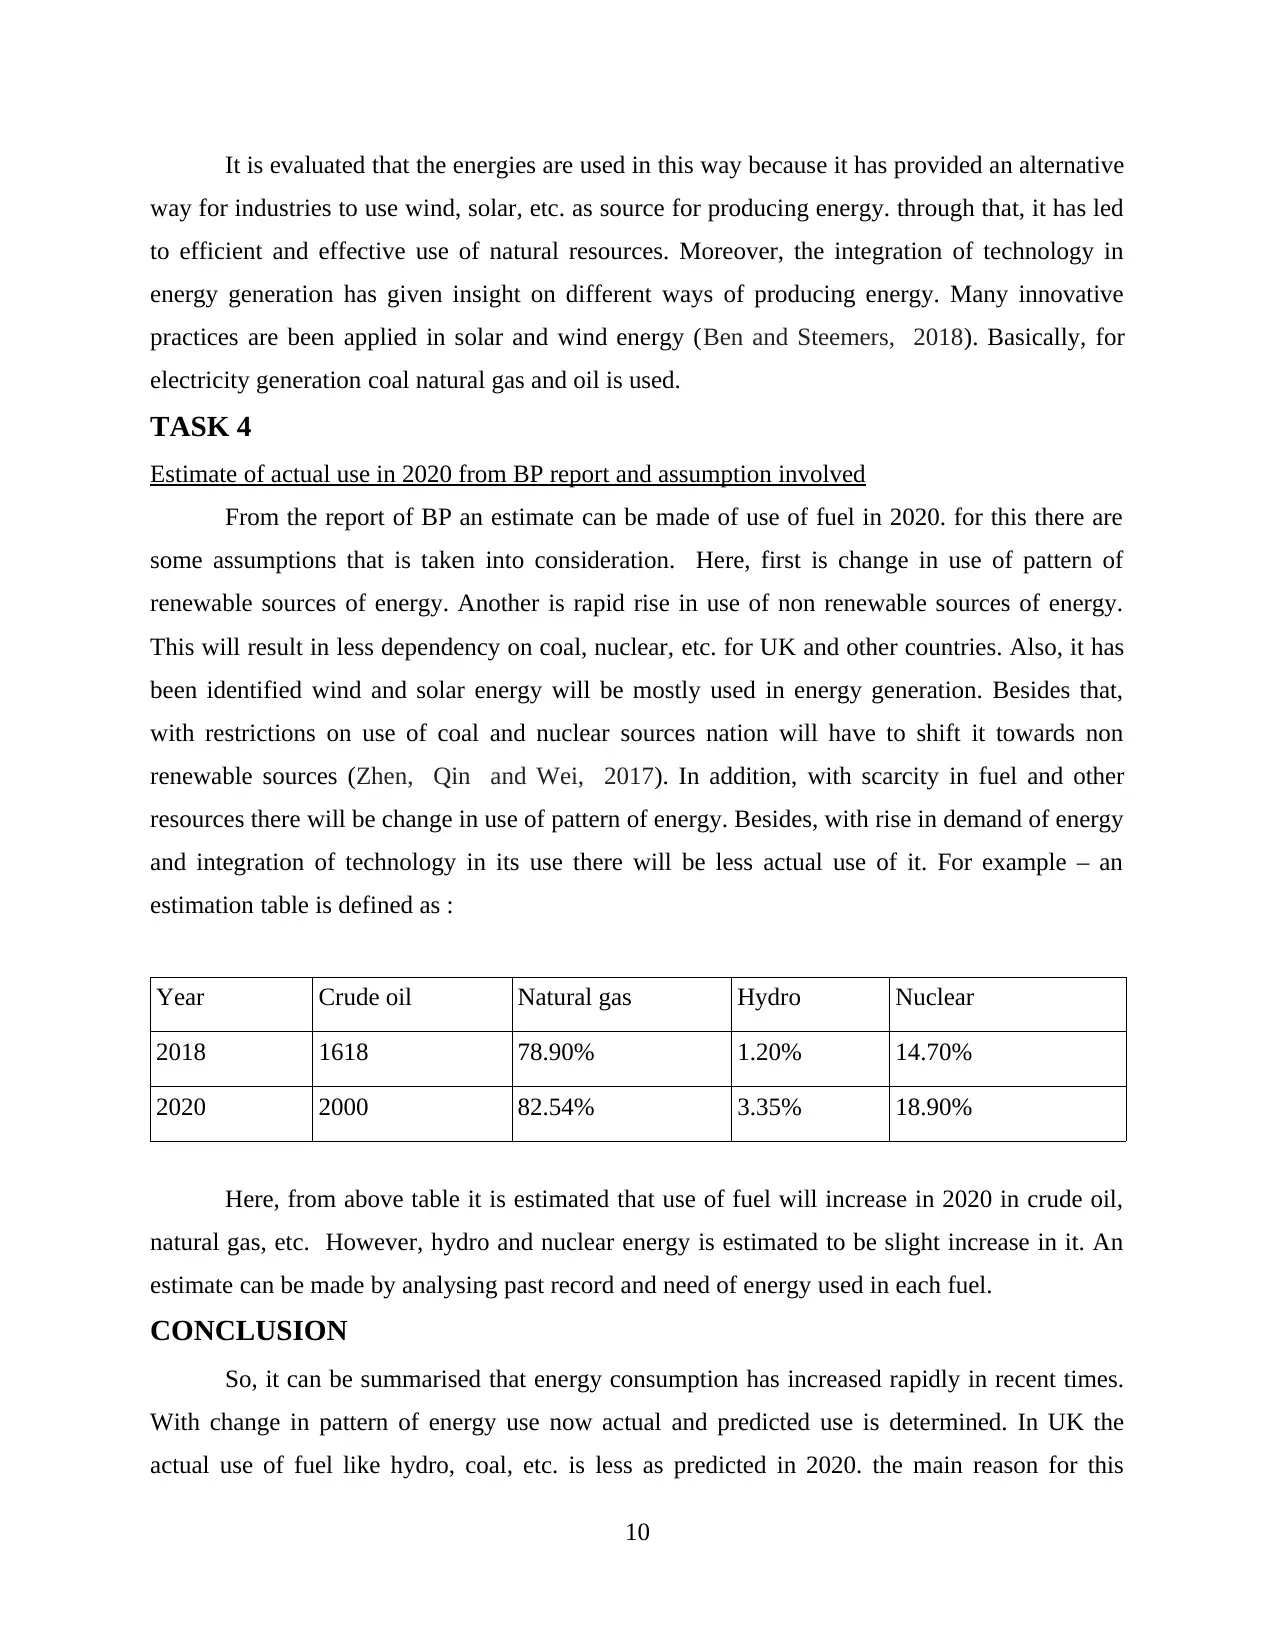
TASK 4
Estimate of actual use in 2020 from BP report and assumption involved
From the report of BP an estimate can be made of use of fuel in 2020. for this there are
some assumptions that is taken into consideration. Here, first is change in use of pattern of
renewable sources of energy. Another is rapid rise in use of non renewable sources of energy.
This will result in less dependency on coal, nuclear, etc. for UK and other countries. Also, it has
been identified wind and solar energy will be mostly used in energy generation. Besides that,
with restrictions on use of coal and nuclear sources nation will have to shift it towards non
renewable sources (Zhen, Qin and Wei, 2017). In addition, with scarcity in fuel and other
resources there will be change in use of pattern of energy. Besides, with rise in demand of energy
and integration of technology in its use there will be less actual use of it. For example – an
estimation table is defined as :
Year Crude oil Natural gas Hydro Nuclear
2018 1618 78.90% 1.20% 14.70%
2020 2000 82.54% 3.35% 18.90%
Here, from above table it is estimated that use of fuel will increase in 2020 in crude oil,
natural gas, etc. However, hydro and nuclear energy is estimated to be slight increase in it. An
estimate can be made by analysing past record and need of energy used in each fuel.
CONCLUSION
So, it can be summarised that energy consumption has increased rapidly in recent times.
With change in pattern of energy use now actual and predicted use is determined. In UK the
actual use of fuel like hydro, coal, etc. is less as predicted in 2020. the main reason for this
10
way for industries to use wind, solar, etc. as source for producing energy. through that, it has led
to efficient and effective use of natural resources. Moreover, the integration of technology in
energy generation has given insight on different ways of producing energy. Many innovative
practices are been applied in solar and wind energy (Ben and Steemers, 2018). Basically, for
electricity generation coal natural gas and oil is used.
TASK 4
Estimate of actual use in 2020 from BP report and assumption involved
From the report of BP an estimate can be made of use of fuel in 2020. for this there are
some assumptions that is taken into consideration. Here, first is change in use of pattern of
renewable sources of energy. Another is rapid rise in use of non renewable sources of energy.
This will result in less dependency on coal, nuclear, etc. for UK and other countries. Also, it has
been identified wind and solar energy will be mostly used in energy generation. Besides that,
with restrictions on use of coal and nuclear sources nation will have to shift it towards non
renewable sources (Zhen, Qin and Wei, 2017). In addition, with scarcity in fuel and other
resources there will be change in use of pattern of energy. Besides, with rise in demand of energy
and integration of technology in its use there will be less actual use of it. For example – an
estimation table is defined as :
Year Crude oil Natural gas Hydro Nuclear
2018 1618 78.90% 1.20% 14.70%
2020 2000 82.54% 3.35% 18.90%
Here, from above table it is estimated that use of fuel will increase in 2020 in crude oil,
natural gas, etc. However, hydro and nuclear energy is estimated to be slight increase in it. An
estimate can be made by analysing past record and need of energy used in each fuel.
CONCLUSION
So, it can be summarised that energy consumption has increased rapidly in recent times.
With change in pattern of energy use now actual and predicted use is determined. In UK the
actual use of fuel like hydro, coal, etc. is less as predicted in 2020. the main reason for this
10
Paraphrase This Document
Need a fresh take? Get an instant paraphrase of this document with our AI Paraphraser

difference is use of non renewable resources such as wind and solar in generating energy. There
are different use of coal, crude oil, natural gas, etc. but among them common is electricity
generation. In recent times non renewable sources are mostly used in it. Thus, its pattern is
changed.
11
are different use of coal, crude oil, natural gas, etc. but among them common is electricity
generation. In recent times non renewable sources are mostly used in it. Thus, its pattern is
changed.
11
REFERENCES
Books and journals
Ben, H. and Steemers, K., 2018. Household archetypes and behavioural patterns in UK domestic
energy use. Energy efficiency, 11(3), pp.761-771.
Karjalainen, S., 2019. Be active and consume less—the effect of venetian blind use patterns on
energy consumption in single-family houses. Energy Efficiency, 12(3), pp.787-801.
Gong, B., Zheng, X. and Ordieres-Meré, J., 2019. Discovering the patterns of energy
consumption, GDP, and CO2 emissions in China using the cluster method. Energy, 166,
pp.1149-1167.
Van Sluisveld, M.A., Harmsen, M.J. and Van Der Zwaan, B., 2018. Comparing future patterns
of energy system change in 2° C scenarios to expert projections. Global environmental
change, 50, pp.201-211.
Chen, Y. and Wu, J., 2018. Distribution patterns of energy consumed in classified public
buildings through the data mining process. Applied Energy, 226, pp.240-251.
Pensa, M.A., Galusha, D.H. and Redlich, C.A., 2016. Patterns of Energy Drink Use and
Associated Symptoms Among a Population of Connecticut Factory Workers. Journal of
occupational and environmental medicine, 58(5), pp.e188-e190.
Zhen, W., Qin, Q. and Wei, Y.M., 2017. Spatio-temporal patterns of energy consumption-related
GHG emissions in China's crop production systems. Energy Policy, 104, pp.274-284.
12
⊘ This is a preview!⊘
Do you want full access?
Subscribe today to unlock all pages.
Trusted by 1+ million students worldwide
1 out of 12
Your All-in-One AI-Powered Toolkit for Academic Success.
+13062052269
info@desklib.com
Available 24*7 on WhatsApp / Email
![[object Object]](/_next/static/media/star-bottom.7253800d.svg)
Unlock your academic potential
Copyright © 2020–2026 A2Z Services. All Rights Reserved. Developed and managed by ZUCOL.