Quantitative Analysis of Pay Disparities Based on Demographics
VerifiedAdded on 2023/06/11
|10
|2487
|211
Report
AI Summary
This report provides a quantitative analysis of pay gaps in the UK, focusing on the relationship between pay and demographic features such as ethnicity, location, disability, skin color, and sexual orientation. It uses data from the Understanding Society dataset and SPSS software to analyze the pay disparities. The report reviews existing literature, highlighting studies on income inequality related to gender, ethnicity, religion, disability, and age. The findings indicate a statistical relationship between demographic factors and pay, with gender, ethnicity, and country of birth significantly impacting pay rates. A t-test further confirms a significant difference in pay based on gender. The report concludes that demographic information affects pay, and suggests further research considering control variables for a more comprehensive understanding. Desklib provides access to similar reports and solved assignments for students.
QUANTITATIVE
ANALYSIS
ANALYSIS
Paraphrase This Document
Need a fresh take? Get an instant paraphrase of this document with our AI Paraphraser
Table of Contents
INTRODUCTION...........................................................................................................................3
Prior Knowledge..............................................................................................................................3
DATA AND METHODS................................................................................................................4
RESULTS........................................................................................................................................5
Descriptive statistics....................................................................................................................5
Inferential statistics......................................................................................................................6
CONCLUSION................................................................................................................................8
REFERENCES................................................................................................................................1
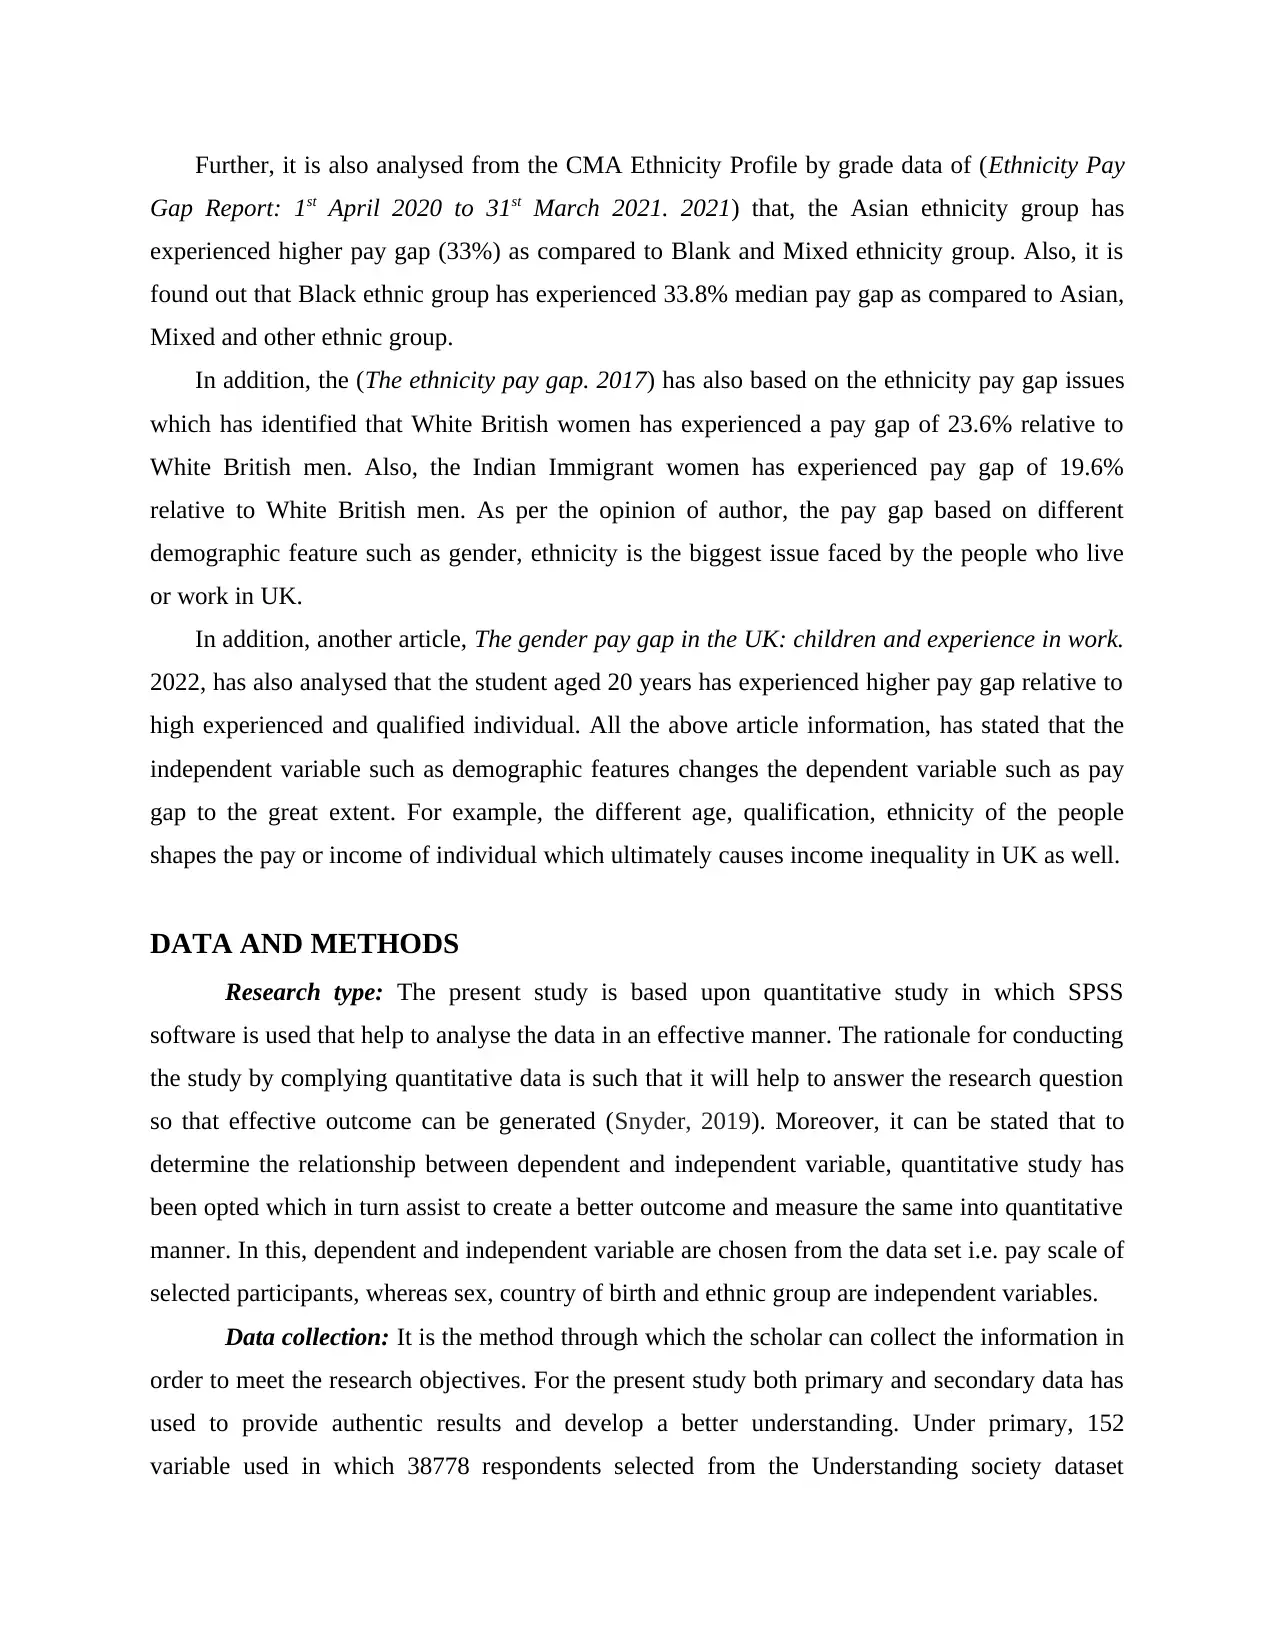
INTRODUCTION
Quantitative Method is an objective measurement and statistical analysis of data that is
basically collected through questionnaires, survey etc. with the use of computational techniques.
The present report will study the pay gap problem. The research question on which the current
study will be depend is relationship between pay and variation in the demographic feature such
as ethnicity, location, disability, skin colour, sexual orientation etc. The report will also cover the
different author views on research problem or question. The reason behind the selection of this
problem in the current report is that pay gap is one of the most common issue that basically
depends on the sexual orientation, ethnicity, age, number of children, qualification etc. Income
inequality is the biggest problem faced by different individual or group of individual that affect
the health and social life of people and also cause anxiety. Hence, this topic is important to
identify how the pay of individual of UK differ based on different demographic features. Lastly,
the current research topic is important for other researcher who wants to conduct study on same
issue as well as society and respondent of survey.
Prior Knowledge
A study by Hill (2010) focuses on the position of the different social groups or demographic
feature relation with the income inequality in the UK. The study has stated that the dependent
variable such as pay gap changes as per the change in the independent variable such as
demographic features. The result of the study indicates that income inequality as per ethnicity,
gender and religion is existing in UK and this are going against the social justice principle of
UK. Women of UK are paying 21% less than the men.
However, on the other hand, Longhi and Platt (2008) has also discussed the issue of pay gap
based on demographic feature or qualities area such as gender, ethnicity, religion, disability, age
and same sex couple. It is analysed from the article that disabled men can expect higher pay as
compared to both disable women as well as non-disabled women. Also, it is identified from the
research paper that, all ethnic minority women and men have experienced pay gap in relation to
white British men except Indian and Chinese men. In addition, the study has stated that older
men had faced pay gap relative to prime age men, women as well as men in same sex couple do
not experience pay gap relative to married men. Further, it is also analysed that Muslim men
have experience low pay as compared to Christian Men.
⊘ This is a preview!⊘
Do you want full access?
Subscribe today to unlock all pages.
Trusted by 1+ million students worldwide
Further, it is also analysed from the CMA Ethnicity Profile by grade data of (Ethnicity Pay
Gap Report: 1st April 2020 to 31st March 2021. 2021) that, the Asian ethnicity group has
experienced higher pay gap (33%) as compared to Blank and Mixed ethnicity group. Also, it is
found out that Black ethnic group has experienced 33.8% median pay gap as compared to Asian,
Mixed and other ethnic group.
In addition, the (The ethnicity pay gap. 2017) has also based on the ethnicity pay gap issues
which has identified that White British women has experienced a pay gap of 23.6% relative to
White British men. Also, the Indian Immigrant women has experienced pay gap of 19.6%
relative to White British men. As per the opinion of author, the pay gap based on different
demographic feature such as gender, ethnicity is the biggest issue faced by the people who live
or work in UK.
In addition, another article, The gender pay gap in the UK: children and experience in work.
2022, has also analysed that the student aged 20 years has experienced higher pay gap relative to
high experienced and qualified individual. All the above article information, has stated that the
independent variable such as demographic features changes the dependent variable such as pay
gap to the great extent. For example, the different age, qualification, ethnicity of the people
shapes the pay or income of individual which ultimately causes income inequality in UK as well.
DATA AND METHODS
Research type: The present study is based upon quantitative study in which SPSS
software is used that help to analyse the data in an effective manner. The rationale for conducting
the study by complying quantitative data is such that it will help to answer the research question
so that effective outcome can be generated (Snyder, 2019). Moreover, it can be stated that to
determine the relationship between dependent and independent variable, quantitative study has
been opted which in turn assist to create a better outcome and measure the same into quantitative
manner. In this, dependent and independent variable are chosen from the data set i.e. pay scale of
selected participants, whereas sex, country of birth and ethnic group are independent variables.
Data collection: It is the method through which the scholar can collect the information in
order to meet the research objectives. For the present study both primary and secondary data has
used to provide authentic results and develop a better understanding. Under primary, 152
variable used in which 38778 respondents selected from the Understanding society dataset
Paraphrase This Document
Need a fresh take? Get an instant paraphrase of this document with our AI Paraphraser
deposited at UK data archive. On the other side, for secondary data collection method relevant
books and articles has been selected that provided effective outcome and gain better
understanding pertaining to pay gap and demographic information related to the respondents
(Pandey and Pandey, 2021). With the help of effective data collection methods, scholar is able to
present the findings in an effective manner by determining the results.
Data analysis: In order to derive effective outcome, it is essential to analyse the data in
an effective manner. There are two types of data that help to analyse the data which includes
SPSS and thematic. In the present study, only SPSS as a software will be adopted which in turn
assist to create a better outcome and determine the results with regard to relationship between
pay and demographic information.
RESULTS
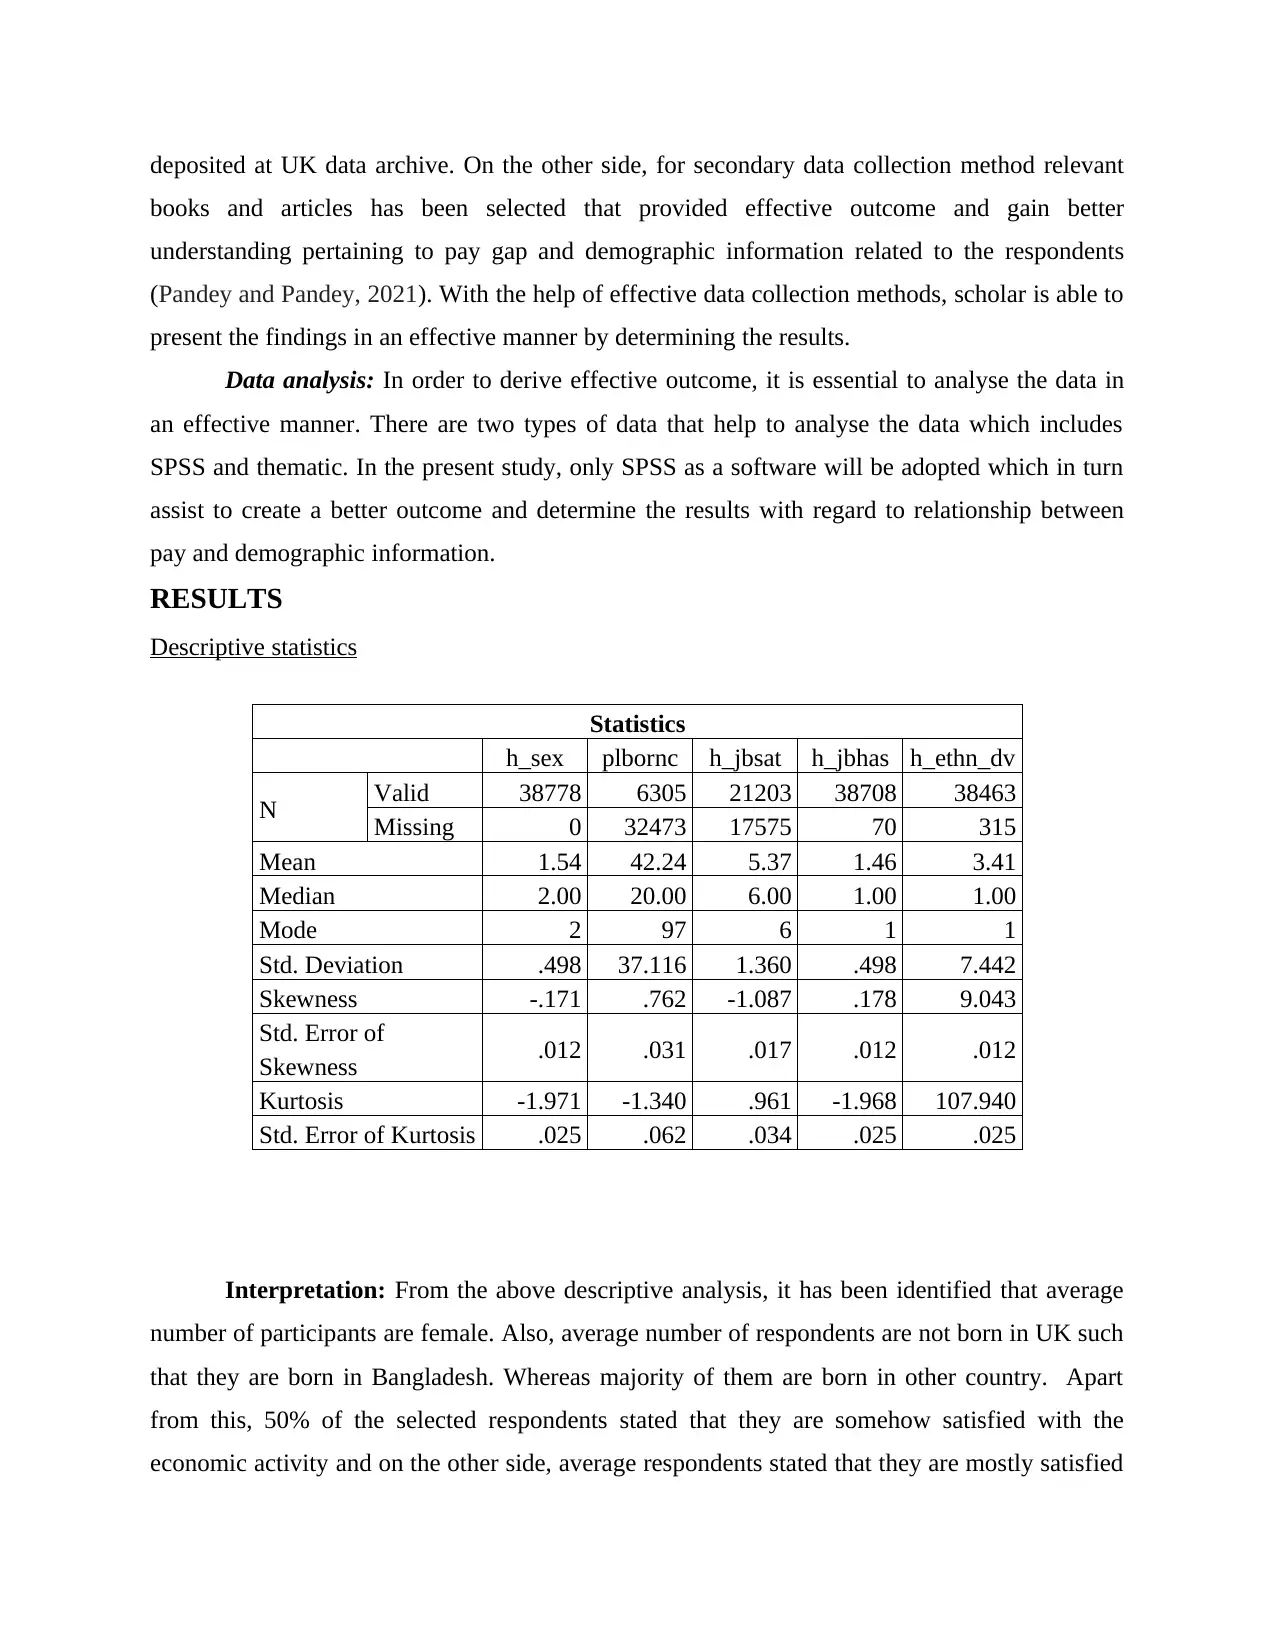
Descriptive statistics
Statistics
h_sex plbornc h_jbsat h_jbhas h_ethn_dv
N Valid 38778 6305 21203 38708 38463
Missing 0 32473 17575 70 315
Mean 1.54 42.24 5.37 1.46 3.41
Median 2.00 20.00 6.00 1.00 1.00
Mode 2 97 6 1 1
Std. Deviation .498 37.116 1.360 .498 7.442
Skewness -.171 .762 -1.087 .178 9.043
Std. Error of
Skewness .012 .031 .017 .012 .012
Kurtosis -1.971 -1.340 .961 -1.968 107.940
Std. Error of Kurtosis .025 .062 .034 .025 .025
Interpretation: From the above descriptive analysis, it has been identified that average
number of participants are female. Also, average number of respondents are not born in UK such
that they are born in Bangladesh. Whereas majority of them are born in other country. Apart
from this, 50% of the selected respondents stated that they are somehow satisfied with the
economic activity and on the other side, average respondents stated that they are mostly satisfied
books and articles has been selected that provided effective outcome and gain better
understanding pertaining to pay gap and demographic information related to the respondents
(Pandey and Pandey, 2021). With the help of effective data collection methods, scholar is able to
present the findings in an effective manner by determining the results.
Data analysis: In order to derive effective outcome, it is essential to analyse the data in
an effective manner. There are two types of data that help to analyse the data which includes
SPSS and thematic. In the present study, only SPSS as a software will be adopted which in turn
assist to create a better outcome and determine the results with regard to relationship between
pay and demographic information.
RESULTS
Descriptive statistics
Statistics
h_sex plbornc h_jbsat h_jbhas h_ethn_dv
N Valid 38778 6305 21203 38708 38463
Missing 0 32473 17575 70 315
Mean 1.54 42.24 5.37 1.46 3.41
Median 2.00 20.00 6.00 1.00 1.00
Mode 2 97 6 1 1
Std. Deviation .498 37.116 1.360 .498 7.442
Skewness -.171 .762 -1.087 .178 9.043
Std. Error of
Skewness .012 .031 .017 .012 .012
Kurtosis -1.971 -1.340 .961 -1.968 107.940
Std. Error of Kurtosis .025 .062 .034 .025 .025
Interpretation: From the above descriptive analysis, it has been identified that average
number of participants are female. Also, average number of respondents are not born in UK such
that they are born in Bangladesh. Whereas majority of them are born in other country. Apart
from this, 50% of the selected respondents stated that they are somehow satisfied with the
economic activity and on the other side, average respondents stated that they are mostly satisfied
with the same. However, most of the selected respondents stated that they paid for last week and
that is why, they are satisfied with the working. In accordance with the ethnicity of the selected
respondents, it has been identified that majority of them are British and average number of
respondents are Gypsy or Irish Traveller.
Overall, it can be stated that all the selected participants provide an effective results and
as the majority of the respondents are female and that is why, they are highly satisfied with the
working performance. Also, most of the female are British and that is why, they are somehow
satisfied with their working status.
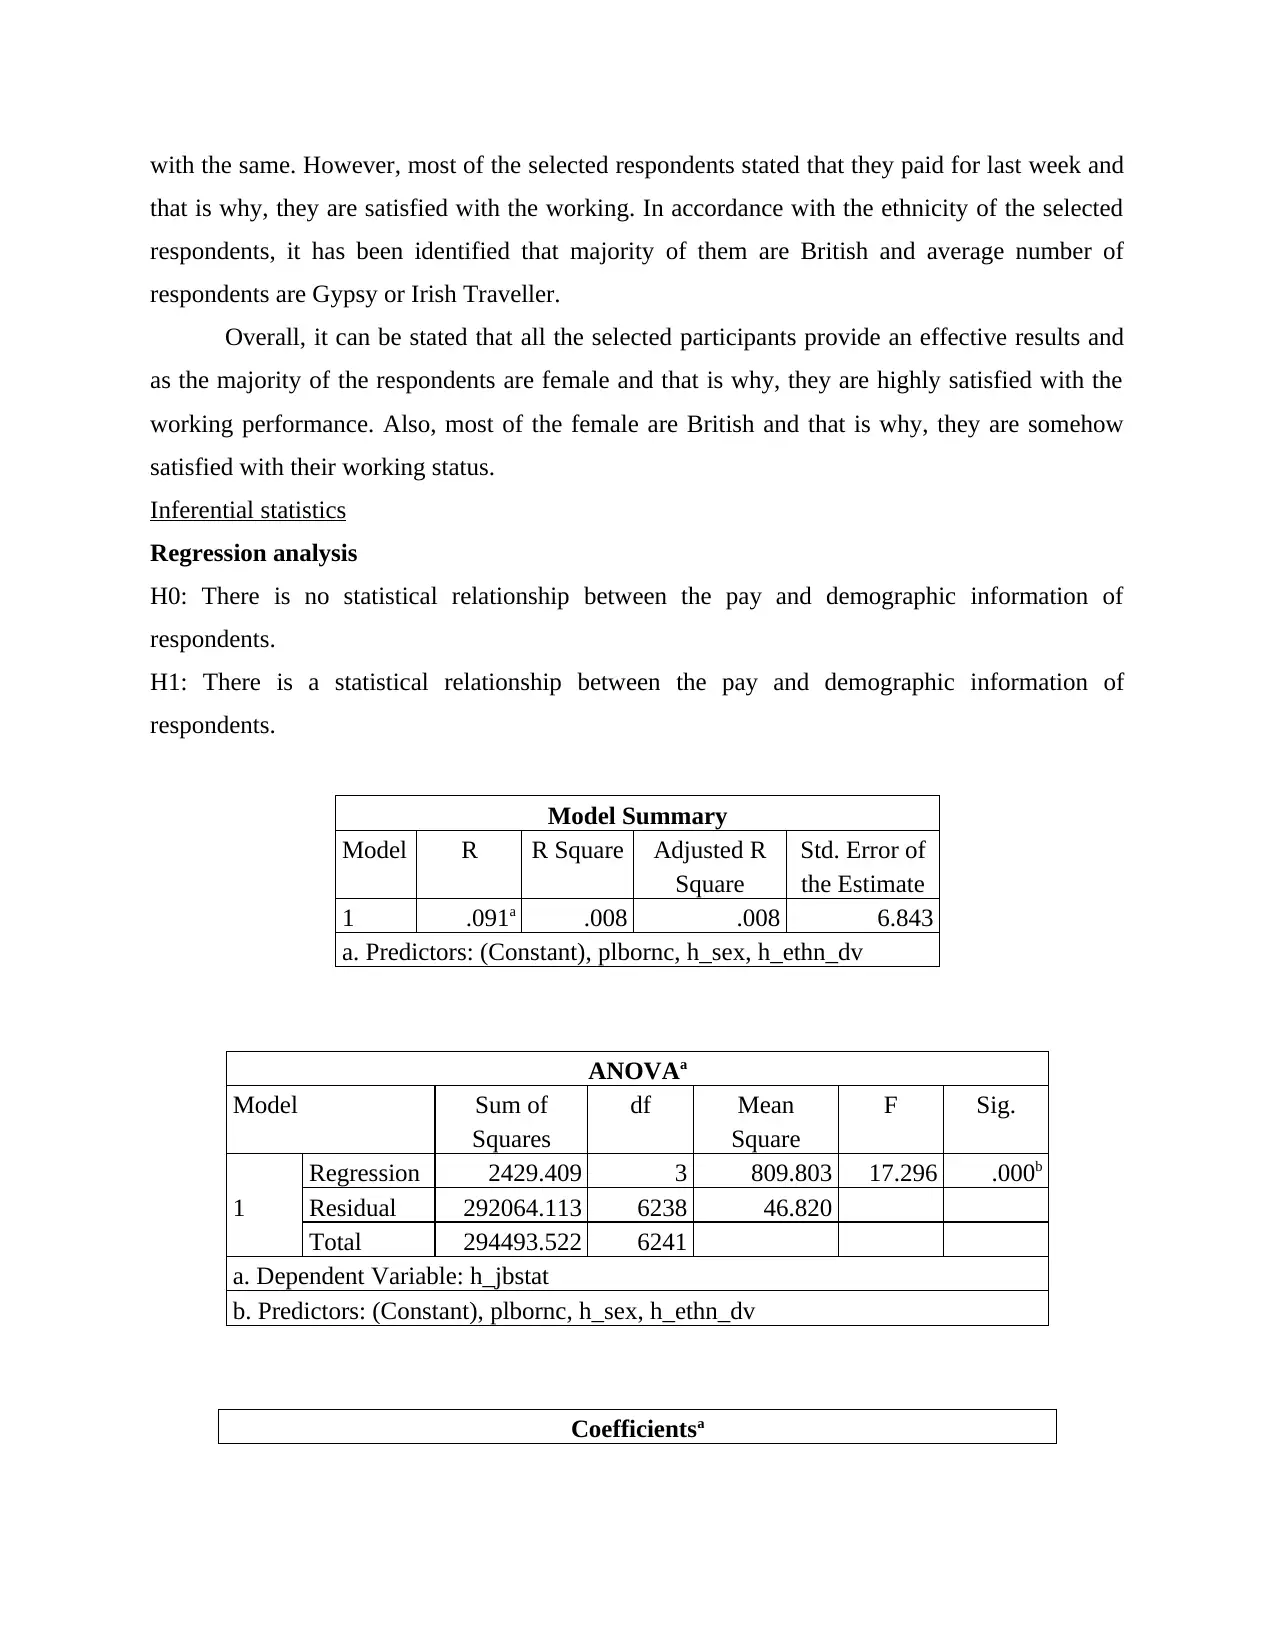
Inferential statistics
Regression analysis
H0: There is no statistical relationship between the pay and demographic information of
respondents.
H1: There is a statistical relationship between the pay and demographic information of
respondents.
Model Summary
Model R R Square Adjusted R
Square
Std. Error of
the Estimate
1 .091a .008 .008 6.843
a. Predictors: (Constant), plbornc, h_sex, h_ethn_dv
ANOVAa
Model Sum of
Squares
df Mean
Square
F Sig.
1
Regression 2429.409 3 809.803 17.296 .000b
Residual 292064.113 6238 46.820
Total 294493.522 6241
a. Dependent Variable: h_jbstat
b. Predictors: (Constant), plbornc, h_sex, h_ethn_dv
Coefficientsa
that is why, they are satisfied with the working. In accordance with the ethnicity of the selected
respondents, it has been identified that majority of them are British and average number of
respondents are Gypsy or Irish Traveller.
Overall, it can be stated that all the selected participants provide an effective results and
as the majority of the respondents are female and that is why, they are highly satisfied with the
working performance. Also, most of the female are British and that is why, they are somehow
satisfied with their working status.
Inferential statistics
Regression analysis
H0: There is no statistical relationship between the pay and demographic information of
respondents.
H1: There is a statistical relationship between the pay and demographic information of
respondents.
Model Summary
Model R R Square Adjusted R
Square
Std. Error of
the Estimate
1 .091a .008 .008 6.843
a. Predictors: (Constant), plbornc, h_sex, h_ethn_dv
ANOVAa
Model Sum of
Squares
df Mean
Square
F Sig.
1
Regression 2429.409 3 809.803 17.296 .000b
Residual 292064.113 6238 46.820
Total 294493.522 6241
a. Dependent Variable: h_jbstat
b. Predictors: (Constant), plbornc, h_sex, h_ethn_dv
Coefficientsa
⊘ This is a preview!⊘
Do you want full access?
Subscribe today to unlock all pages.
Trusted by 1+ million students worldwide
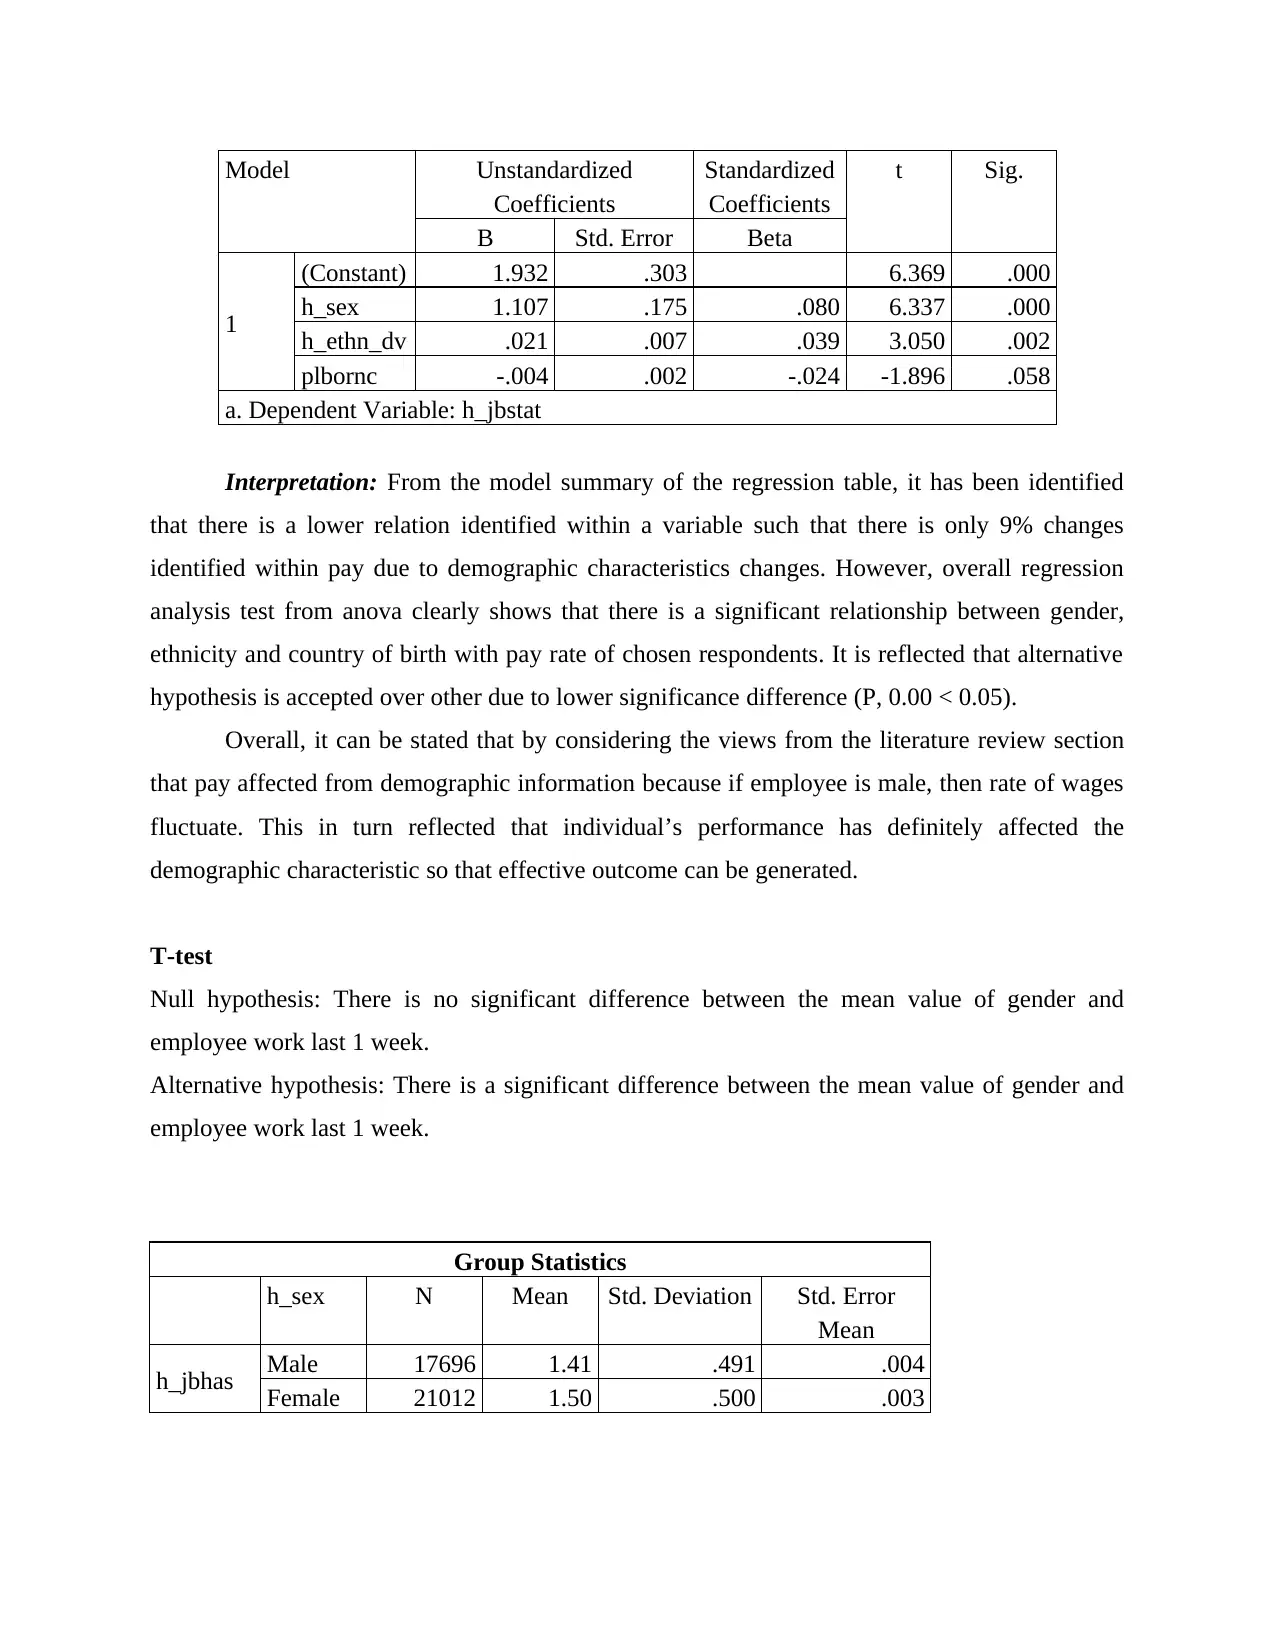
Model Unstandardized
Coefficients
Standardized
Coefficients
t Sig.
B Std. Error Beta
1
(Constant) 1.932 .303 6.369 .000
h_sex 1.107 .175 .080 6.337 .000
h_ethn_dv .021 .007 .039 3.050 .002
plbornc -.004 .002 -.024 -1.896 .058
a. Dependent Variable: h_jbstat
Interpretation: From the model summary of the regression table, it has been identified
that there is a lower relation identified within a variable such that there is only 9% changes
identified within pay due to demographic characteristics changes. However, overall regression
analysis test from anova clearly shows that there is a significant relationship between gender,
ethnicity and country of birth with pay rate of chosen respondents. It is reflected that alternative
hypothesis is accepted over other due to lower significance difference (P, 0.00 < 0.05).
Overall, it can be stated that by considering the views from the literature review section
that pay affected from demographic information because if employee is male, then rate of wages
fluctuate. This in turn reflected that individual’s performance has definitely affected the
demographic characteristic so that effective outcome can be generated.
T-test
Null hypothesis: There is no significant difference between the mean value of gender and
employee work last 1 week.
Alternative hypothesis: There is a significant difference between the mean value of gender and
employee work last 1 week.
Group Statistics
h_sex N Mean Std. Deviation Std. Error
Mean
h_jbhas Male 17696 1.41 .491 .004
Female 21012 1.50 .500 .003
Coefficients
Standardized
Coefficients
t Sig.
B Std. Error Beta
1
(Constant) 1.932 .303 6.369 .000
h_sex 1.107 .175 .080 6.337 .000
h_ethn_dv .021 .007 .039 3.050 .002
plbornc -.004 .002 -.024 -1.896 .058
a. Dependent Variable: h_jbstat
Interpretation: From the model summary of the regression table, it has been identified
that there is a lower relation identified within a variable such that there is only 9% changes
identified within pay due to demographic characteristics changes. However, overall regression
analysis test from anova clearly shows that there is a significant relationship between gender,
ethnicity and country of birth with pay rate of chosen respondents. It is reflected that alternative
hypothesis is accepted over other due to lower significance difference (P, 0.00 < 0.05).
Overall, it can be stated that by considering the views from the literature review section
that pay affected from demographic information because if employee is male, then rate of wages
fluctuate. This in turn reflected that individual’s performance has definitely affected the
demographic characteristic so that effective outcome can be generated.
T-test
Null hypothesis: There is no significant difference between the mean value of gender and
employee work last 1 week.
Alternative hypothesis: There is a significant difference between the mean value of gender and
employee work last 1 week.
Group Statistics
h_sex N Mean Std. Deviation Std. Error
Mean
h_jbhas Male 17696 1.41 .491 .004
Female 21012 1.50 .500 .003
Paraphrase This Document
Need a fresh take? Get an instant paraphrase of this document with our AI Paraphraser
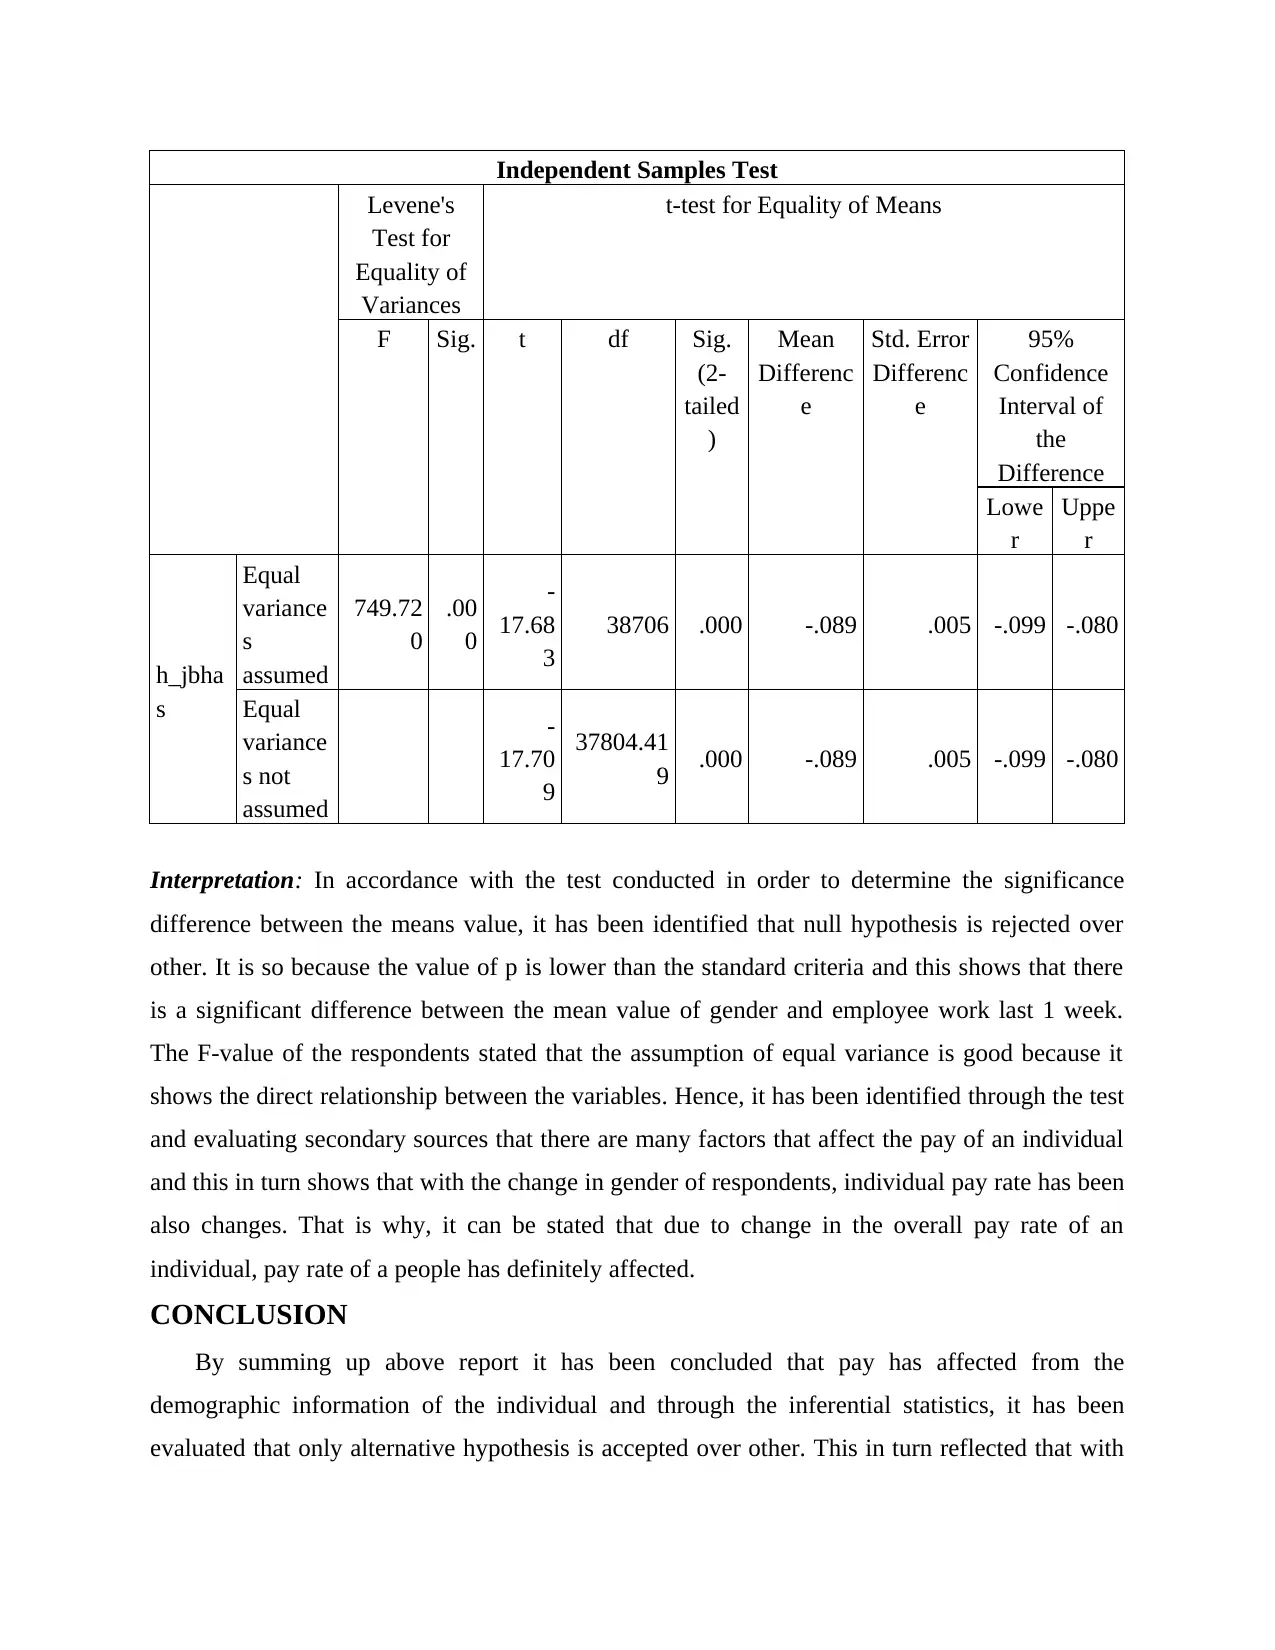
Independent Samples Test
Levene's
Test for
Equality of
Variances
t-test for Equality of Means
F Sig. t df Sig.
(2-
tailed
)
Mean
Differenc
e
Std. Error
Differenc
e
95%
Confidence
Interval of
the
Difference
Lowe
r
Uppe
r
h_jbha
s
Equal
variance
s
assumed
749.72
0
.00
0
-
17.68
3
38706 .000 -.089 .005 -.099 -.080
Equal
variance
s not
assumed
-
17.70
9
37804.41
9 .000 -.089 .005 -.099 -.080
Interpretation: In accordance with the test conducted in order to determine the significance
difference between the means value, it has been identified that null hypothesis is rejected over
other. It is so because the value of p is lower than the standard criteria and this shows that there
is a significant difference between the mean value of gender and employee work last 1 week.
The F-value of the respondents stated that the assumption of equal variance is good because it
shows the direct relationship between the variables. Hence, it has been identified through the test
and evaluating secondary sources that there are many factors that affect the pay of an individual
and this in turn shows that with the change in gender of respondents, individual pay rate has been
also changes. That is why, it can be stated that due to change in the overall pay rate of an
individual, pay rate of a people has definitely affected.
CONCLUSION
By summing up above report it has been concluded that pay has affected from the
demographic information of the individual and through the inferential statistics, it has been
evaluated that only alternative hypothesis is accepted over other. This in turn reflected that with
the change in any mean value of the independent variable, then dependent variable has affected
due to which null hypothesis is rejected. The strength of the current report is such that it
determines the inter-dependence between the variable and with the help of selected secondary
source, scholar is able to determine the pattern of a study so that effective outcome can be
generated. However, on the other side, it has been identified that study also have weakness in
which control variable are not identified and that is why, more factor related to pay need to be
consider that assist to generate a better outcome. Also, it can be stated that from the results
generated that there is a direct impact identified over the pay when demographic information has
changes. Such that individual ethnicity, country in which he/she born, gender, qualification
actually decide the pay of a company. That is why, it can be stated that the results generated help
to create a direct impact over the managerial perspective so that they make decision effectively.
⊘ This is a preview!⊘
Do you want full access?
Subscribe today to unlock all pages.
Trusted by 1+ million students worldwide
REFERENCES
Books and journals
Hills, J., 2010. An anatomy of economic inequality in the UK-report of the national equality
panel. LSE STICERD Research Paper No. CASEREPORT60.
Longhi S., and Platt, L. (2008) Pay Gaps Across Equalities Areas: Ananalysis of pay gaps and
pay penalties by sex, ethnicity, religion, disability, sexual orientation and age using the
Labour Force Survey. Institute for Social and Economic Research, Research Report 9.
University of Essex.
Pandey, P. and Pandey, M.M., 2021. Research methodology tools and techniques. Bridge Center.
Snyder, H., 2019. Literature review as a research methodology: An overview and
guidelines. Journal of business research. 104. pp.333-339.
Online
Ethnicity Pay Gap Report: 1st April 2020 to 31st March 2021. 2021. [Online]. Available
through:< https://www.gov.uk/government/publications/ethnicity-pay-gap-report-april-
2020-to-march-2021/ethnicity-pay-gap-report-1-april-2020-to-31-march-2021>
The ethnicity pay gap. 2017. [Online]. Available through:<
https://www.equalityhumanrights.com/sites/default/files/research-report-108-the-
ethnicity-pay-gap.pdf>
The gender pay gap in the UK: children and experience in work. 2022. [Online]. Available
through:< https://academic.oup.com/oxrep/article/36/4/855/6124298>
1
1 out of 10
Related Documents


Your All-in-One AI-Powered Toolkit for Academic Success.
+13062052269
info@desklib.com
Available 24*7 on WhatsApp / Email
![[object Object]](/_next/static/media/star-bottom.7253800d.svg)
Unlock your academic potential
Copyright © 2020–2026 A2Z Services. All Rights Reserved. Developed and managed by ZUCOL.